| Param | Original file | Final file |
|---|---|---|
| Filename | modeM0/AS1T03_197T01_9000003626_24796cztM0_level2.evt | modeM0/AS1T03_197T01_9000003626_24796cztM0_level2_quad_clean.evt |
| Size (bytes) | 2,578,970,880 | 396,259,200 |
| Size | 2.4 GB | 377.9 MB |
| Events in quadrant A | 15,461,483 | 2,569,892 |
| Events in quadrant B | 29,391,351 | 2,369,783 |
| Events in quadrant C | 15,717,786 | 2,479,272 |
| Events in quadrant D | 15,438,119 | 2,446,252 |
| Mode M9 | |||
|---|---|---|---|
| Quadrant | BADHDUFLAG | Total packets | Discarded packets |
| A | 0 | 70 | 0 |
| B | 0 | 70 | 0 |
| C | 0 | 70 | 0 |
| D | 0 | 70 | 0 |
| Mode SS | |||
|---|---|---|---|
| Quadrant | BADHDUFLAG | Total packets | Discarded packets |
| A | 0 | 634 | 0 |
| B | 0 | 634 | 0 |
| C | 0 | 634 | 0 |
| D | 0 | 634 | 0 |
| Mode M0 | |||
|---|---|---|---|
| Quadrant | BADHDUFLAG | Total packets | Discarded packets |
| A | 0 | 64605 | 5 |
| B | 0 | 107068 | 5 |
| C | 0 | 65504 | 5 |
| D | 0 | 65960 | 12 |
| Quadrant | Total seconds | Saturated seconds | Saturation percentage |
|---|---|---|---|
| A | 31072 | 210 | 0.675850% |
| B | 31072 | 5665 | 18.231849% |
| C | 31073 | 353 | 1.136034% |
| D | 31071 | 199 | 0.640469% |
Noise dominated data is calculated using 1-second bins in cleaned event files. If a bin has >2000 counts, and if more than 50% of those come from <1% of pixels, then it is considered to be noise-dominated and hence unusable.
| Quadrant | # 1 sec bins | Bins with >0 counts | Bins with >2000 counts | High rate bins dominated by noise | Noise dominated (total time) | Noise dominated (detector-on time) | Marked lightcurve |
|---|---|---|---|---|---|---|---|
| A | 38187 | 31078 | 7 | 7 | 0.02% | 0.02% | 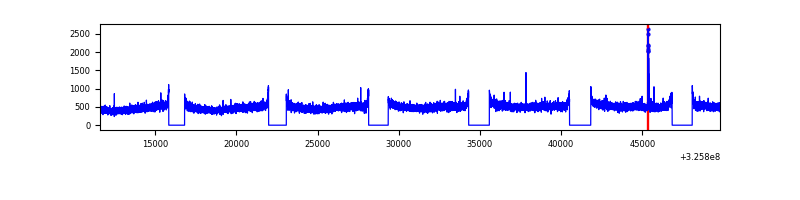 |
| B | 38187 | 31078 | 4488 | 4488 | 11.75% | 14.44% | 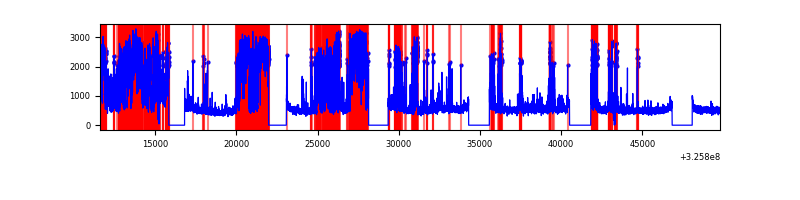 |
| C | 38188 | 31079 | 2 | 2 | 0.01% | 0.01% | 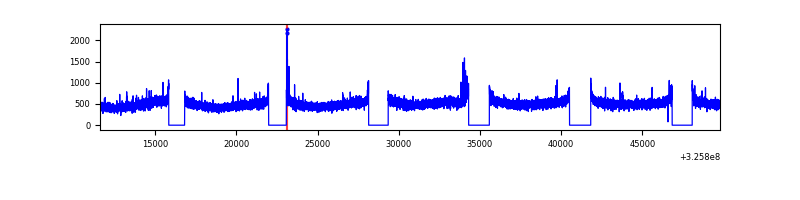 |
| D | 38187 | 31078 | 68 | 68 | 0.18% | 0.22% | 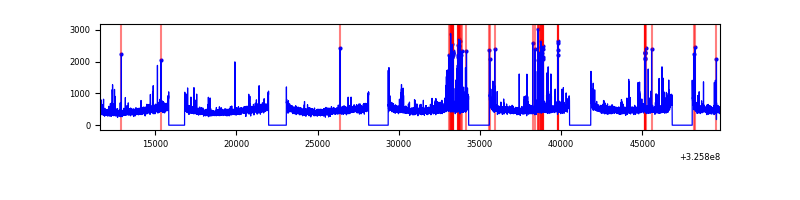 |
Top three noisy pixels from each quadrant. If the there are fewer than three noisy pixels in the level2.evt file, extra rows are filled as -1
| Pixel properties | Quadrant properties | ||||||
|---|---|---|---|---|---|---|---|
| Quadrant | DetID | PixID | Counts | Sigma | Mean | Median | Sigma |
| A | 13 | 254 | 46582 | 54.16 | 3996 | 3927 | 787.6 |
| A | 15 | 223 | 44856 | 51.97 | 3996 | 3927 | 787.6 |
| A | 3 | 137 | 35903 | 40.6 | 3996 | 3927 | 787.6 |
| B | 3 | 64 | 14830247 | 22453.29 | 3531 | 3455 | 660.3 |
| B | 0 | 189 | 599311 | 902.35 | 3531 | 3455 | 660.3 |
| B | 12 | 111 | 80319 | 116.4 | 3531 | 3455 | 660.3 |
| C | 14 | 238 | 608899 | 702.2 | 3768 | 3797 | 861.7 |
| C | 10 | 91 | 259497 | 296.73 | 3768 | 3797 | 861.7 |
| C | 8 | 208 | 90006 | 100.04 | 3768 | 3797 | 861.7 |
| D | 1 | 52 | 416618 | 453.5 | 3841 | 3728 | 910.5 |
| D | 8 | 195 | 231515 | 250.19 | 3841 | 3728 | 910.5 |
| D | 2 | 244 | 189218 | 203.73 | 3841 | 3728 | 910.5 |
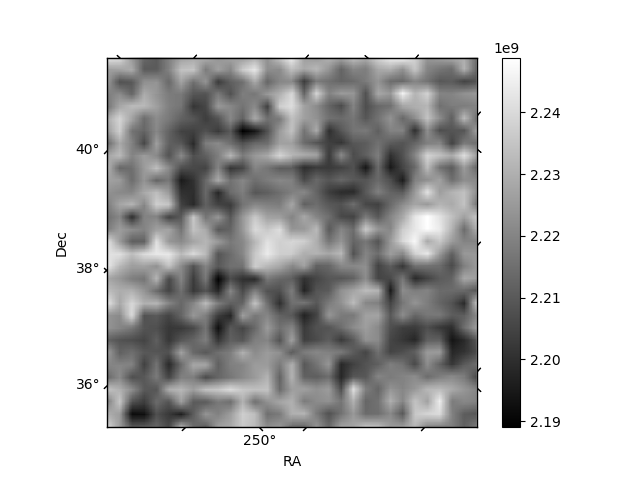
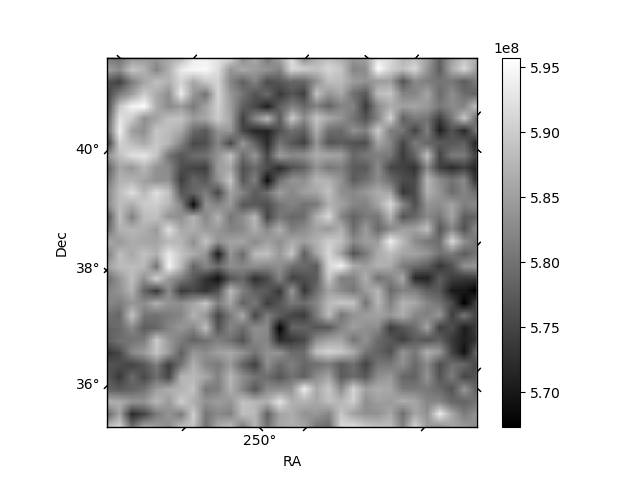
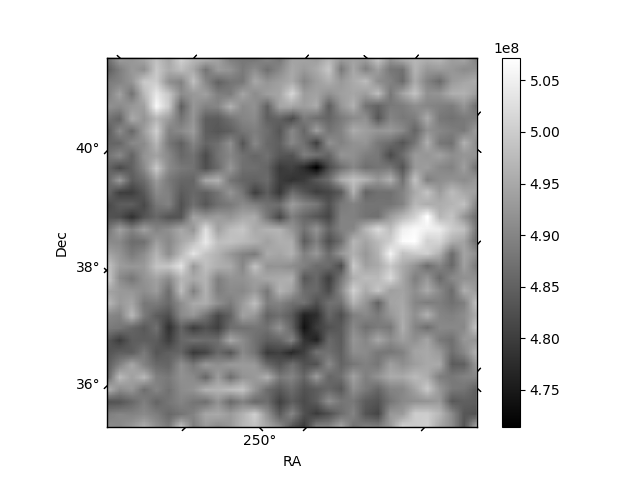
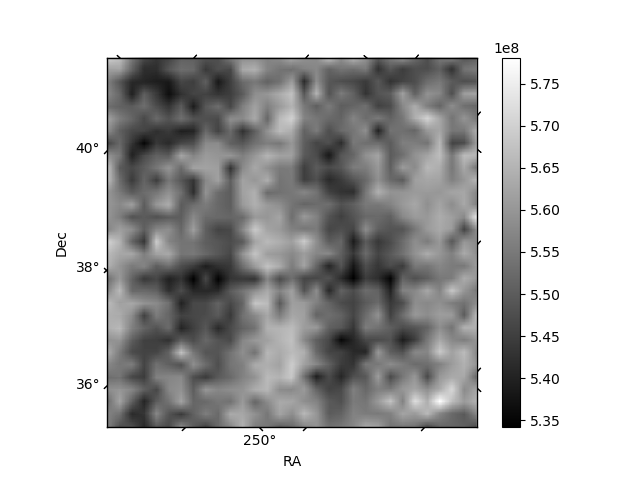
Histogram calculated using DETX and DETY for each event in the final _common_clean file
| Quadrant A | 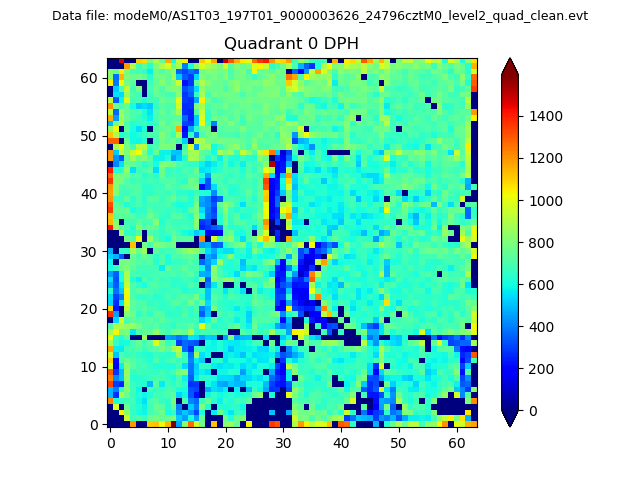 |
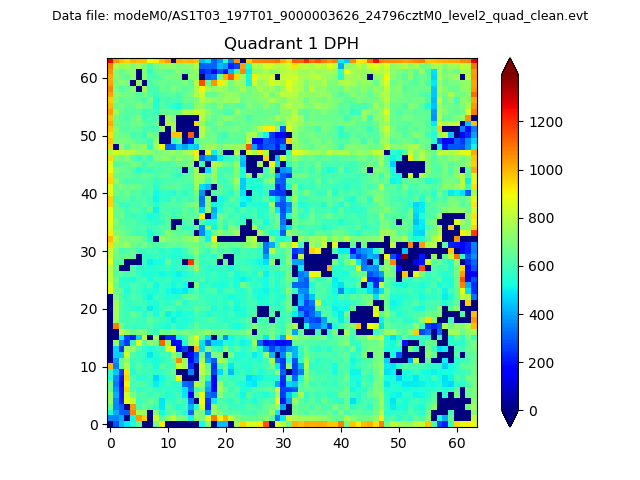 |
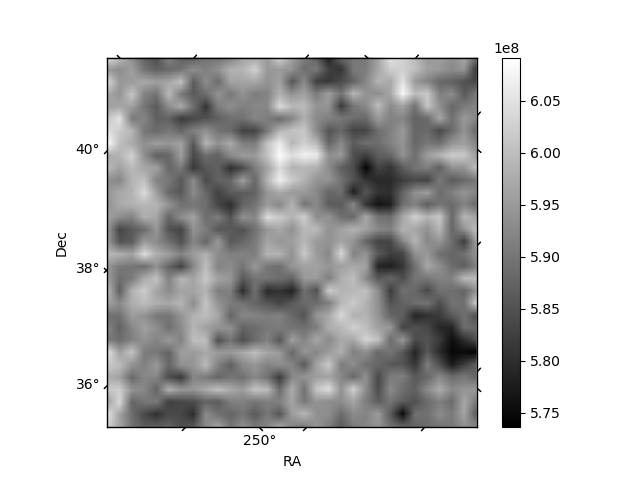
Quadrant B |
|---|---|---|---|
| Quadrant D | 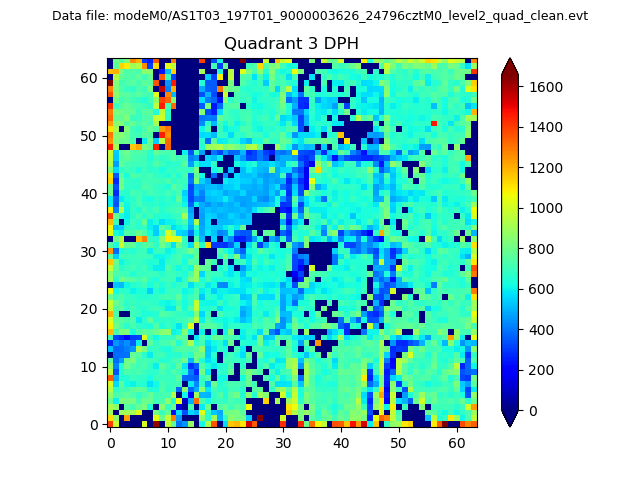 |
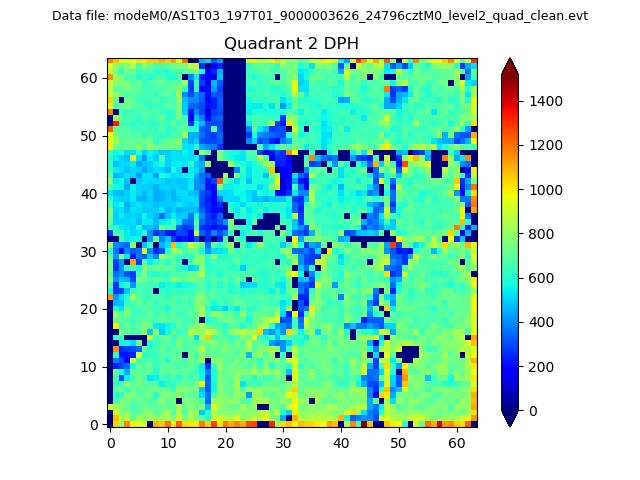 |
Quadrant C |
| Plot type | Count rate plots | Images |
|---|---|---|
| Comparison with Poisson distribution Blue bars denote a histogram of data divided into 1 sec bins. Red curve is a Poisson curve with rate = median count rate of data. |
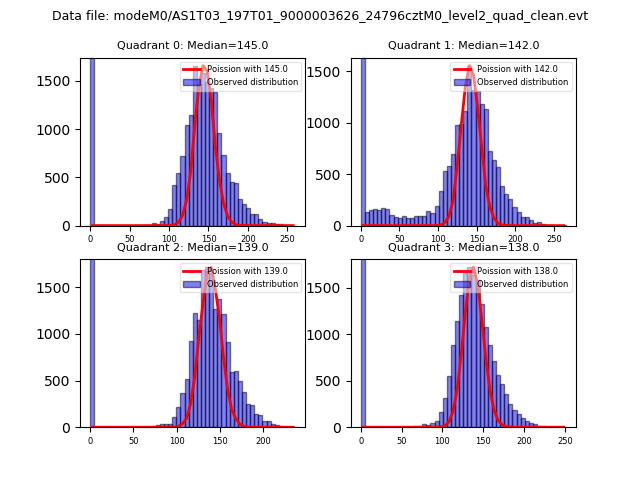 |
 |
| Quadrant-wise count rates Data is divided into 100 sec bins |
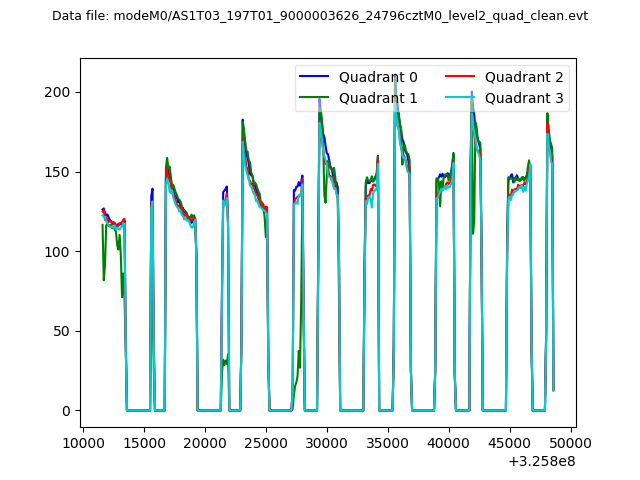 |
|
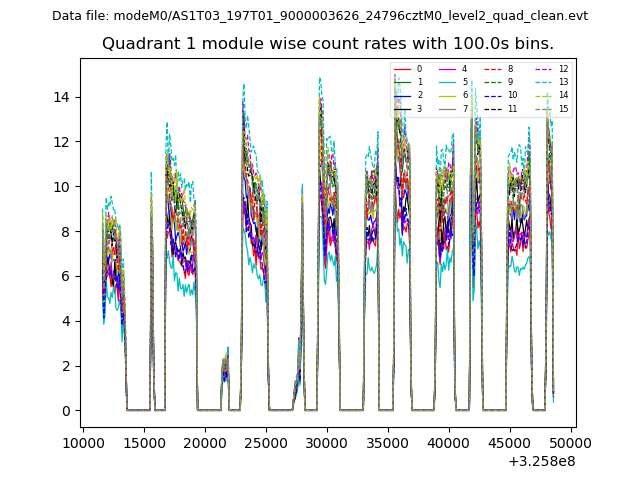
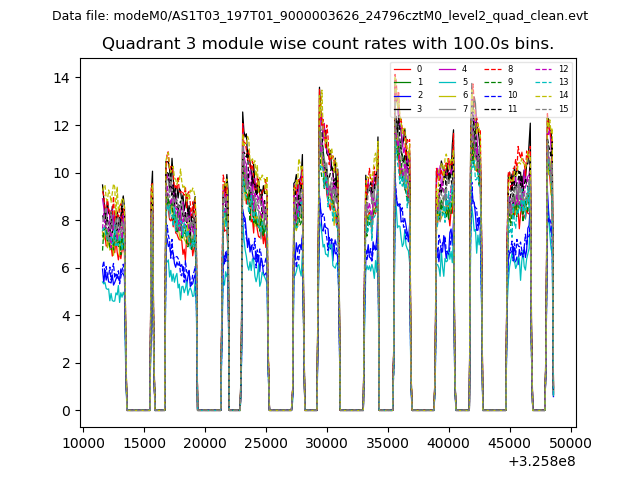
| Module-wise count rates for Quadrant A Data is divided into 100 sec bins |
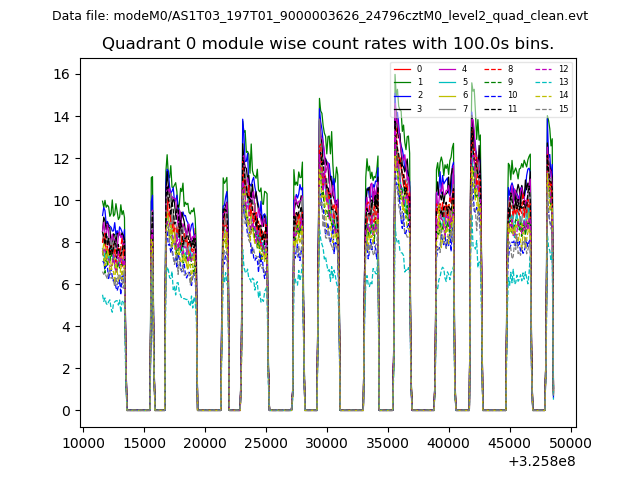 |
 |
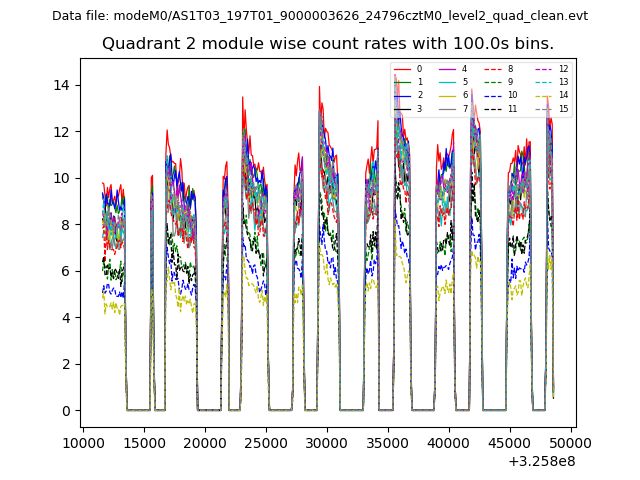
| Module-wise count rates for Quadrant B Data is divided into 100 sec bins |
 |
 |
| Module-wise count rates for Quadrant C Data is divided into 100 sec bins |
 |
 |
| Module-wise count rates for Quadrant D Data is divided into 100 sec bins |
 |
 |
| Parameter | Plot |
|---|---|
| CZT HV Monitor | 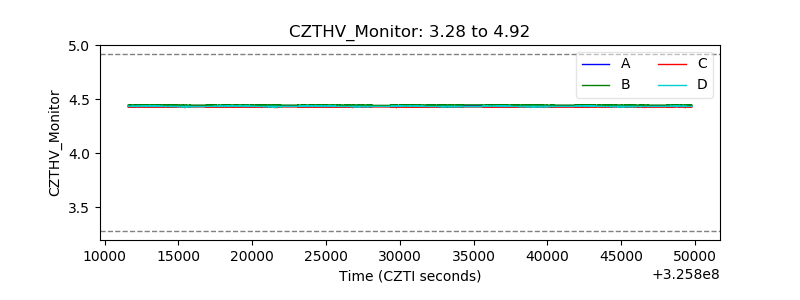 |
| D_VDD | 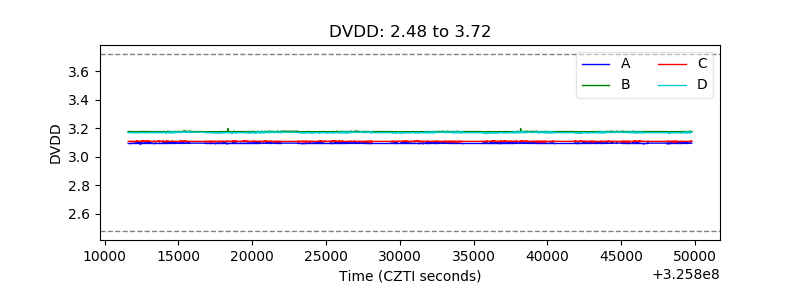 |
| Temperature 1 |  |
| Veto HV Monitor | 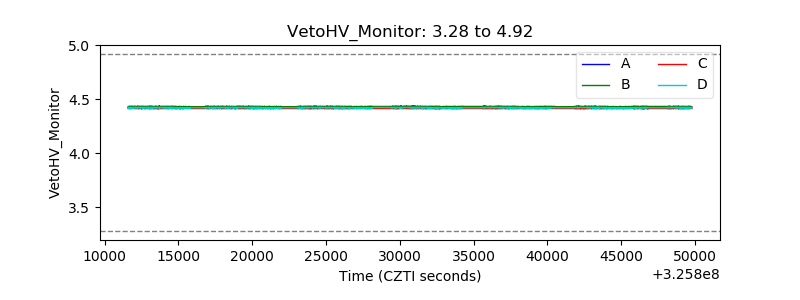 |
| Veto LLD | 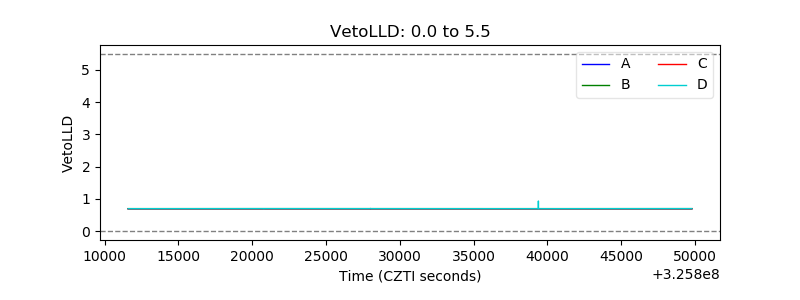 |
| Alpha Counter |  |
| _CPM_Rate | 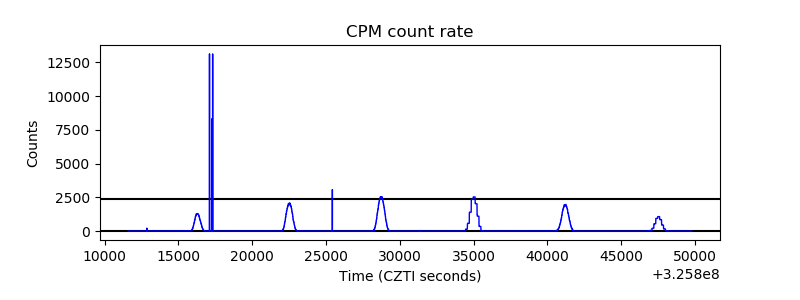 |
| CZT Counter | 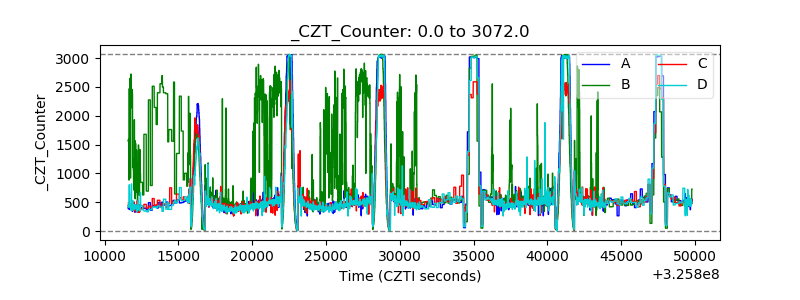 |
| +2.5 Volts monitor |  |
| +5 Volts monitor | 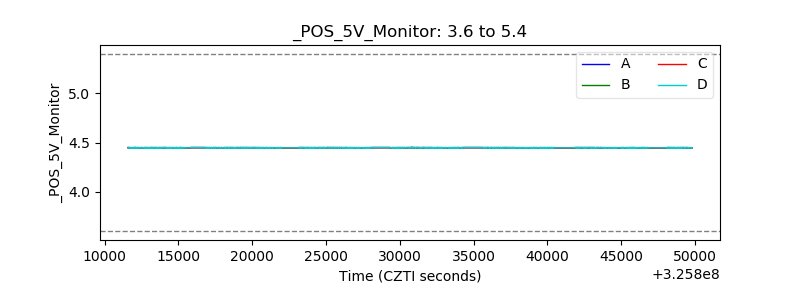 |
| _ROLL_ROT | 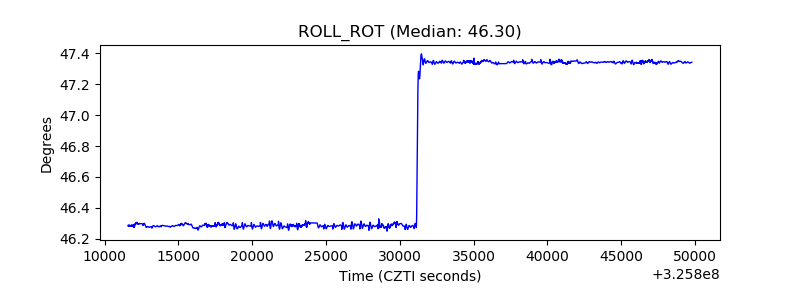 |
| _Roll_DEC | 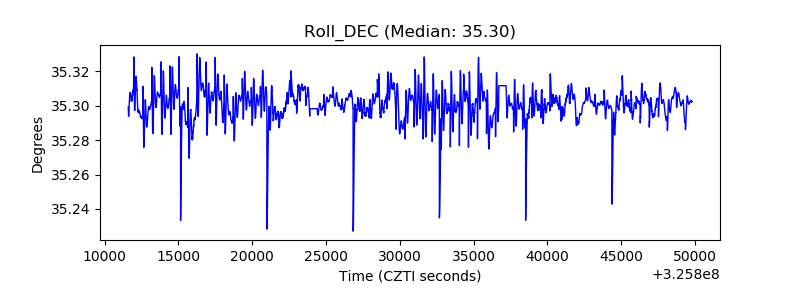 |
| _Roll_RA | 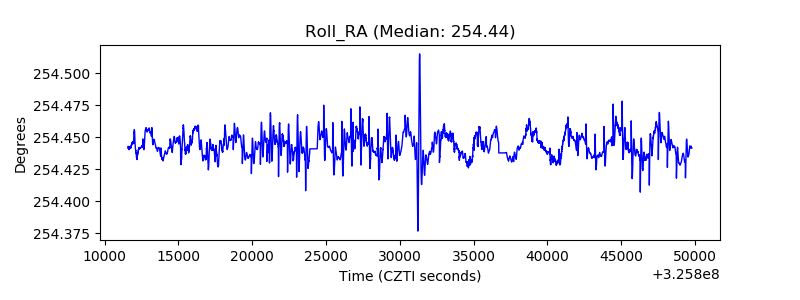 |
| Veto Counter | 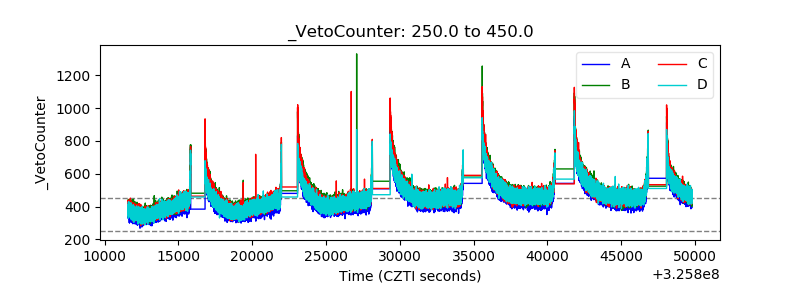 |