| Param | Original file | Final file |
|---|---|---|
| Filename | modeM0/AS1T03_197T01_9000003626_24797cztM0_level2.evt | modeM0/AS1T03_197T01_9000003626_24797cztM0_level2_quad_clean.evt |
| Size (bytes) | 461,263,680 | 71,608,320 |
| Size | 439.9 MB | 68.3 MB |
| Events in quadrant A | 3,317,838 | 437,257 |
| Events in quadrant B | 3,408,522 | 439,085 |
| Events in quadrant C | 3,325,585 | 423,024 |
| Events in quadrant D | 3,477,436 | 417,136 |
| Mode M9 | |||
|---|---|---|---|
| Quadrant | BADHDUFLAG | Total packets | Discarded packets |
| A | 0 | 11 | 0 |
| B | 0 | 11 | 0 |
| C | 0 | 11 | 0 |
| D | 0 | 11 | 0 |
| Mode SS | |||
|---|---|---|---|
| Quadrant | BADHDUFLAG | Total packets | Discarded packets |
| A | 0 | 130 | 0 |
| B | 0 | 130 | 0 |
| C | 0 | 130 | 0 |
| D | 0 | 130 | 0 |
| Mode M0 | |||
|---|---|---|---|
| Quadrant | BADHDUFLAG | Total packets | Discarded packets |
| A | 0 | 13515 | 1 |
| B | 0 | 13734 | 1 |
| C | 0 | 13544 | 1 |
| D | 0 | 14247 | 1 |
| Quadrant | Total seconds | Saturated seconds | Saturation percentage |
|---|---|---|---|
| A | 6478 | 132 | 2.037666% |
| B | 6479 | 147 | 2.268869% |
| C | 6479 | 138 | 2.129958% |
| D | 6479 | 164 | 2.531255% |
Noise dominated data is calculated using 1-second bins in cleaned event files. If a bin has >2000 counts, and if more than 50% of those come from <1% of pixels, then it is considered to be noise-dominated and hence unusable.
| Quadrant | # 1 sec bins | Bins with >0 counts | Bins with >2000 counts | High rate bins dominated by noise | Noise dominated (total time) | Noise dominated (detector-on time) | Marked lightcurve |
|---|---|---|---|---|---|---|---|
| A | 7523 | 6479 | 0 | 0 | 0.00% | 0.00% |  |
| B | 7524 | 6480 | 9 | 9 | 0.12% | 0.14% |  |
| C | 7524 | 6480 | 1 | 1 | 0.01% | 0.02% |  |
| D | 7524 | 6480 | 62 | 62 | 0.82% | 0.96% |  |
Top three noisy pixels from each quadrant. If the there are fewer than three noisy pixels in the level2.evt file, extra rows are filled as -1
| Pixel properties | Quadrant properties | ||||||
|---|---|---|---|---|---|---|---|
| Quadrant | DetID | PixID | Counts | Sigma | Mean | Median | Sigma |
| A | 2 | 79 | 10612 | 57.45 | 856 | 840 | 170.1 |
| A | 13 | 254 | 10525 | 56.94 | 856 | 840 | 170.1 |
| A | 3 | 137 | 7563 | 39.53 | 856 | 840 | 170.1 |
| B | 0 | 189 | 43033 | 263.83 | 840 | 819 | 160.0 |
| B | 3 | 64 | 42928 | 263.18 | 840 | 819 | 160.0 |
| B | 12 | 111 | 19444 | 116.4 | 840 | 819 | 160.0 |
| C | 14 | 238 | 131613 | 698.68 | 806 | 812 | 187.2 |
| C | 2 | 16 | 27112 | 140.48 | 806 | 812 | 187.2 |
| C | 5 | 112 | 19998 | 102.48 | 806 | 812 | 187.2 |
| D | 1 | 52 | 273801 | 1388.48 | 823 | 800 | 196.6 |
| D | 8 | 195 | 52300 | 261.93 | 823 | 800 | 196.6 |
| D | 2 | 234 | 25594 | 126.1 | 823 | 800 | 196.6 |
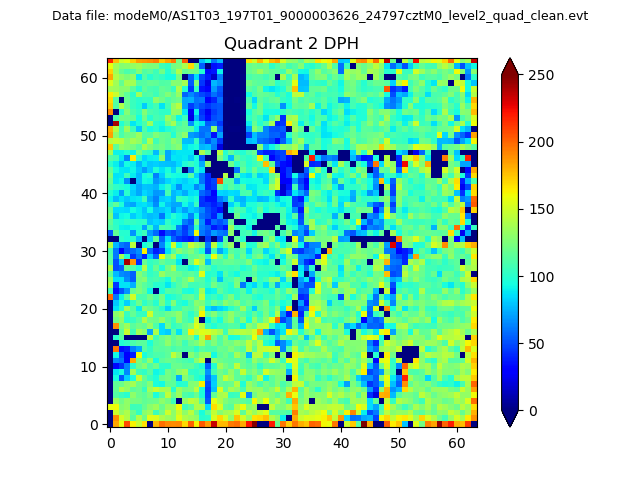
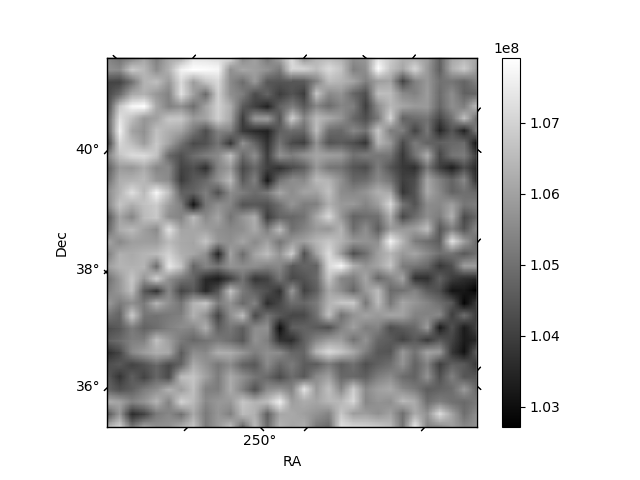
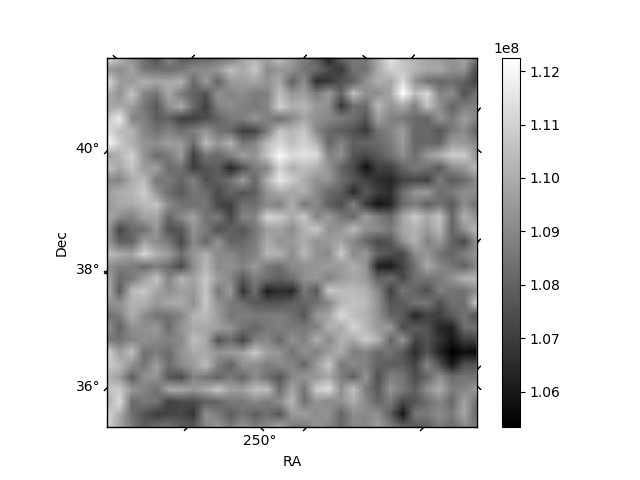
Histogram calculated using DETX and DETY for each event in the final _common_clean file
| Quadrant A | 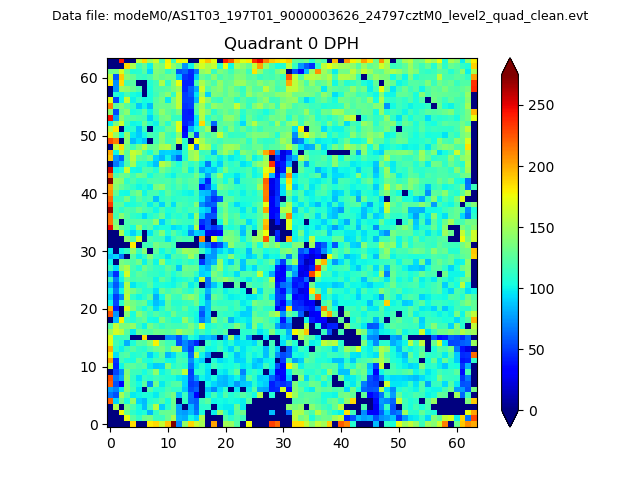 |
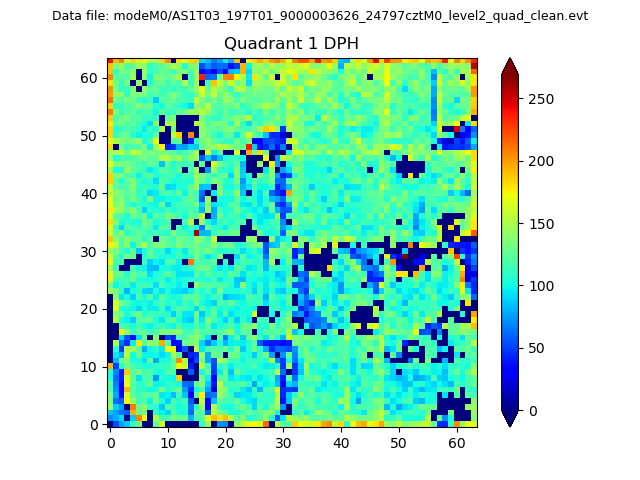 |
Quadrant B |
|---|---|---|---|
| Quadrant D | 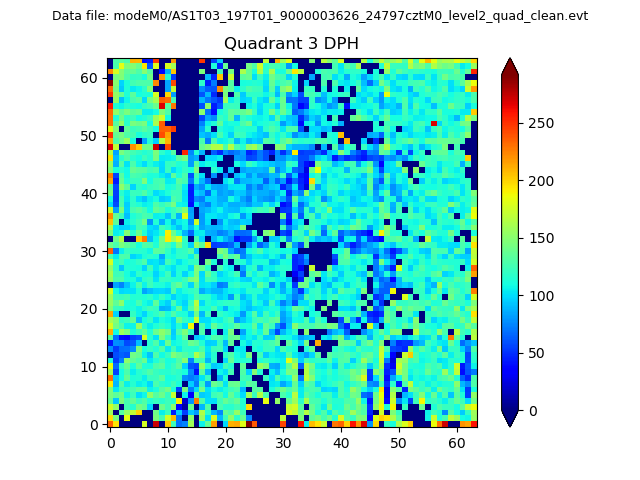 |
 |
Quadrant C |
| Plot type | Count rate plots | Images |
|---|---|---|
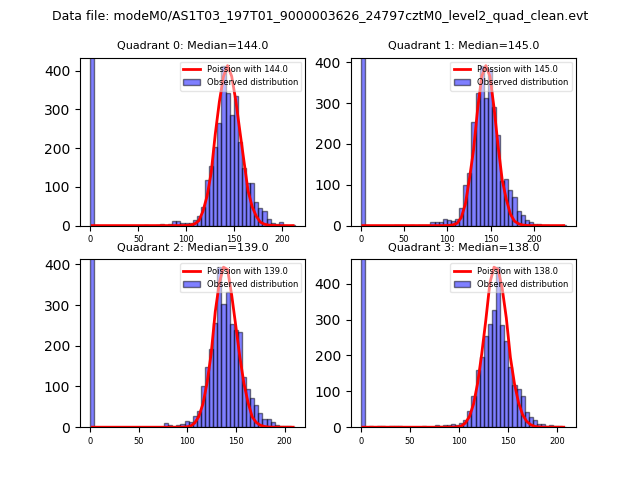
| Comparison with Poisson distribution Blue bars denote a histogram of data divided into 1 sec bins. Red curve is a Poisson curve with rate = median count rate of data. |
 |
 |
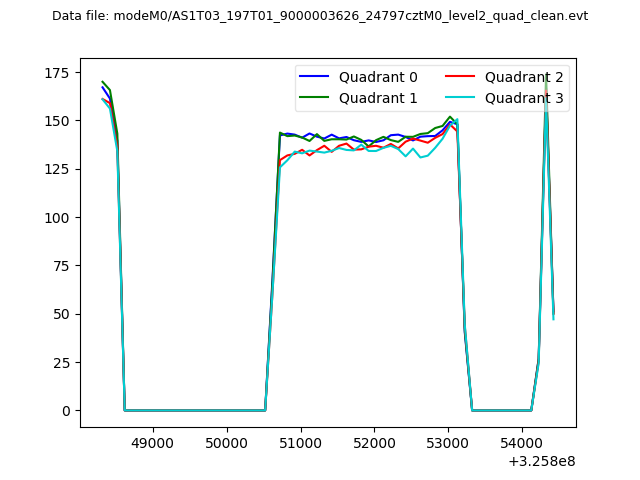
| Quadrant-wise count rates Data is divided into 100 sec bins |
 |
|
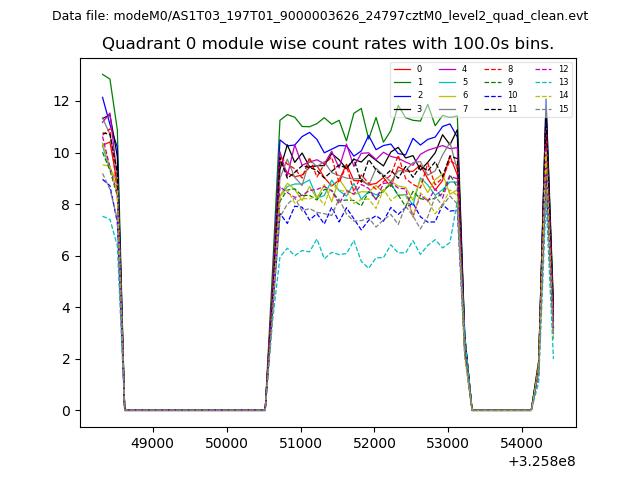
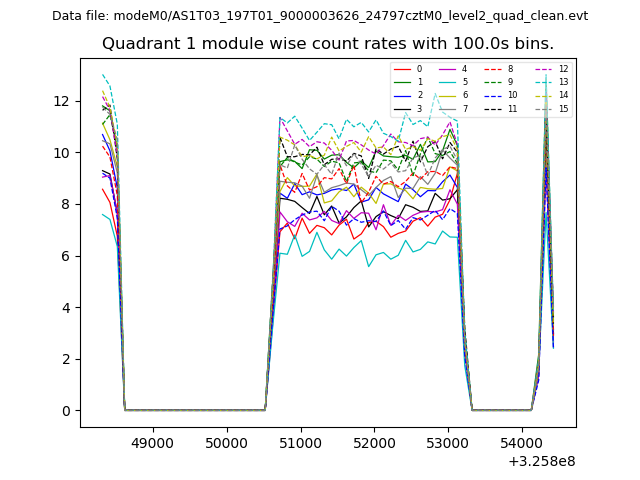
| Module-wise count rates for Quadrant A Data is divided into 100 sec bins |
 |
 |
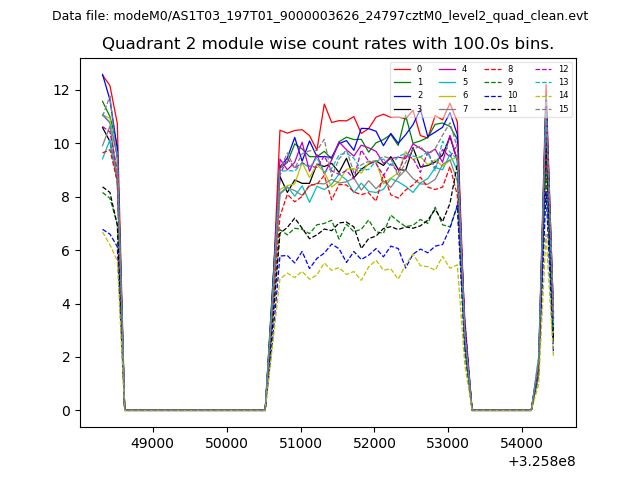
| Module-wise count rates for Quadrant B Data is divided into 100 sec bins |
 |
 |
| Module-wise count rates for Quadrant C Data is divided into 100 sec bins |
 |
 |
| Module-wise count rates for Quadrant D Data is divided into 100 sec bins |
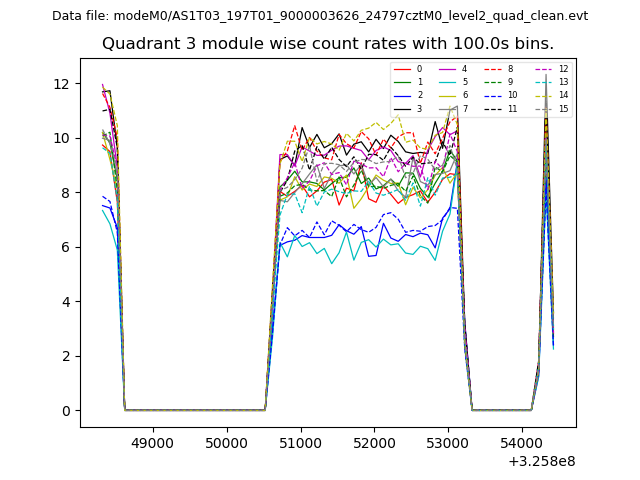 |
 |
| Parameter | Plot |
|---|---|
| CZT HV Monitor | 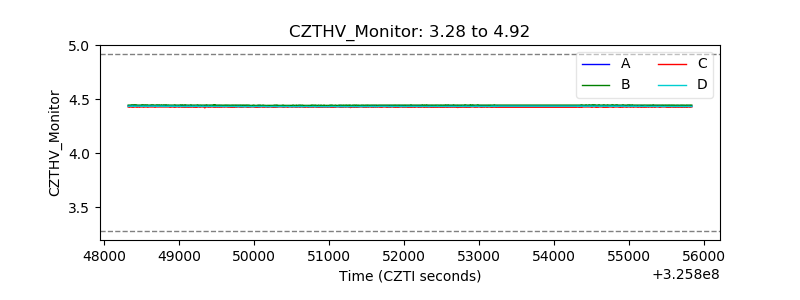 |
| D_VDD | 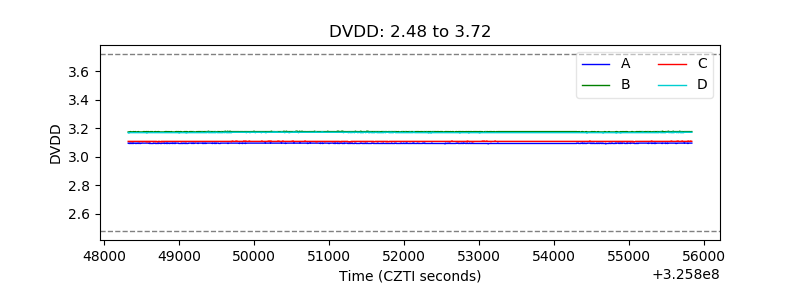 |
| Temperature 1 | 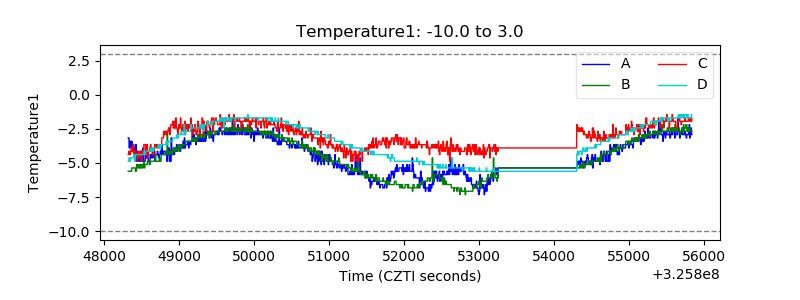 |
| Veto HV Monitor | 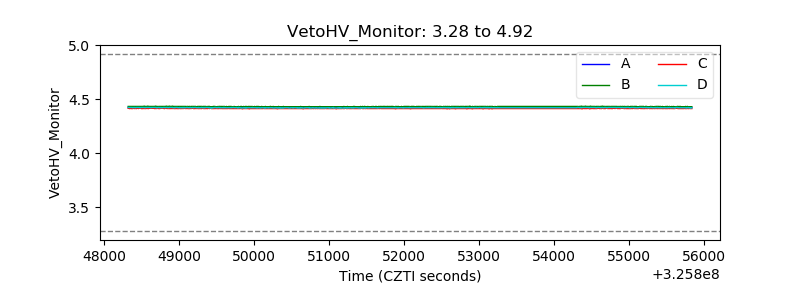 |
| Veto LLD | 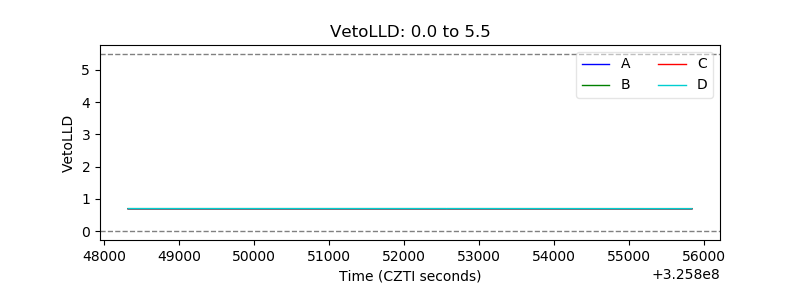 |
| Alpha Counter | 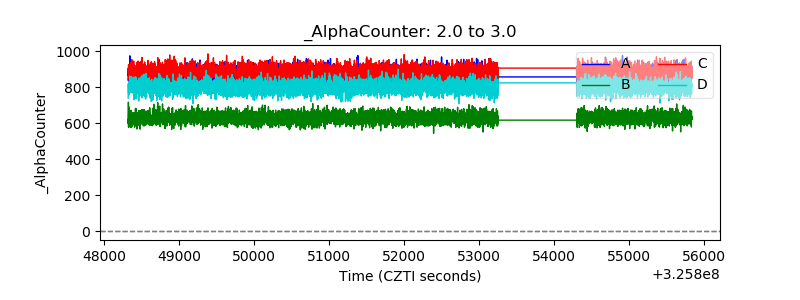 |
| _CPM_Rate | 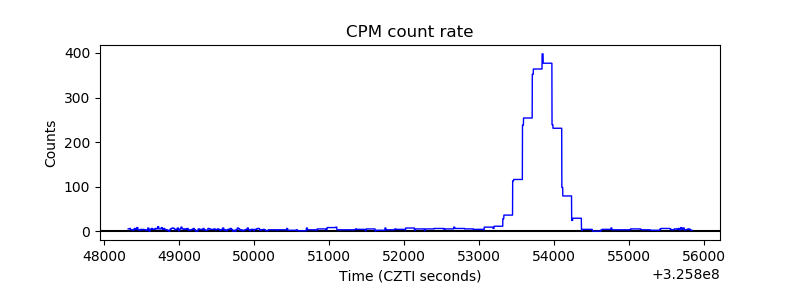 |
| CZT Counter | 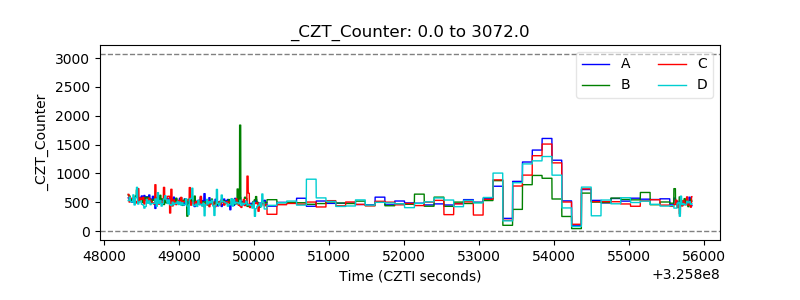 |
| +2.5 Volts monitor |  |
| +5 Volts monitor | 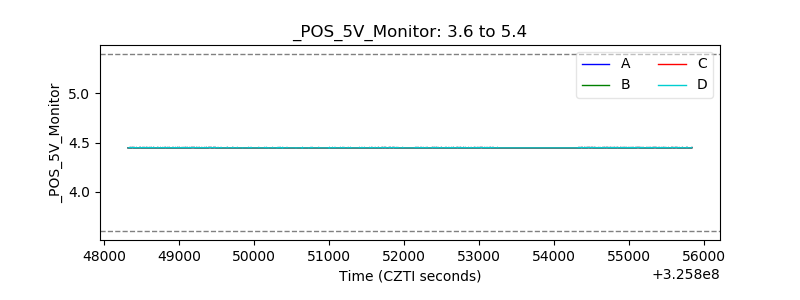 |
| _ROLL_ROT | 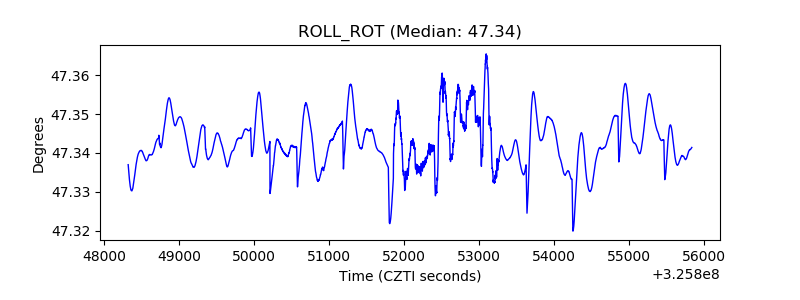 |
| _Roll_DEC | 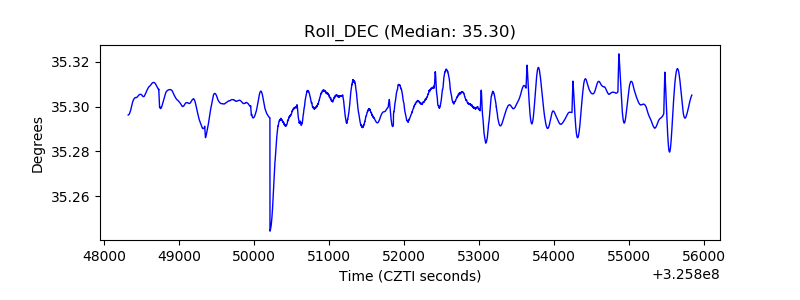 |
| _Roll_RA | 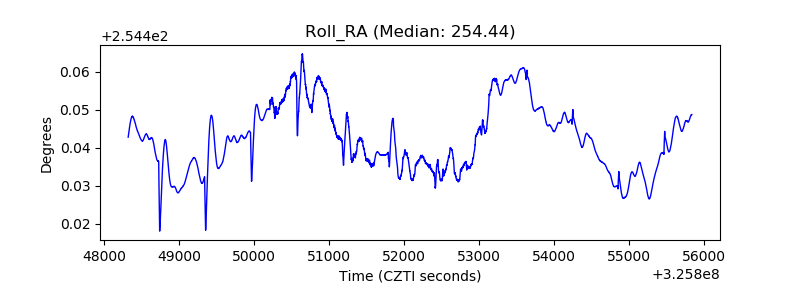 |
| Veto Counter | 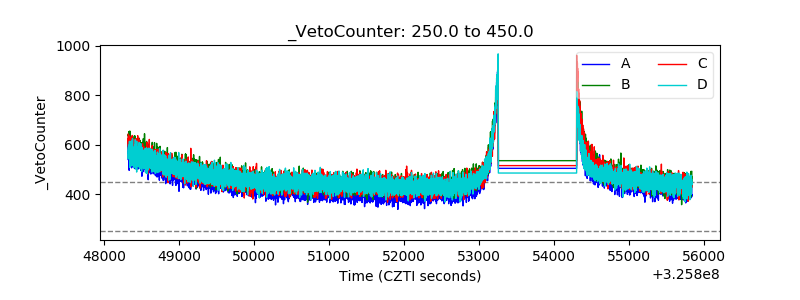 |