| Param | Original file | Final file |
|---|---|---|
| Filename | modeM0/AS1T03_197T01_9000003626_24798cztM0_level2.evt | modeM0/AS1T03_197T01_9000003626_24798cztM0_level2_quad_clean.evt |
| Size (bytes) | 485,291,520 | 77,414,400 |
| Size | 462.8 MB | 73.8 MB |
| Events in quadrant A | 3,527,121 | 469,966 |
| Events in quadrant B | 3,631,181 | 472,587 |
| Events in quadrant C | 3,561,634 | 456,244 |
| Events in quadrant D | 3,496,087 | 452,275 |
| Mode M9 | |||
|---|---|---|---|
| Quadrant | BADHDUFLAG | Total packets | Discarded packets |
| A | 0 | 11 | 0 |
| B | 0 | 12 | 0 |
| C | 0 | 12 | 0 |
| D | 0 | 12 | 0 |
| Mode SS | |||
|---|---|---|---|
| Quadrant | BADHDUFLAG | Total packets | Discarded packets |
| A | 0 | 144 | 0 |
| B | 0 | 144 | 0 |
| C | 0 | 144 | 0 |
| D | 0 | 144 | 0 |
| Mode M0 | |||
|---|---|---|---|
| Quadrant | BADHDUFLAG | Total packets | Discarded packets |
| A | 0 | 14732 | 2 |
| B | 0 | 14965 | 2 |
| C | 0 | 14855 | 2 |
| D | 0 | 14954 | 2 |
| Quadrant | Total seconds | Saturated seconds | Saturation percentage |
|---|---|---|---|
| A | 7077 | 149 | 2.105412% |
| B | 7077 | 175 | 2.472799% |
| C | 7077 | 162 | 2.289106% |
| D | 7077 | 140 | 1.978239% |
Noise dominated data is calculated using 1-second bins in cleaned event files. If a bin has >2000 counts, and if more than 50% of those come from <1% of pixels, then it is considered to be noise-dominated and hence unusable.
| Quadrant | # 1 sec bins | Bins with >0 counts | Bins with >2000 counts | High rate bins dominated by noise | Noise dominated (total time) | Noise dominated (detector-on time) | Marked lightcurve |
|---|---|---|---|---|---|---|---|
| A | 7797 | 7078 | 0 | 0 | 0.00% | 0.00% | 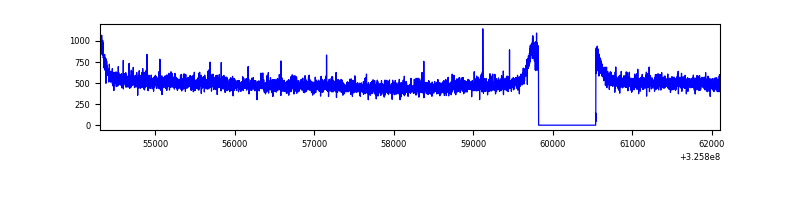 |
| B | 7797 | 7078 | 1 | 1 | 0.01% | 0.01% | 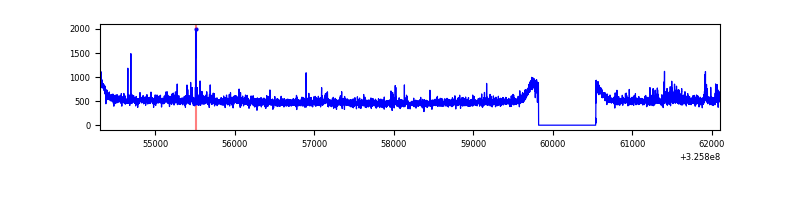 |
| C | 7797 | 7078 | 5 | 5 | 0.06% | 0.07% | 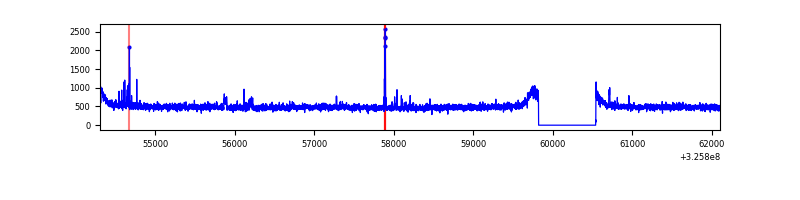 |
| D | 7797 | 7078 | 24 | 24 | 0.31% | 0.34% | 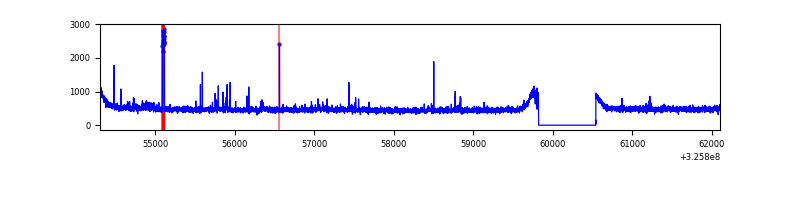 |
Top three noisy pixels from each quadrant. If the there are fewer than three noisy pixels in the level2.evt file, extra rows are filled as -1
| Pixel properties | Quadrant properties | ||||||
|---|---|---|---|---|---|---|---|
| Quadrant | DetID | PixID | Counts | Sigma | Mean | Median | Sigma |
| A | 2 | 79 | 14603 | 74.69 | 909 | 891 | 183.6 |
| A | 13 | 254 | 11152 | 55.89 | 909 | 891 | 183.6 |
| A | 3 | 137 | 8527 | 41.6 | 909 | 891 | 183.6 |
| B | 0 | 189 | 72408 | 412.23 | 892 | 868 | 173.5 |
| B | 7 | 202 | 21724 | 120.18 | 892 | 868 | 173.5 |
| B | 12 | 111 | 20939 | 115.65 | 892 | 868 | 173.5 |
| C | 14 | 238 | 137997 | 681.93 | 859 | 862 | 201.1 |
| C | 5 | 112 | 48549 | 237.13 | 859 | 862 | 201.1 |
| C | 7 | 247 | 20147 | 95.9 | 859 | 862 | 201.1 |
| D | 1 | 52 | 114487 | 531.78 | 878 | 853 | 213.7 |
| D | 8 | 195 | 45340 | 208.19 | 878 | 853 | 213.7 |
| D | 2 | 234 | 27661 | 125.45 | 878 | 853 | 213.7 |
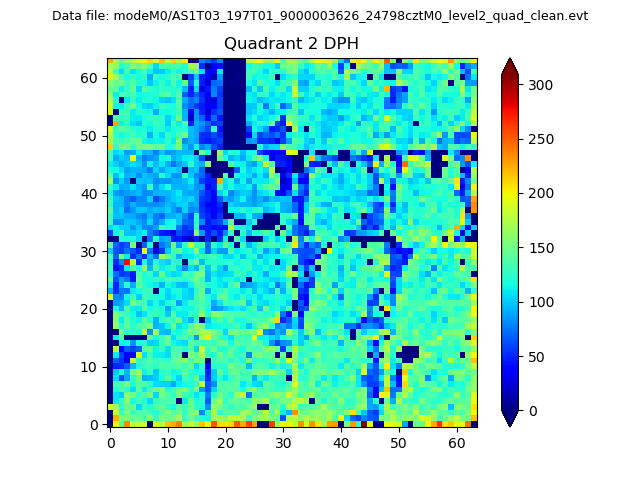
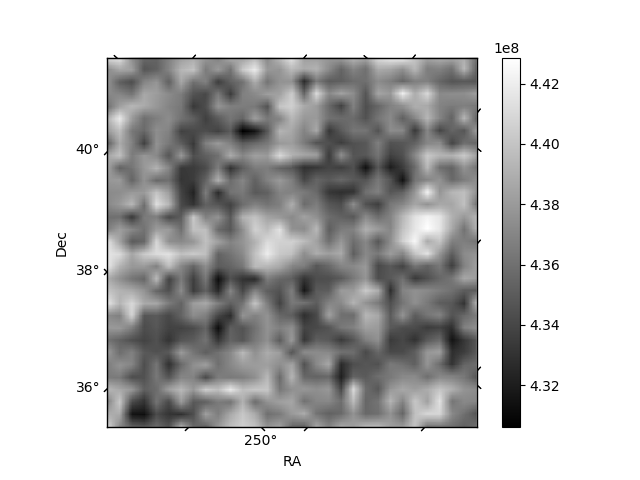
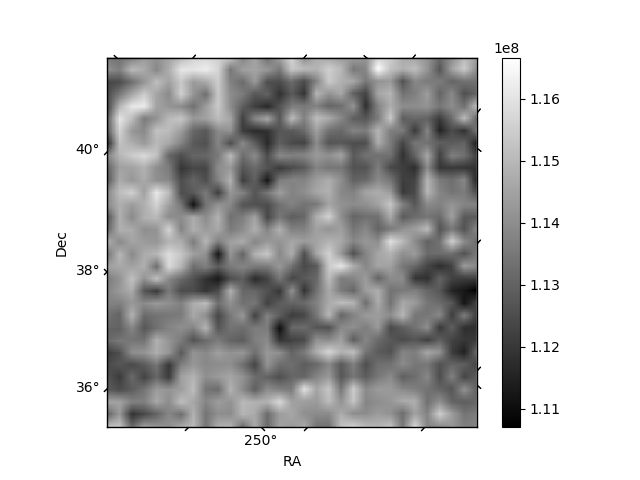
Histogram calculated using DETX and DETY for each event in the final _common_clean file
| Quadrant A | 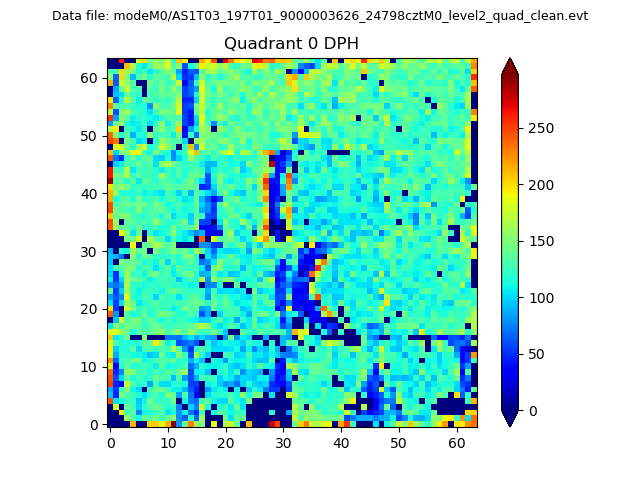 |
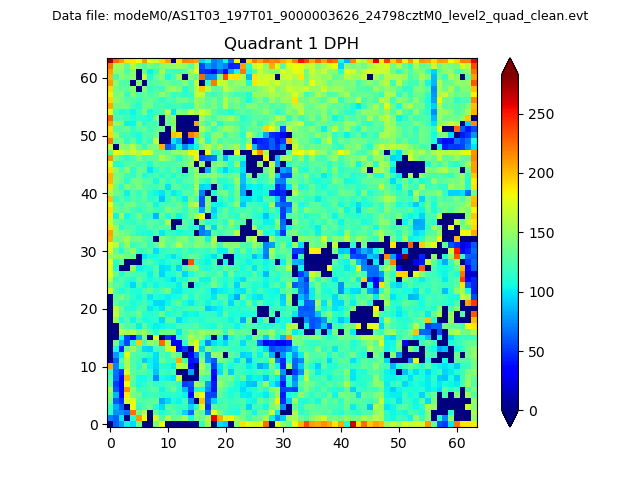 |
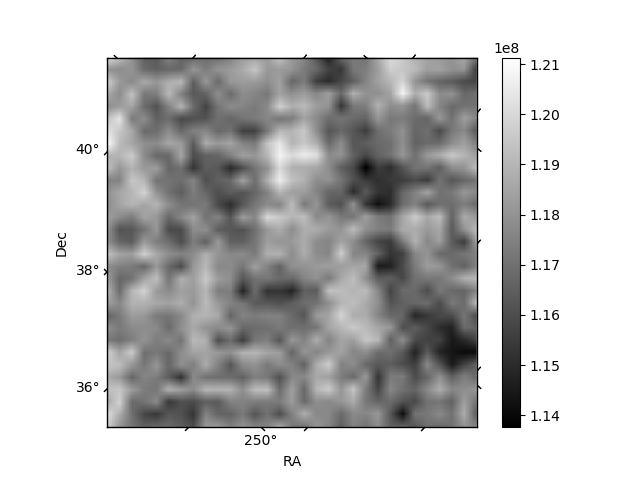
Quadrant B |
|---|---|---|---|
| Quadrant D | 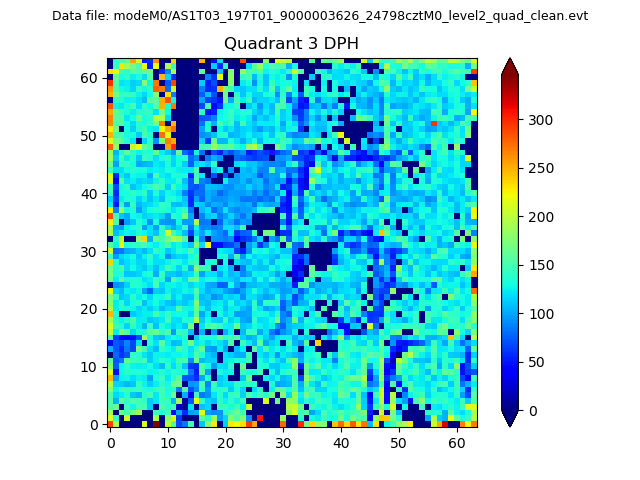 |
 |
Quadrant C |
| Plot type | Count rate plots | Images |
|---|---|---|
| Comparison with Poisson distribution Blue bars denote a histogram of data divided into 1 sec bins. Red curve is a Poisson curve with rate = median count rate of data. |
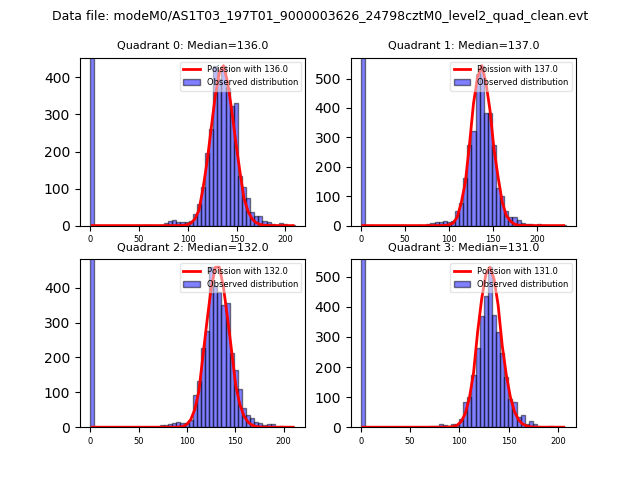 |
 |
| Quadrant-wise count rates Data is divided into 100 sec bins |
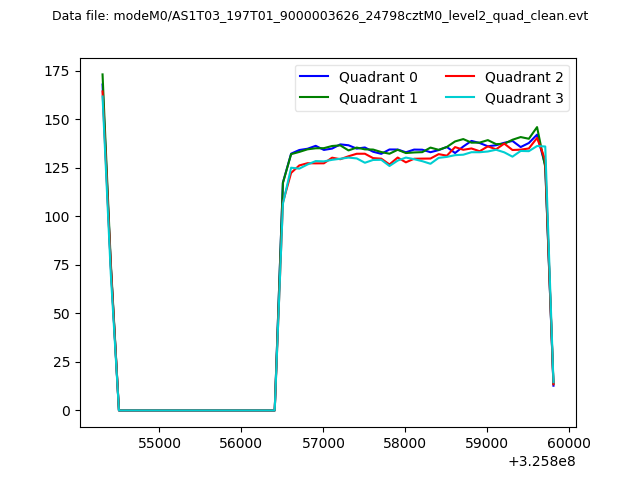 |
|
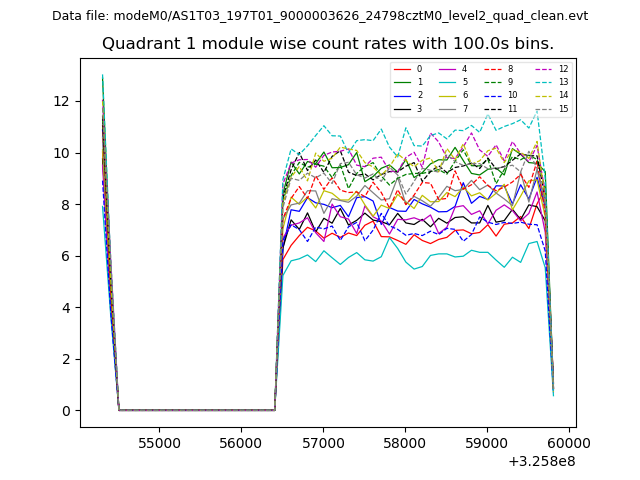
| Module-wise count rates for Quadrant A Data is divided into 100 sec bins |
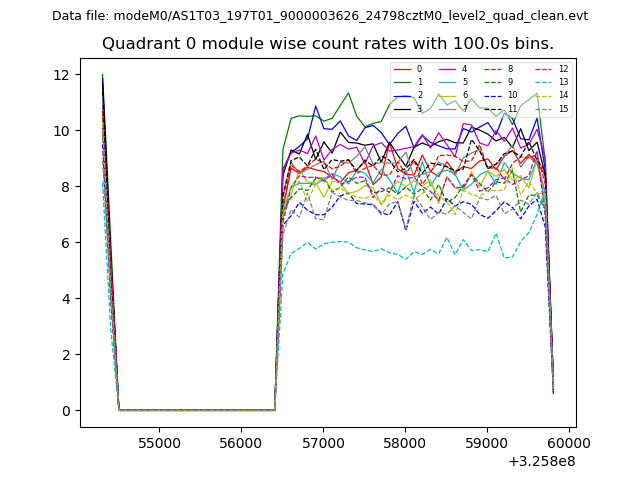 |
 |
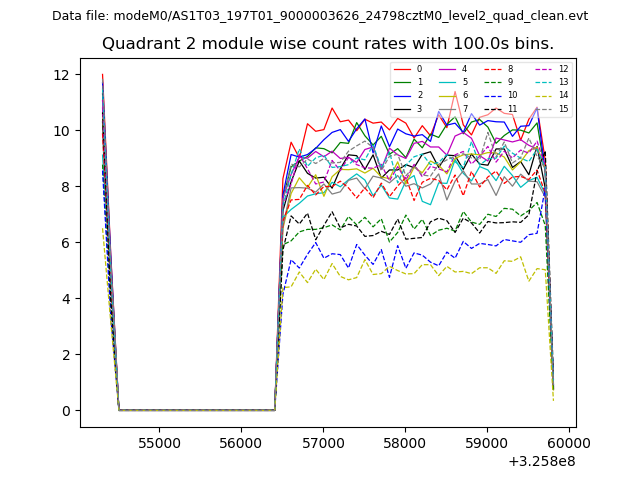
| Module-wise count rates for Quadrant B Data is divided into 100 sec bins |
 |
 |
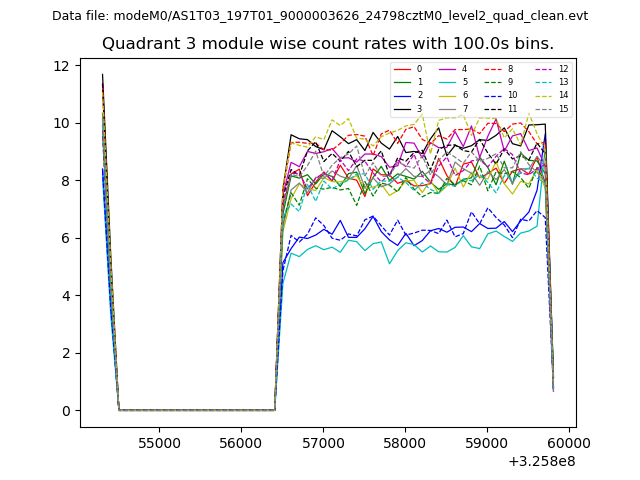
| Module-wise count rates for Quadrant C Data is divided into 100 sec bins |
 |
 |
| Module-wise count rates for Quadrant D Data is divided into 100 sec bins |
 |
 |
| Parameter | Plot |
|---|---|
| CZT HV Monitor | 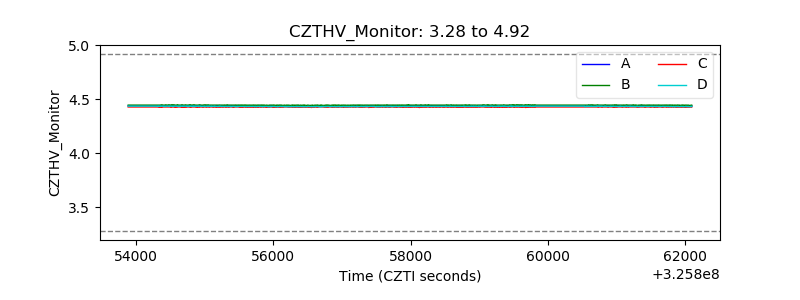 |
| D_VDD | 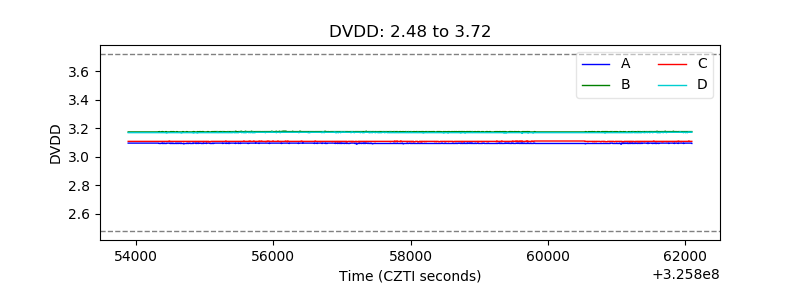 |
| Temperature 1 | 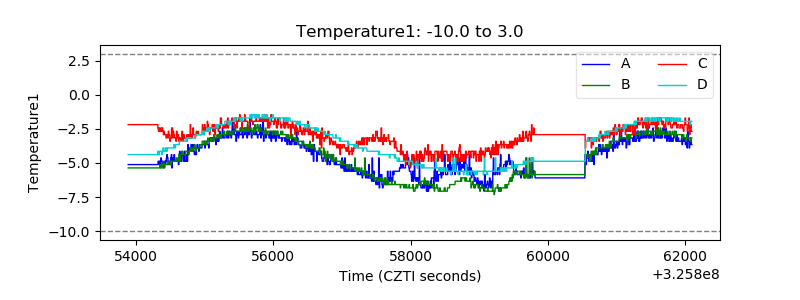 |
| Veto HV Monitor | 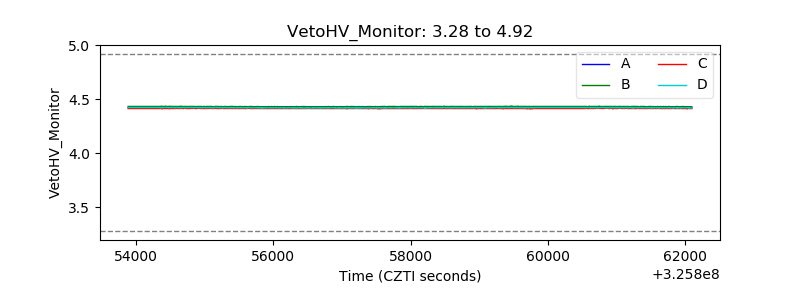 |
| Veto LLD | 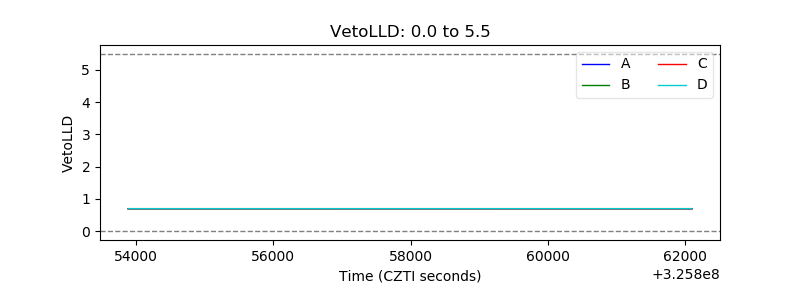 |
| Alpha Counter | 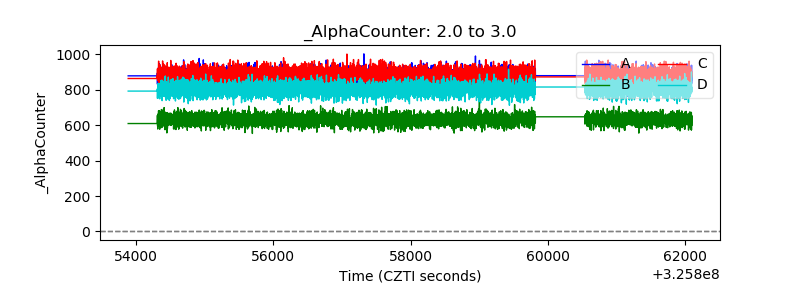 |
| _CPM_Rate | 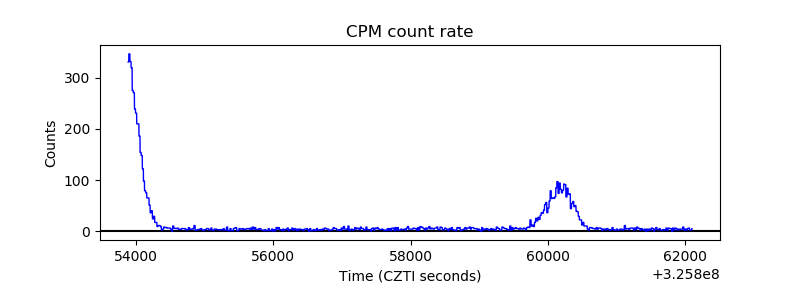 |
| CZT Counter | 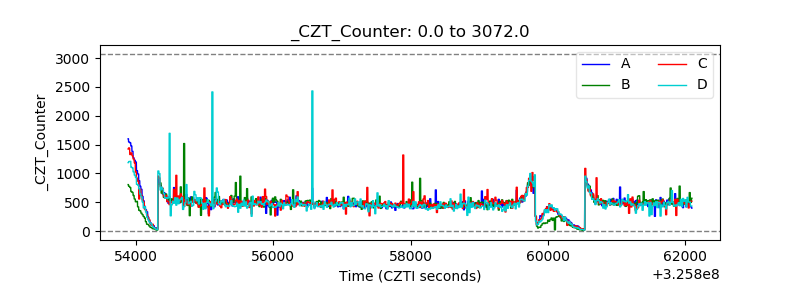 |
| +2.5 Volts monitor |  |
| +5 Volts monitor |  |
| _ROLL_ROT | 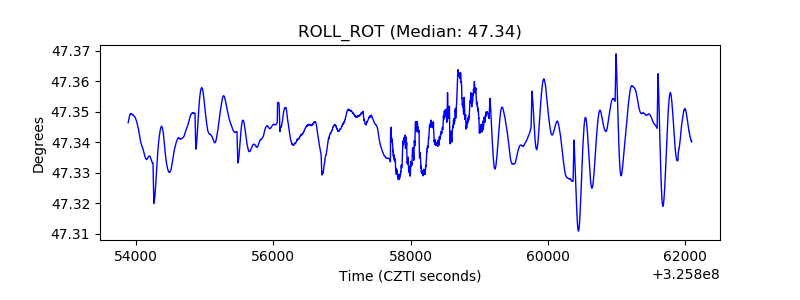 |
| _Roll_DEC | 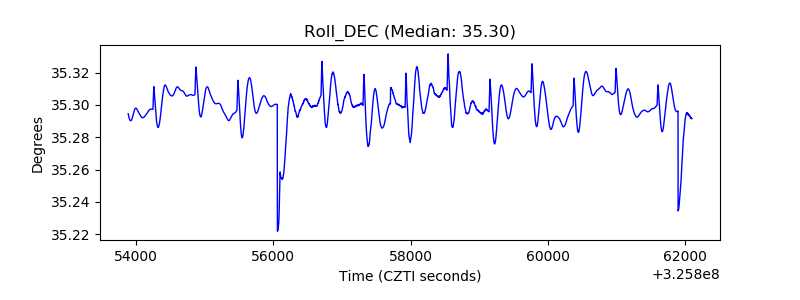 |
| _Roll_RA | 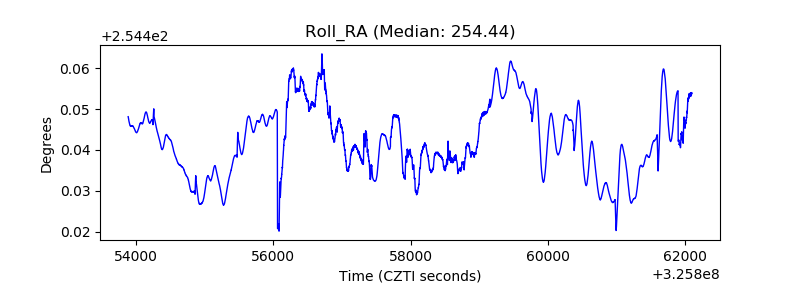 |
| Veto Counter | 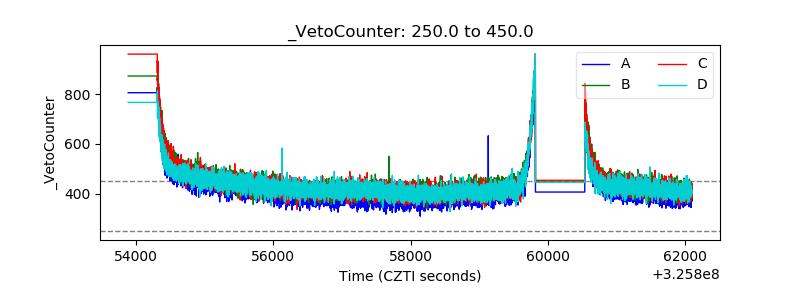 |