| Param | Original file | Final file |
|---|---|---|
| Filename | modeM0/AS1T03_197T01_9000003626_24803cztM0_level2.evt | modeM0/AS1T03_197T01_9000003626_24803cztM0_level2_quad_clean.evt |
| Size (bytes) | 950,353,920 | 183,888,000 |
| Size | 906.3 MB | 175.4 MB |
| Events in quadrant A | 6,538,923 | 1,169,242 |
| Events in quadrant B | 6,918,598 | 1,177,919 |
| Events in quadrant C | 7,586,053 | 1,136,465 |
| Events in quadrant D | 6,796,521 | 1,125,536 |
| Mode M9 | |||
|---|---|---|---|
| Quadrant | BADHDUFLAG | Total packets | Discarded packets |
| A | 0 | 18 | 0 |
| B | 0 | 18 | 0 |
| C | 0 | 18 | 0 |
| D | 0 | 18 | 0 |
| Mode SS | |||
|---|---|---|---|
| Quadrant | BADHDUFLAG | Total packets | Discarded packets |
| A | 0 | 282 | 0 |
| B | 0 | 282 | 0 |
| C | 0 | 282 | 0 |
| D | 0 | 282 | 0 |
| Mode M0 | |||
|---|---|---|---|
| Quadrant | BADHDUFLAG | Total packets | Discarded packets |
| A | 0 | 28571 | 3 |
| B | 0 | 29711 | 3 |
| C | 0 | 31462 | 3 |
| D | 0 | 29631 | 3 |
| Quadrant | Total seconds | Saturated seconds | Saturation percentage |
|---|---|---|---|
| A | 13916 | 92 | 0.661110% |
| B | 13916 | 183 | 1.315033% |
| C | 13916 | 304 | 2.184536% |
| D | 13916 | 100 | 0.718597% |
Noise dominated data is calculated using 1-second bins in cleaned event files. If a bin has >2000 counts, and if more than 50% of those come from <1% of pixels, then it is considered to be noise-dominated and hence unusable.
| Quadrant | # 1 sec bins | Bins with >0 counts | Bins with >2000 counts | High rate bins dominated by noise | Noise dominated (total time) | Noise dominated (detector-on time) | Marked lightcurve |
|---|---|---|---|---|---|---|---|
| A | 15651 | 13919 | 0 | 0 | 0.00% | 0.00% | 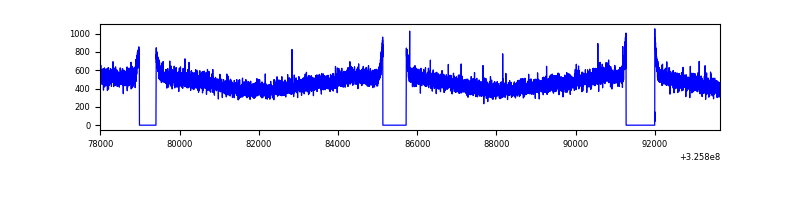 |
| B | 15651 | 13919 | 5 | 5 | 0.03% | 0.04% | 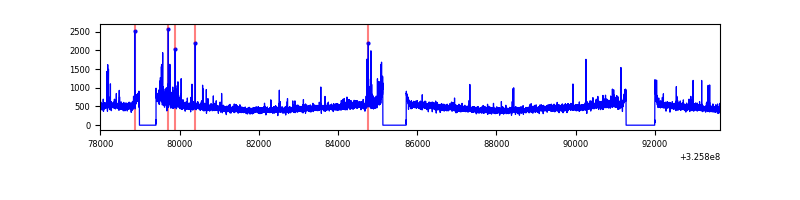 |
| C | 15651 | 13919 | 0 | 0 | 0.00% | 0.00% | 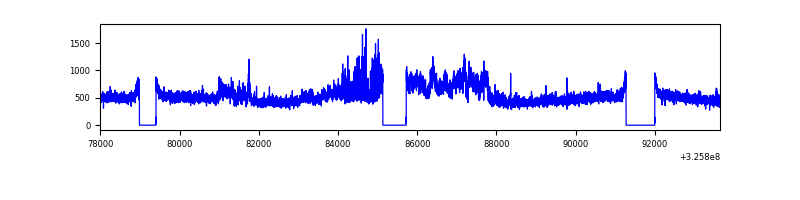 |
| D | 15651 | 13919 | 13 | 13 | 0.08% | 0.09% | 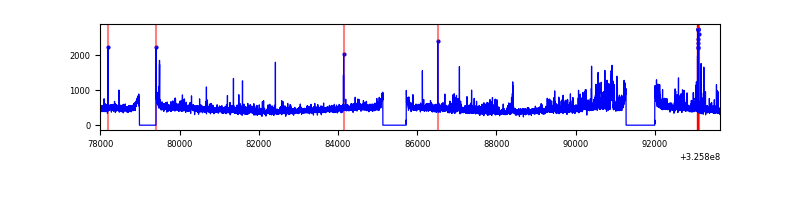 |
Top three noisy pixels from each quadrant. If the there are fewer than three noisy pixels in the level2.evt file, extra rows are filled as -1
| Pixel properties | Quadrant properties | ||||||
|---|---|---|---|---|---|---|---|
| Quadrant | DetID | PixID | Counts | Sigma | Mean | Median | Sigma |
| A | 13 | 254 | 21951 | 59.7 | 1689 | 1653 | 340.0 |
| A | 11 | 208 | 21340 | 57.9 | 1689 | 1653 | 340.0 |
| A | 3 | 137 | 16082 | 42.44 | 1689 | 1653 | 340.0 |
| B | 3 | 64 | 119925 | 368.42 | 1678 | 1635 | 321.1 |
| B | 0 | 189 | 82749 | 252.63 | 1678 | 1635 | 321.1 |
| B | 7 | 202 | 45318 | 136.05 | 1678 | 1635 | 321.1 |
| C | 7 | 247 | 984115 | 2591.83 | 1622 | 1632 | 379.1 |
| C | 14 | 238 | 258835 | 678.51 | 1622 | 1632 | 379.1 |
| C | 2 | 16 | 23330 | 57.24 | 1622 | 1632 | 379.1 |
| D | 8 | 195 | 310820 | 778.2 | 1644 | 1594 | 397.4 |
| D | 1 | 52 | 224192 | 560.19 | 1644 | 1594 | 397.4 |
| D | 2 | 234 | 57677 | 141.14 | 1644 | 1594 | 397.4 |
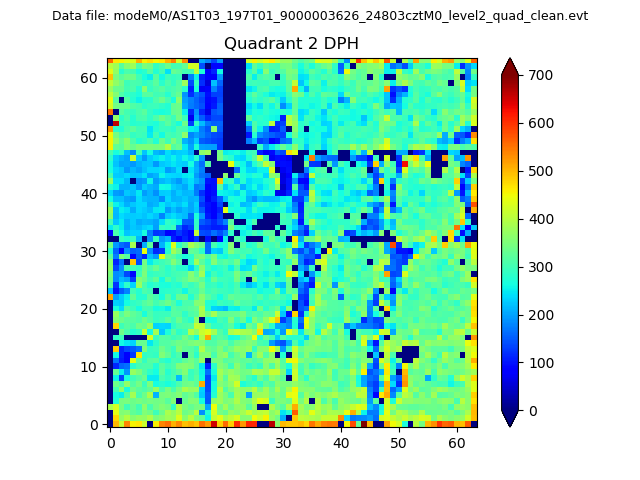
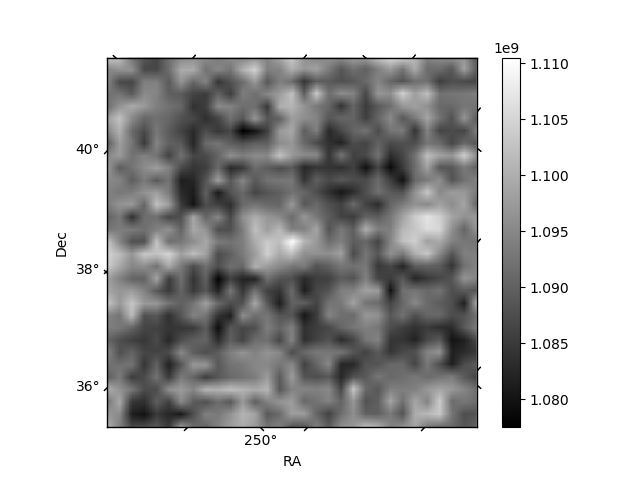
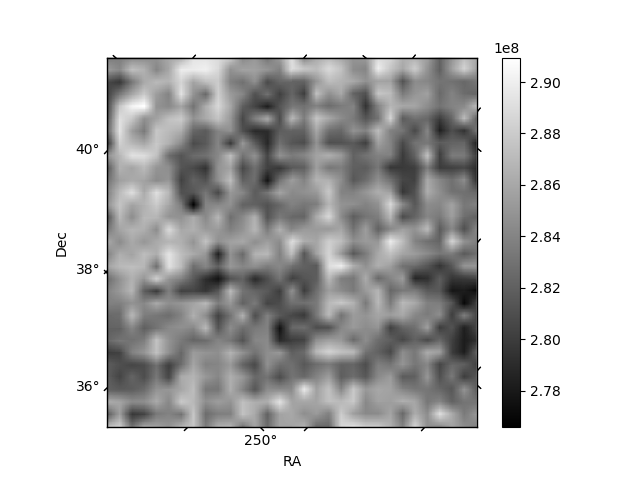
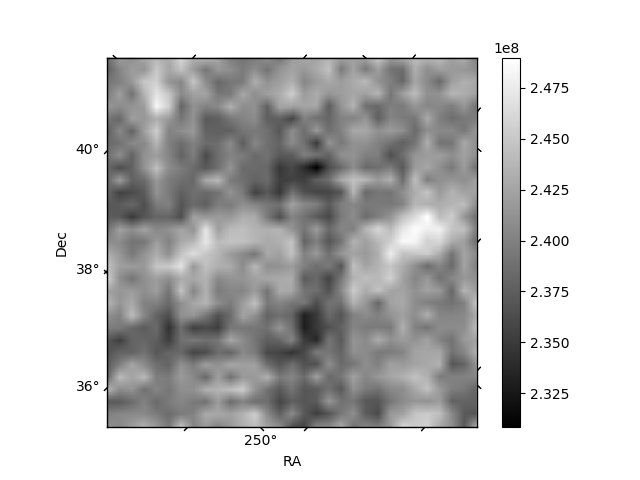
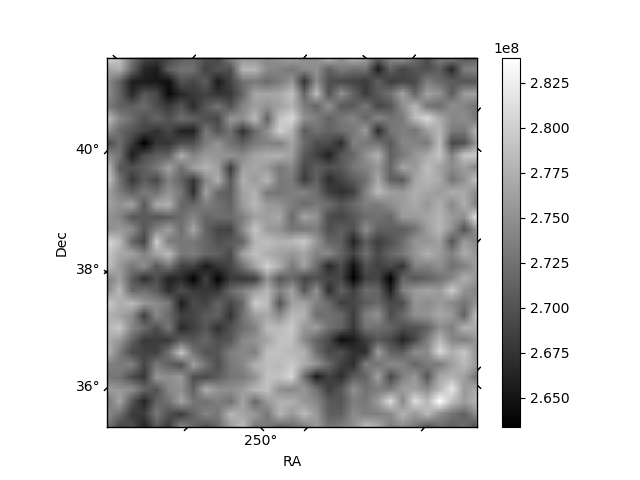
Histogram calculated using DETX and DETY for each event in the final _common_clean file
| Quadrant A | 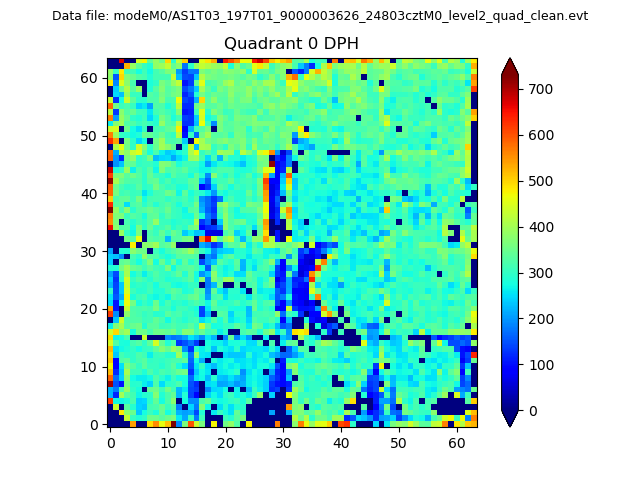 |
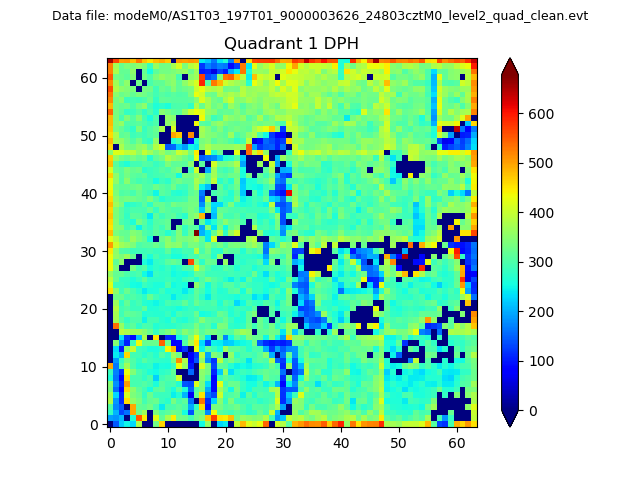 |
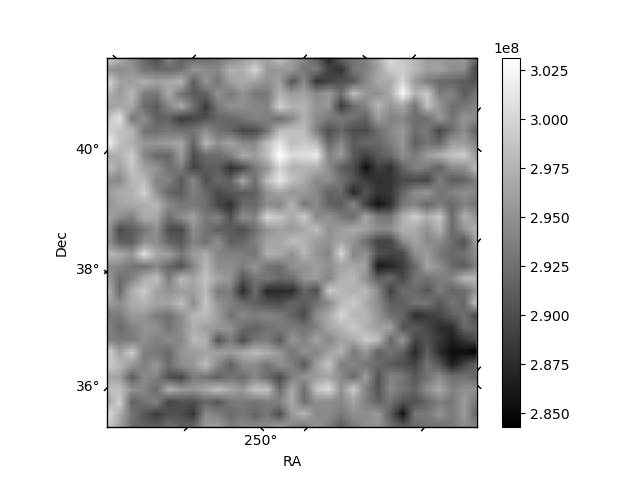
Quadrant B |
|---|---|---|---|
| Quadrant D | 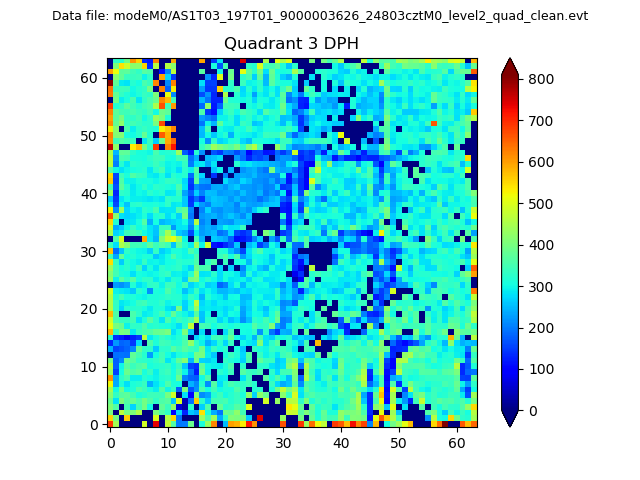 |
 |
Quadrant C |
| Plot type | Count rate plots | Images |
|---|---|---|
| Comparison with Poisson distribution Blue bars denote a histogram of data divided into 1 sec bins. Red curve is a Poisson curve with rate = median count rate of data. |
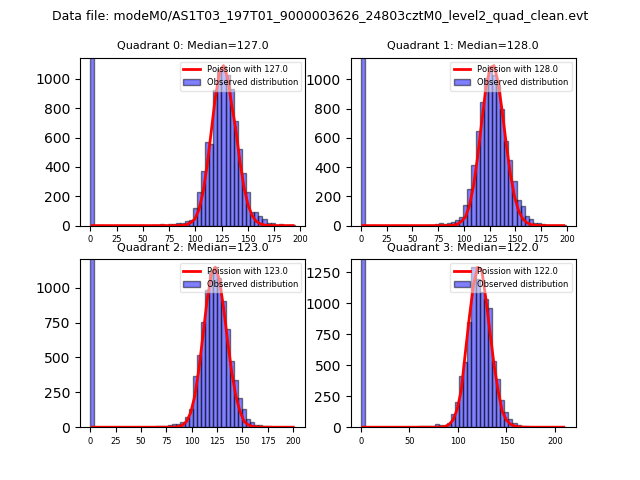 |
 |
| Quadrant-wise count rates Data is divided into 100 sec bins |
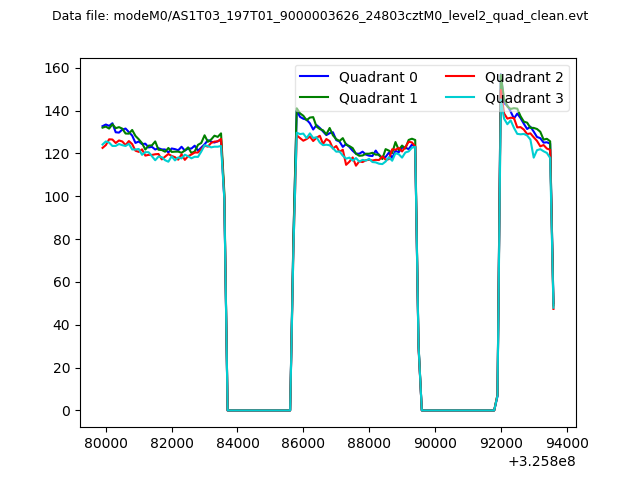 |
|
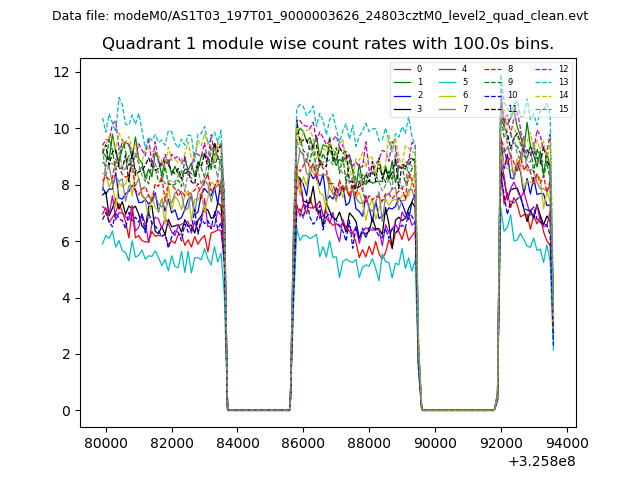
| Module-wise count rates for Quadrant A Data is divided into 100 sec bins |
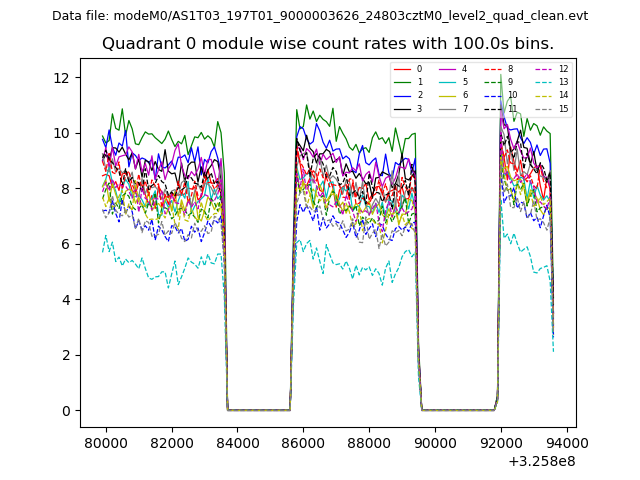 |
 |
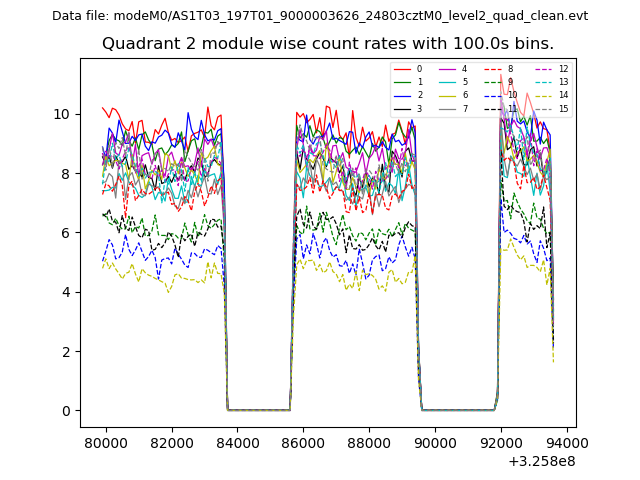
| Module-wise count rates for Quadrant B Data is divided into 100 sec bins |
 |
 |
| Module-wise count rates for Quadrant C Data is divided into 100 sec bins |
 |
 |
| Module-wise count rates for Quadrant D Data is divided into 100 sec bins |
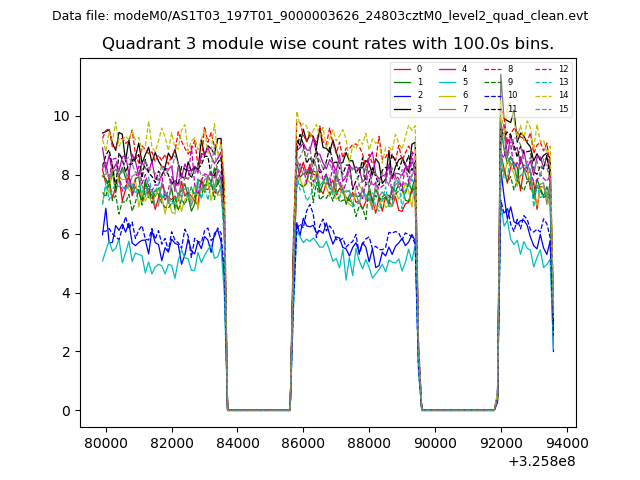 |
 |
| Parameter | Plot |
|---|---|
| CZT HV Monitor | 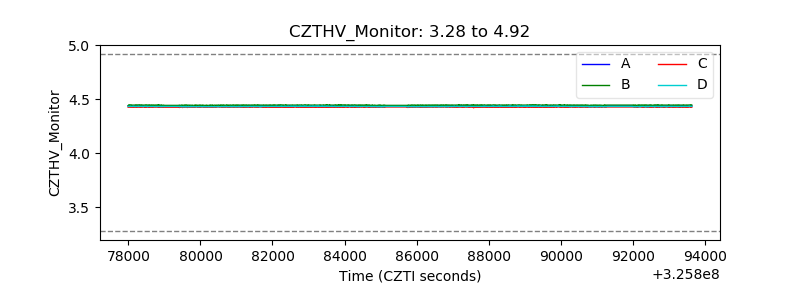 |
| D_VDD | 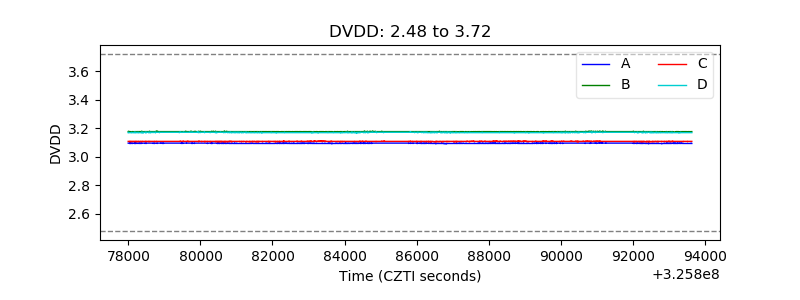 |
| Temperature 1 | 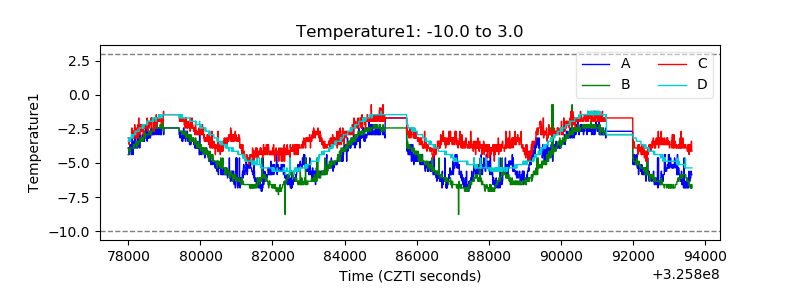 |
| Veto HV Monitor | 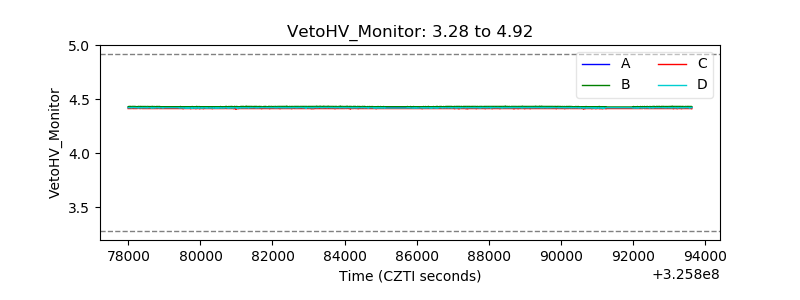 |
| Veto LLD | 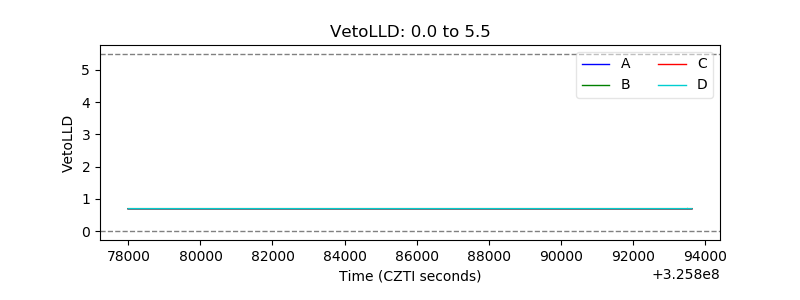 |
| Alpha Counter | 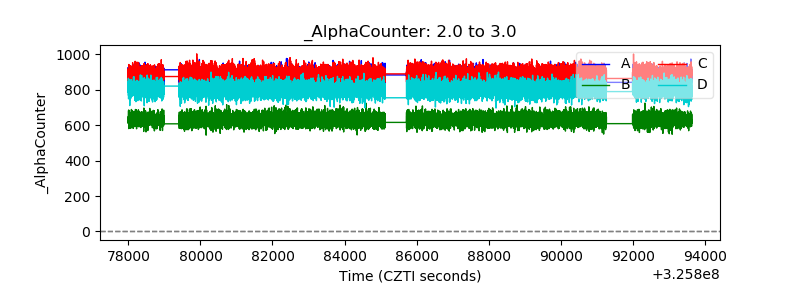 |
| _CPM_Rate | 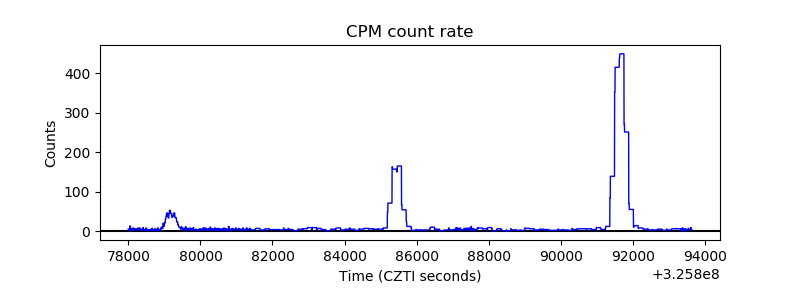 |
| CZT Counter | 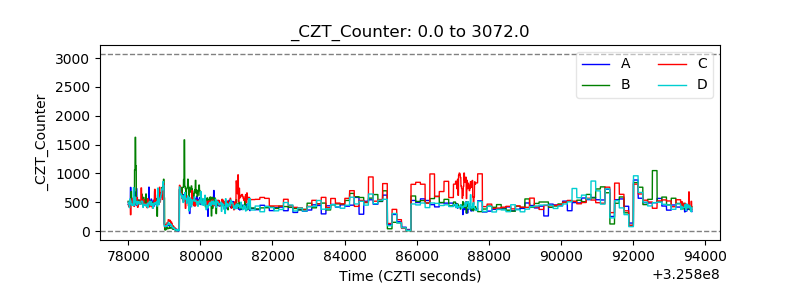 |
| +2.5 Volts monitor | 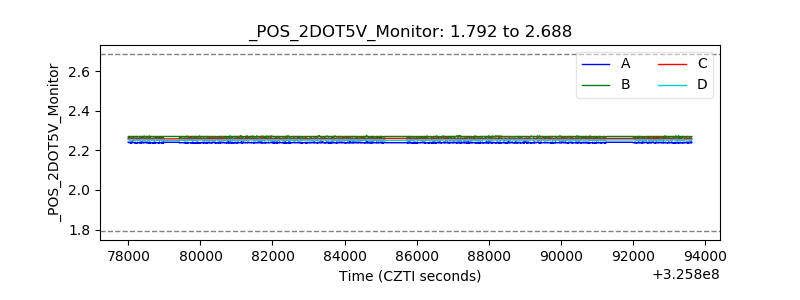 |
| +5 Volts monitor |  |
| _ROLL_ROT | 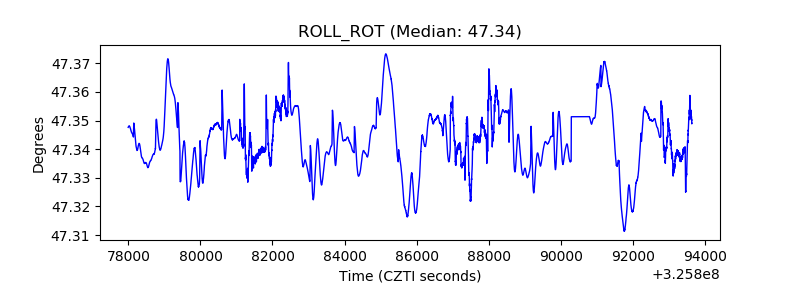 |
| _Roll_DEC | 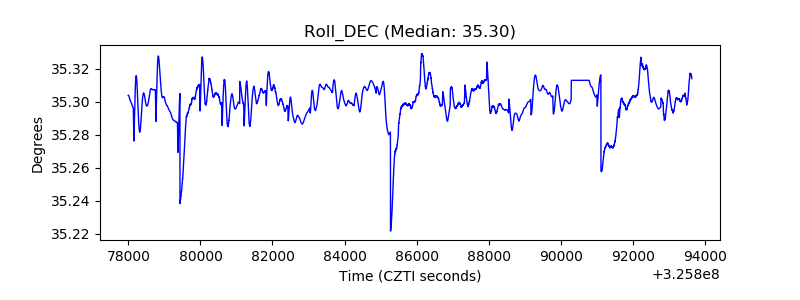 |
| _Roll_RA | 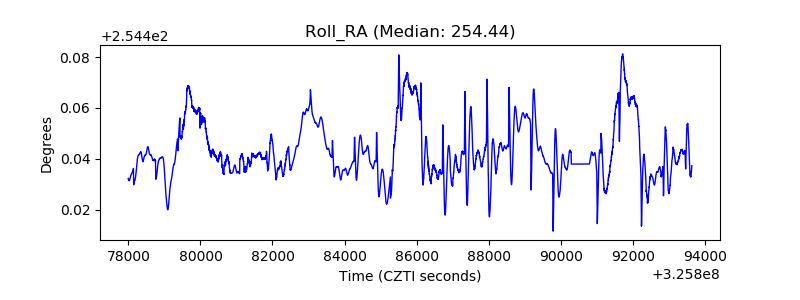 |
| Veto Counter | 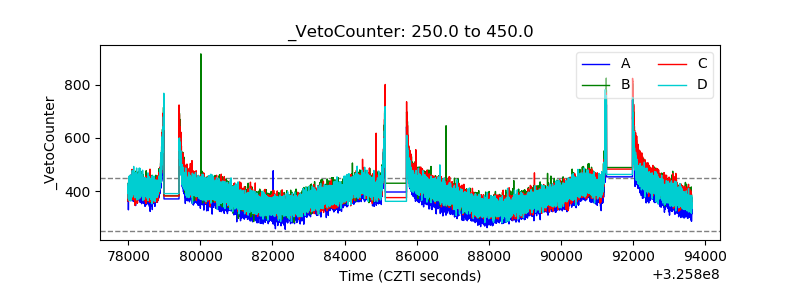 |