| Param | Original file | Final file |
|---|---|---|
| Filename | modeM0/AS1T03_197T01_9000003626_24804cztM0_level2.evt | modeM0/AS1T03_197T01_9000003626_24804cztM0_level2_quad_clean.evt |
| Size (bytes) | 501,042,240 | 96,272,640 |
| Size | 477.8 MB | 91.8 MB |
| Events in quadrant A | 3,322,699 | 613,797 |
| Events in quadrant B | 3,483,224 | 620,431 |
| Events in quadrant C | 4,055,595 | 602,869 |
| Events in quadrant D | 3,833,567 | 587,195 |
| Mode M9 | |||
|---|---|---|---|
| Quadrant | BADHDUFLAG | Total packets | Discarded packets |
| A | 0 | 17 | 0 |
| B | 0 | 17 | 0 |
| C | 0 | 17 | 0 |
| D | 0 | 17 | 0 |
| Mode SS | |||
|---|---|---|---|
| Quadrant | BADHDUFLAG | Total packets | Discarded packets |
| A | 0 | 144 | 0 |
| B | 0 | 144 | 0 |
| C | 0 | 144 | 0 |
| D | 0 | 144 | 0 |
| Mode M0 | |||
|---|---|---|---|
| Quadrant | BADHDUFLAG | Total packets | Discarded packets |
| A | 0 | 14565 | 2 |
| B | 0 | 14921 | 2 |
| C | 0 | 16730 | 2 |
| D | 0 | 16373 | 2 |
| Quadrant | Total seconds | Saturated seconds | Saturation percentage |
|---|---|---|---|
| A | 7057 | 38 | 0.538472% |
| B | 7057 | 94 | 1.332011% |
| C | 7056 | 393 | 5.569728% |
| D | 7057 | 54 | 0.765198% |
Noise dominated data is calculated using 1-second bins in cleaned event files. If a bin has >2000 counts, and if more than 50% of those come from <1% of pixels, then it is considered to be noise-dominated and hence unusable.
| Quadrant | # 1 sec bins | Bins with >0 counts | Bins with >2000 counts | High rate bins dominated by noise | Noise dominated (total time) | Noise dominated (detector-on time) | Marked lightcurve |
|---|---|---|---|---|---|---|---|
| A | 8682 | 7059 | 0 | 0 | 0.00% | 0.00% | 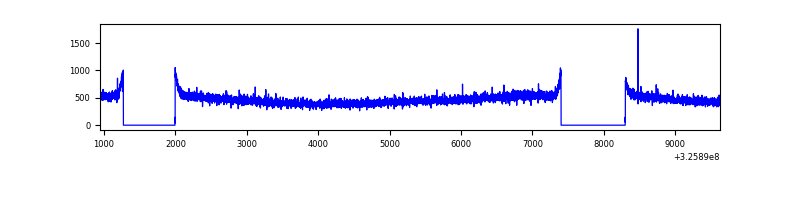 |
| B | 8682 | 7059 | 20 | 20 | 0.23% | 0.28% | 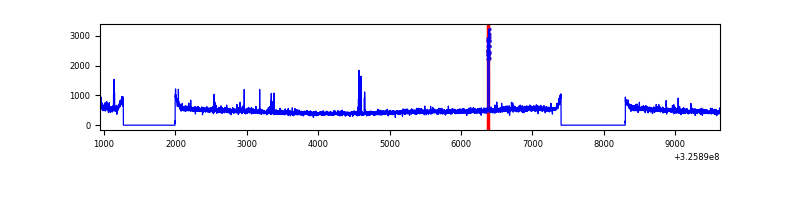 |
| C | 8681 | 7058 | 148 | 148 | 1.70% | 2.10% | 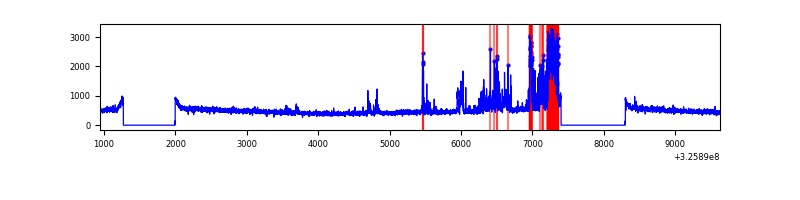 |
| D | 8682 | 7059 | 28 | 28 | 0.32% | 0.40% | 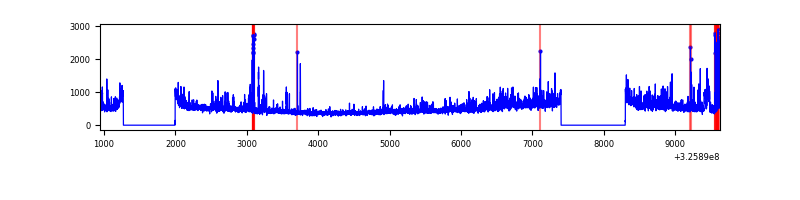 |
Top three noisy pixels from each quadrant. If the there are fewer than three noisy pixels in the level2.evt file, extra rows are filled as -1
| Pixel properties | Quadrant properties | ||||||
|---|---|---|---|---|---|---|---|
| Quadrant | DetID | PixID | Counts | Sigma | Mean | Median | Sigma |
| A | 13 | 254 | 11562 | 61.74 | 860 | 841 | 173.7 |
| A | 3 | 137 | 8020 | 41.34 | 860 | 841 | 173.7 |
| A | 0 | 226 | 7234 | 36.81 | 860 | 841 | 173.7 |
| B | 3 | 64 | 60898 | 361.63 | 856 | 833 | 166.1 |
| B | 7 | 202 | 37633 | 221.56 | 856 | 833 | 166.1 |
| B | 12 | 111 | 20547 | 118.69 | 856 | 833 | 166.1 |
| C | 2 | 16 | 768888 | 4036.94 | 810 | 813 | 190.3 |
| C | 14 | 238 | 128795 | 672.66 | 810 | 813 | 190.3 |
| C | 13 | 61 | 5571 | 25.01 | 810 | 813 | 190.3 |
| D | 8 | 195 | 421444 | 2073.44 | 837 | 811 | 202.9 |
| D | 1 | 52 | 210815 | 1035.18 | 837 | 811 | 202.9 |
| D | 2 | 234 | 25929 | 123.81 | 837 | 811 | 202.9 |
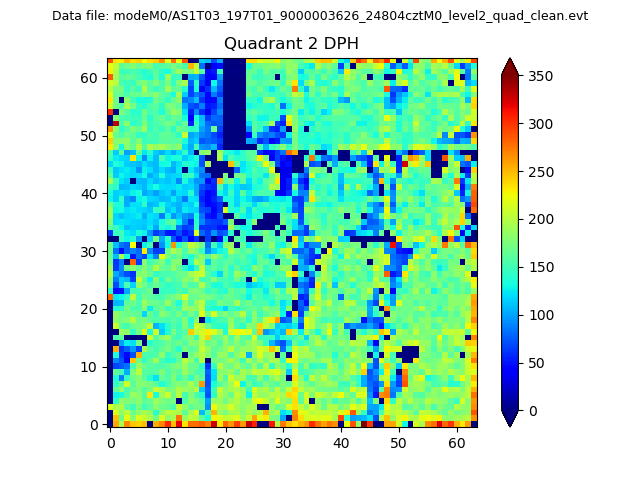
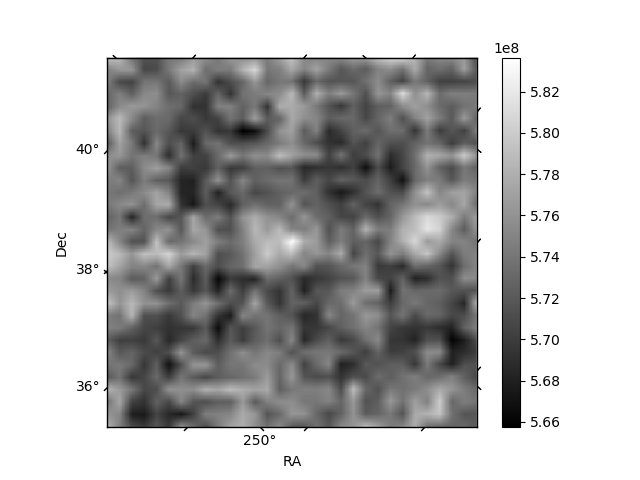
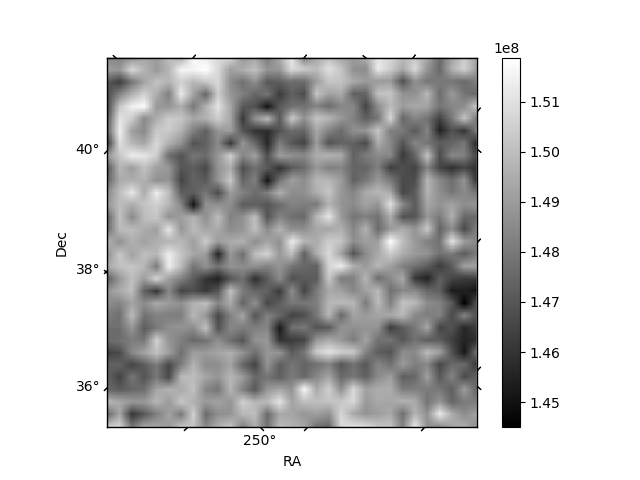
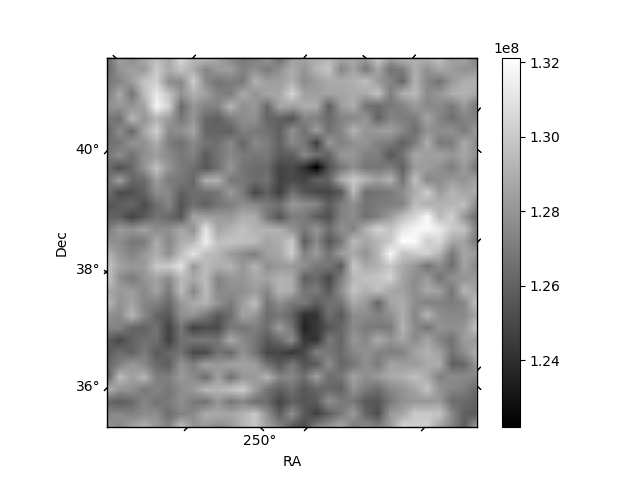
Histogram calculated using DETX and DETY for each event in the final _common_clean file
| Quadrant A | 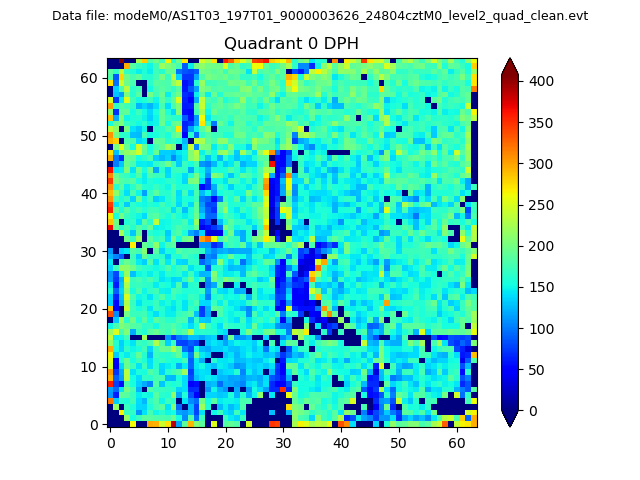 |
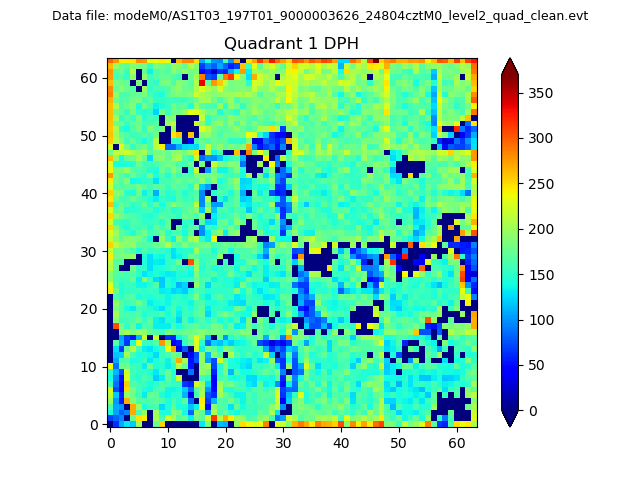 |
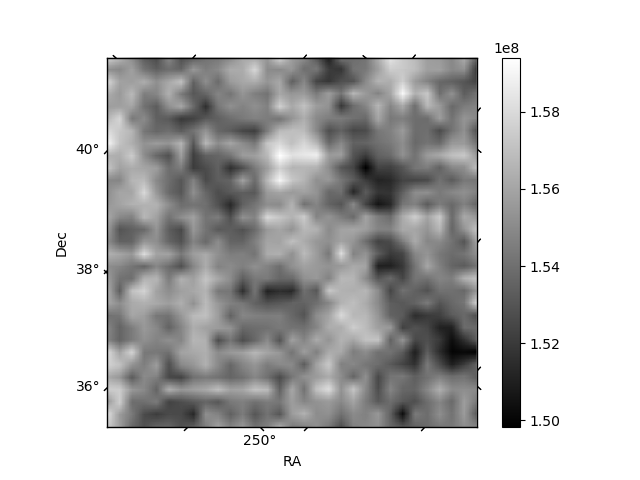
Quadrant B |
|---|---|---|---|
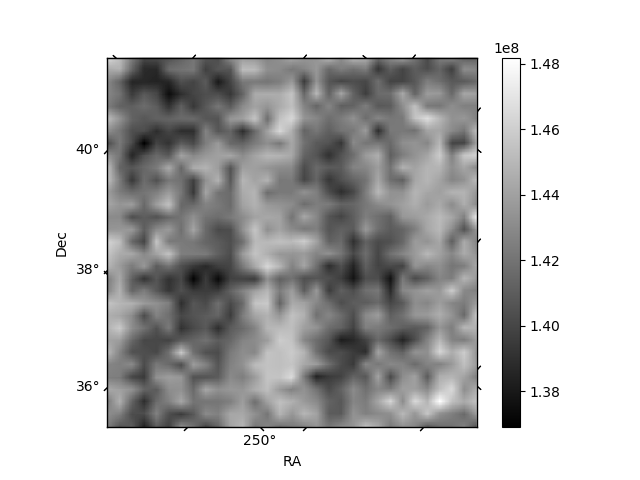
| Quadrant D | 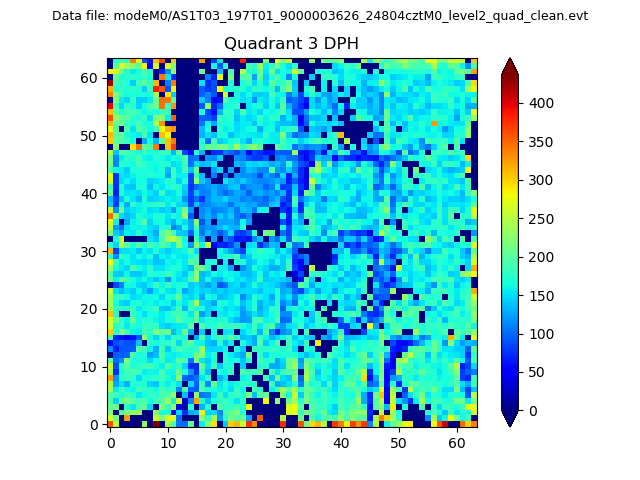 |
 |
Quadrant C |
| Plot type | Count rate plots | Images |
|---|---|---|
| Comparison with Poisson distribution Blue bars denote a histogram of data divided into 1 sec bins. Red curve is a Poisson curve with rate = median count rate of data. |
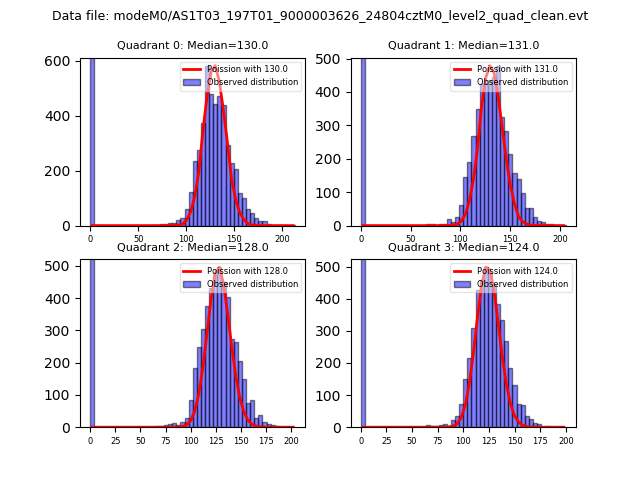 |
 |
| Quadrant-wise count rates Data is divided into 100 sec bins |
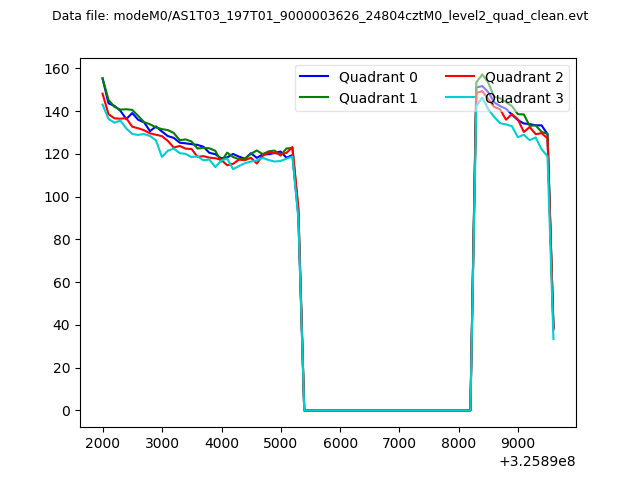 |
|
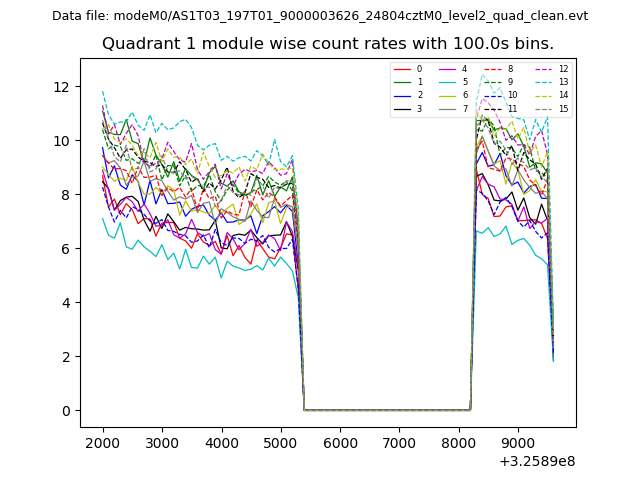
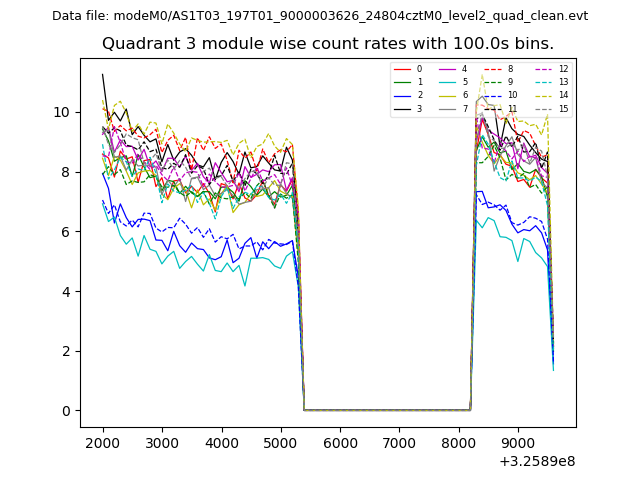
| Module-wise count rates for Quadrant A Data is divided into 100 sec bins |
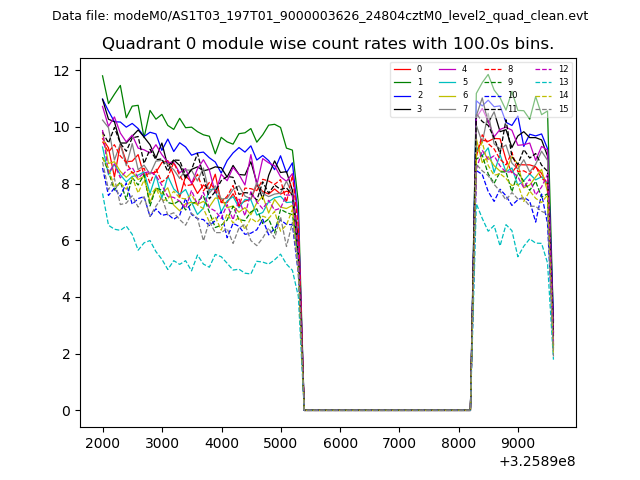 |
 |
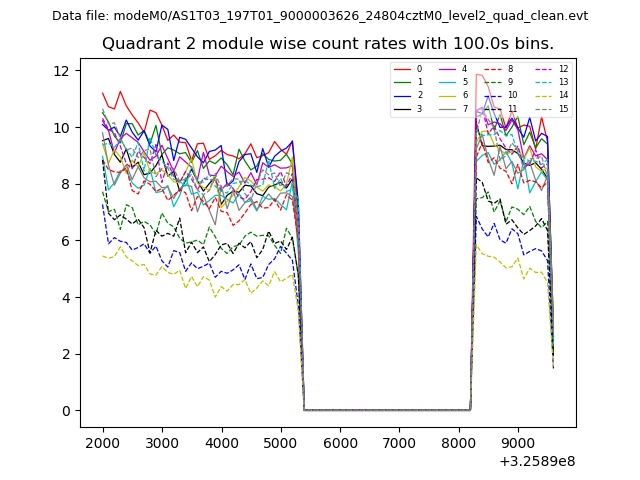
| Module-wise count rates for Quadrant B Data is divided into 100 sec bins |
 |
 |
| Module-wise count rates for Quadrant C Data is divided into 100 sec bins |
 |
 |
| Module-wise count rates for Quadrant D Data is divided into 100 sec bins |
 |
 |
| Parameter | Plot |
|---|---|
| CZT HV Monitor | 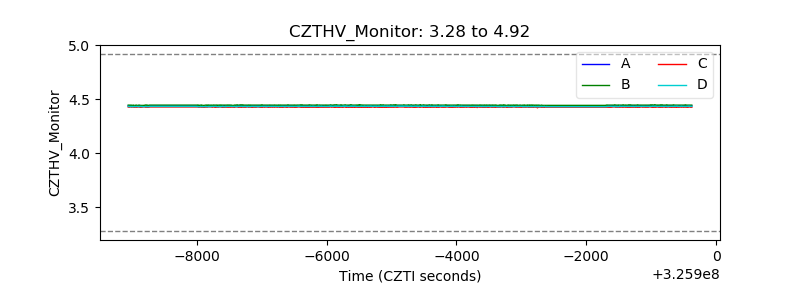 |
| D_VDD | 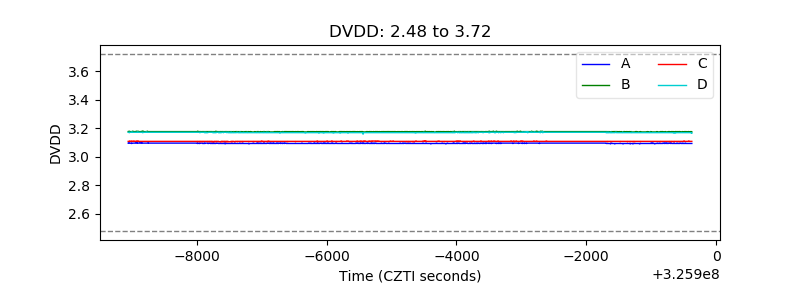 |
| Temperature 1 | 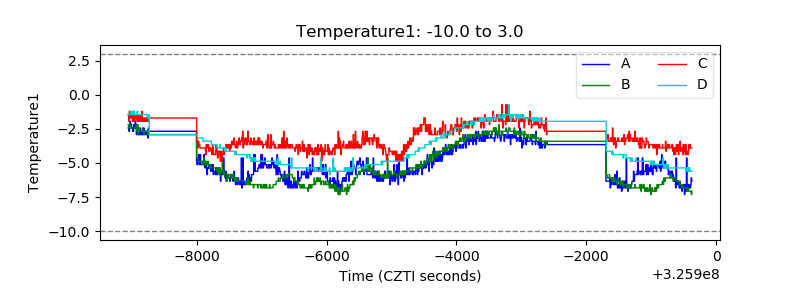 |
| Veto HV Monitor | 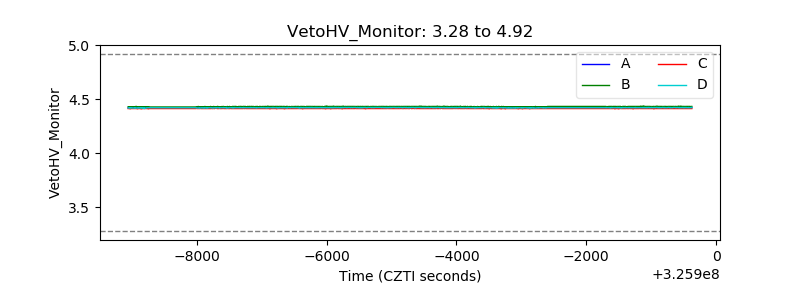 |
| Veto LLD | 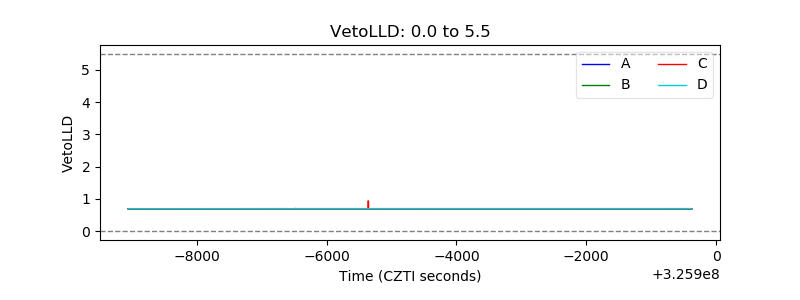 |
| Alpha Counter | 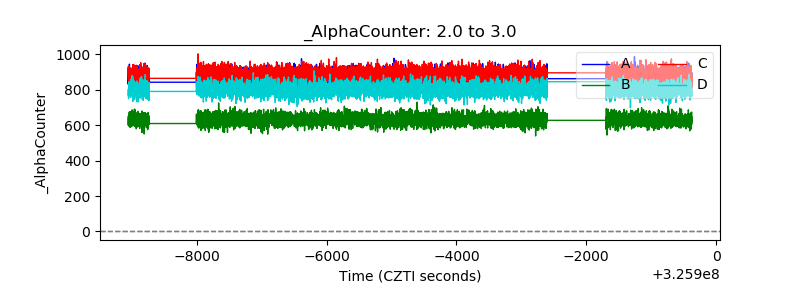 |
| _CPM_Rate | 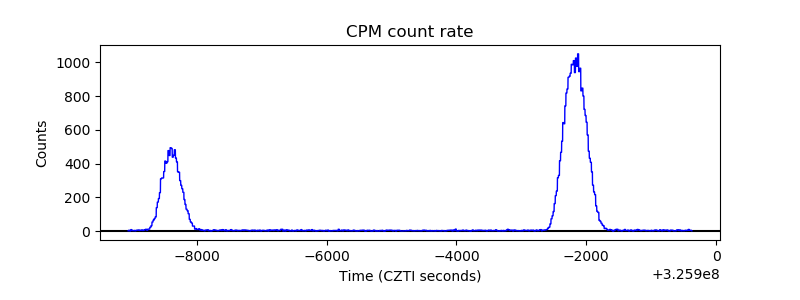 |
| CZT Counter | 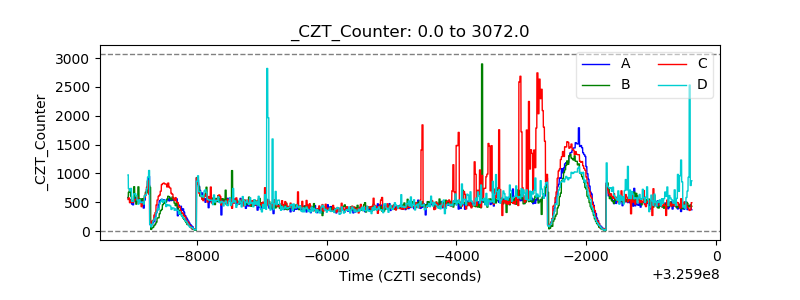 |
| +2.5 Volts monitor |  |
| +5 Volts monitor |  |
| _ROLL_ROT | 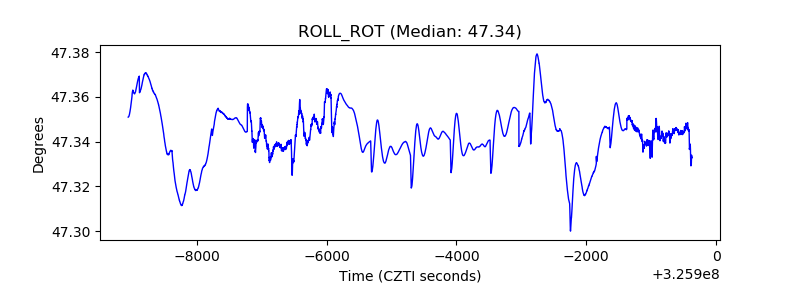 |
| _Roll_DEC | 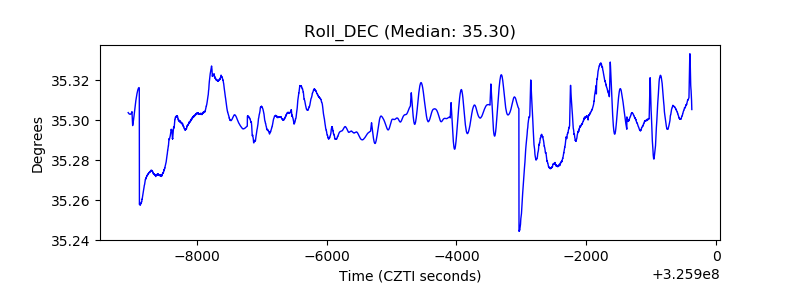 |
| _Roll_RA | 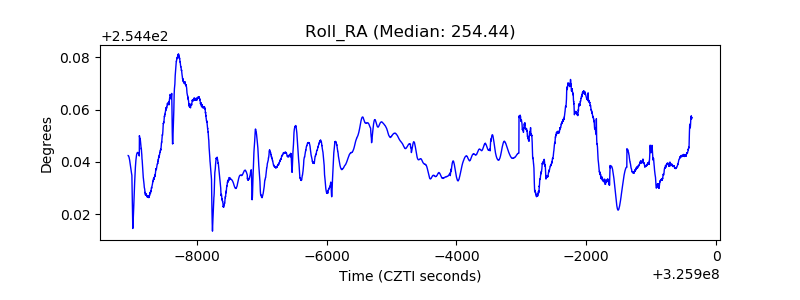 |
| Veto Counter | 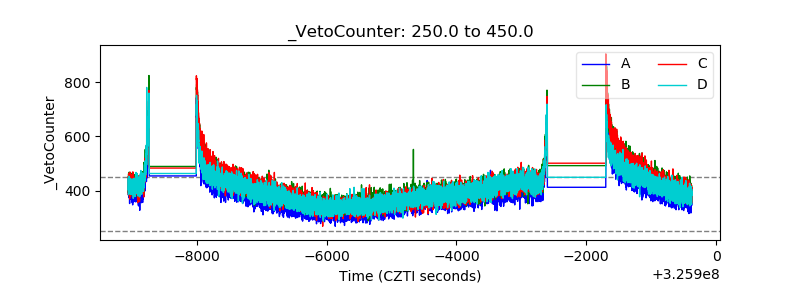 |