| Param | Original file | Final file |
|---|---|---|
| Filename | modeM0/AS1T03_197T01_9000003626_24805cztM0_level2.evt | modeM0/AS1T03_197T01_9000003626_24805cztM0_level2_quad_clean.evt |
| Size (bytes) | 468,282,240 | 97,464,960 |
| Size | 446.6 MB | 92.9 MB |
| Events in quadrant A | 3,198,564 | 627,391 |
| Events in quadrant B | 3,275,121 | 639,430 |
| Events in quadrant C | 3,492,415 | 615,765 |
| Events in quadrant D | 3,755,995 | 597,537 |
| Mode M9 | |||
|---|---|---|---|
| Quadrant | BADHDUFLAG | Total packets | Discarded packets |
| A | 0 | 20 | 0 |
| B | 0 | 20 | 0 |
| C | 0 | 20 | 0 |
| D | 0 | 20 | 0 |
| Mode SS | |||
|---|---|---|---|
| Quadrant | BADHDUFLAG | Total packets | Discarded packets |
| A | 0 | 138 | 0 |
| B | 0 | 138 | 0 |
| C | 0 | 138 | 0 |
| D | 0 | 138 | 0 |
| Mode M0 | |||
|---|---|---|---|
| Quadrant | BADHDUFLAG | Total packets | Discarded packets |
| A | 0 | 13980 | 3 |
| B | 0 | 14104 | 2 |
| C | 0 | 14786 | 2 |
| D | 0 | 15782 | 2 |
| Quadrant | Total seconds | Saturated seconds | Saturation percentage |
|---|---|---|---|
| A | 6771 | 39 | 0.575986% |
| B | 6772 | 66 | 0.974601% |
| C | 6772 | 200 | 2.953337% |
| D | 6772 | 65 | 0.959835% |
Noise dominated data is calculated using 1-second bins in cleaned event files. If a bin has >2000 counts, and if more than 50% of those come from <1% of pixels, then it is considered to be noise-dominated and hence unusable.
| Quadrant | # 1 sec bins | Bins with >0 counts | Bins with >2000 counts | High rate bins dominated by noise | Noise dominated (total time) | Noise dominated (detector-on time) | Marked lightcurve |
|---|---|---|---|---|---|---|---|
| A | 8711 | 6773 | 0 | 0 | 0.00% | 0.00% | 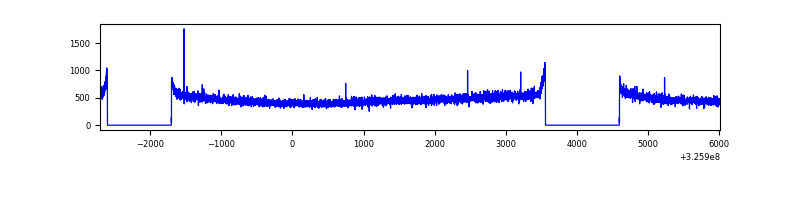 |
| B | 8712 | 6774 | 1 | 1 | 0.01% | 0.01% | 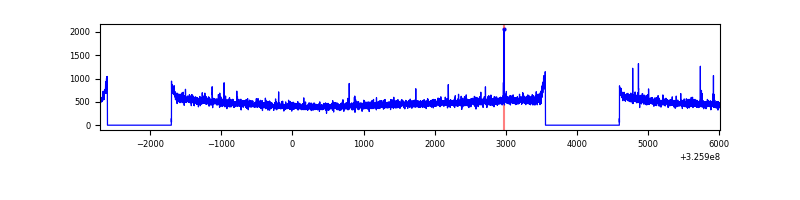 |
| C | 8712 | 6774 | 79 | 79 | 0.91% | 1.17% | 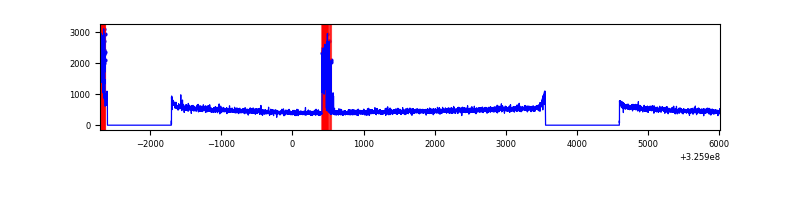 |
| D | 8712 | 6774 | 42 | 42 | 0.48% | 0.62% | 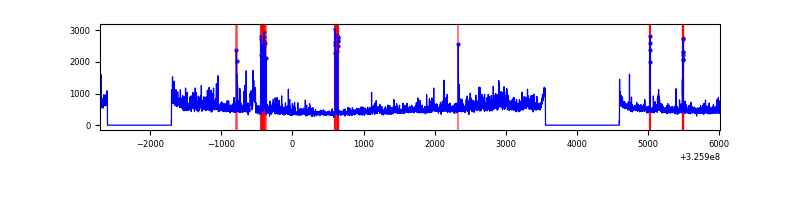 |
Top three noisy pixels from each quadrant. If the there are fewer than three noisy pixels in the level2.evt file, extra rows are filled as -1
| Pixel properties | Quadrant properties | ||||||
|---|---|---|---|---|---|---|---|
| Quadrant | DetID | PixID | Counts | Sigma | Mean | Median | Sigma |
| A | 13 | 254 | 10528 | 58.23 | 828 | 810 | 166.9 |
| A | 3 | 137 | 7529 | 40.26 | 828 | 810 | 166.9 |
| A | 0 | 226 | 6970 | 36.91 | 828 | 810 | 166.9 |
| B | 12 | 111 | 19589 | 118.29 | 826 | 805 | 158.8 |
| B | 11 | 111 | 17813 | 107.11 | 826 | 805 | 158.8 |
| B | 14 | 111 | 16330 | 97.77 | 826 | 805 | 158.8 |
| C | 2 | 16 | 285959 | 1541.94 | 789 | 792 | 184.9 |
| C | 14 | 238 | 127050 | 682.69 | 789 | 792 | 184.9 |
| C | 13 | 61 | 5526 | 25.59 | 789 | 792 | 184.9 |
| D | 8 | 195 | 505471 | 2603.94 | 800 | 777 | 193.8 |
| D | 1 | 52 | 173312 | 890.18 | 800 | 777 | 193.8 |
| D | 2 | 120 | 43308 | 219.44 | 800 | 777 | 193.8 |
Histogram calculated using DETX and DETY for each event in the final _common_clean file
| Quadrant A | 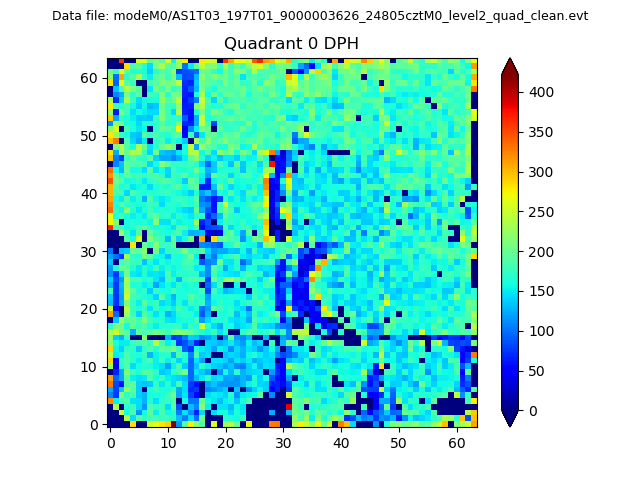 |
 |
Quadrant B |
|---|---|---|---|
| Quadrant D | 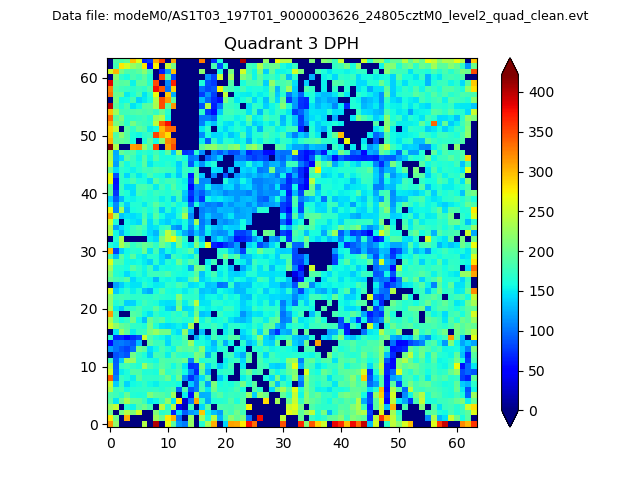 |
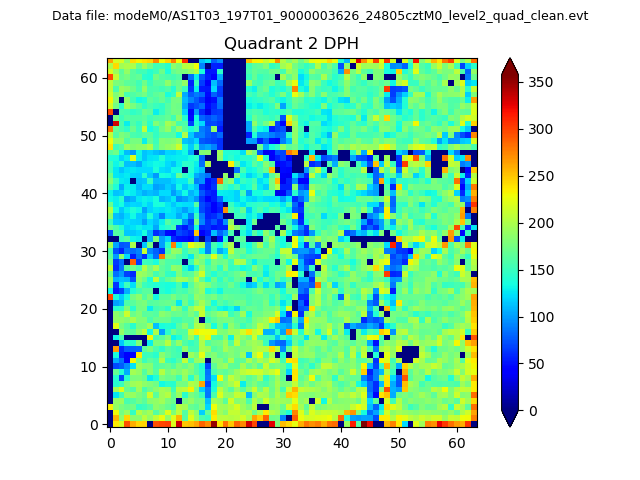 |
Quadrant C |
| Plot type | Count rate plots | Images |
|---|---|---|
| Comparison with Poisson distribution Blue bars denote a histogram of data divided into 1 sec bins. Red curve is a Poisson curve with rate = median count rate of data. |
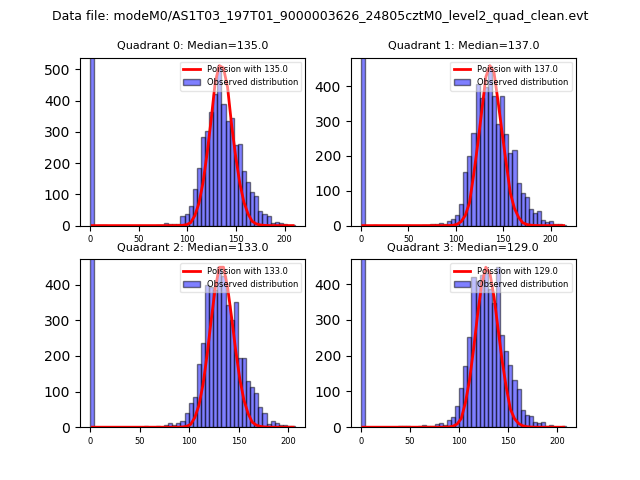 |
 |
| Quadrant-wise count rates Data is divided into 100 sec bins |
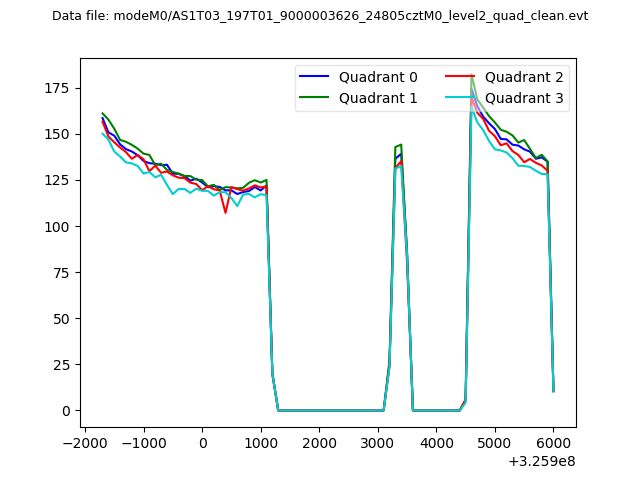 |
|
| Module-wise count rates for Quadrant A Data is divided into 100 sec bins |
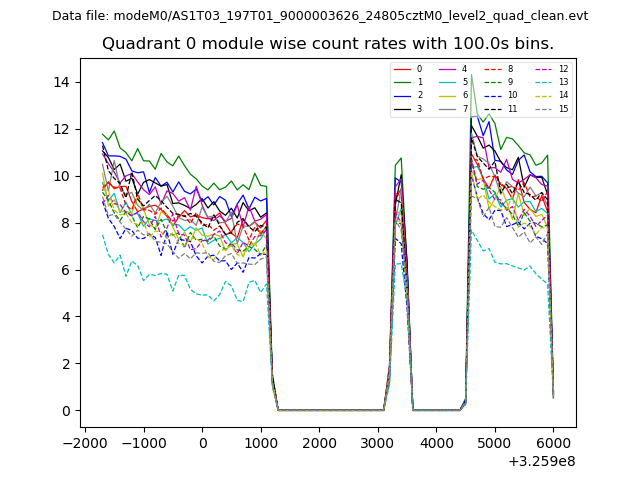 |
 |
| Module-wise count rates for Quadrant B Data is divided into 100 sec bins |
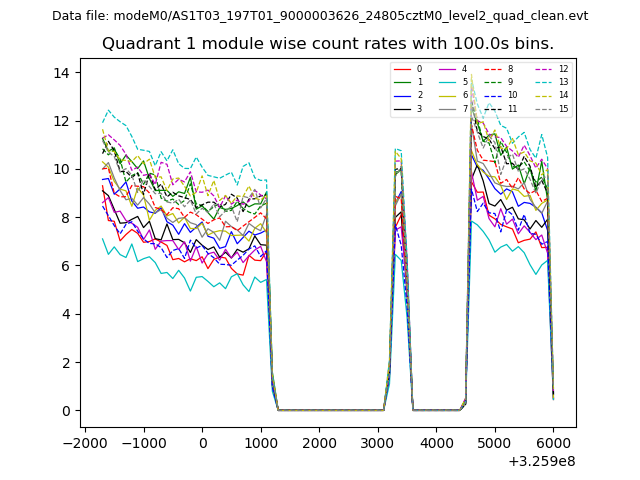 |
 |
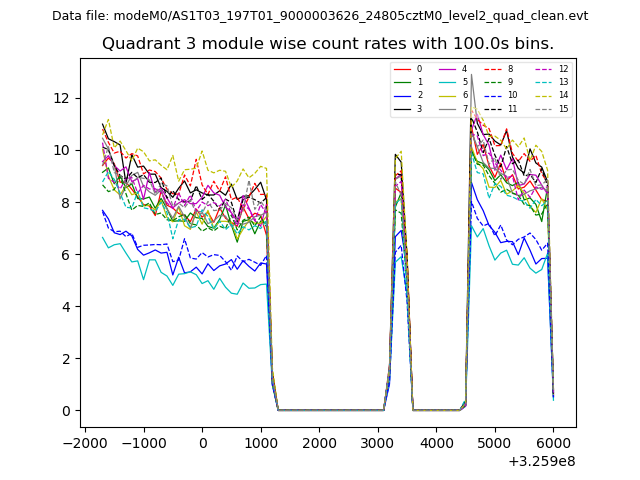
| Module-wise count rates for Quadrant C Data is divided into 100 sec bins |
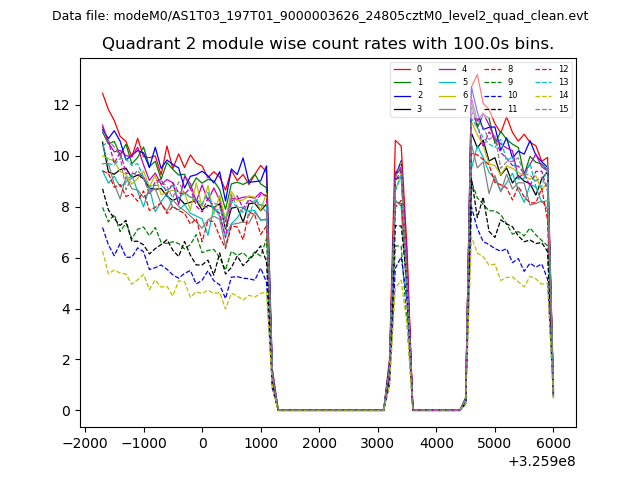 |
 |
| Module-wise count rates for Quadrant D Data is divided into 100 sec bins |
 |
 |
| Parameter | Plot |
|---|---|
| CZT HV Monitor |  |
| D_VDD | 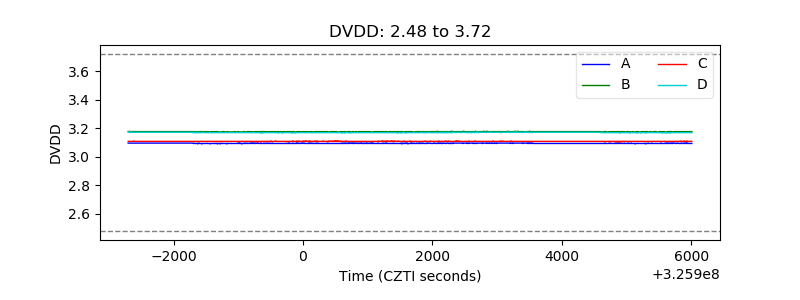 |
| Temperature 1 | 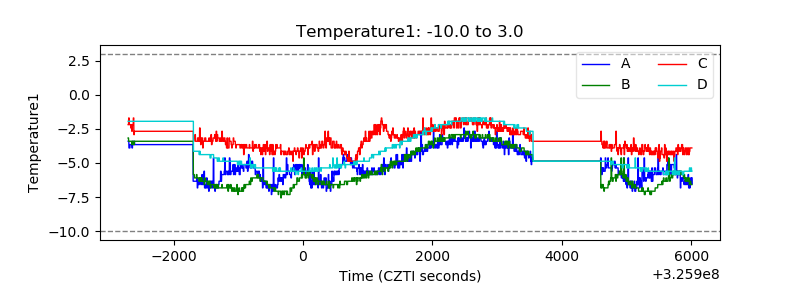 |
| Veto HV Monitor | 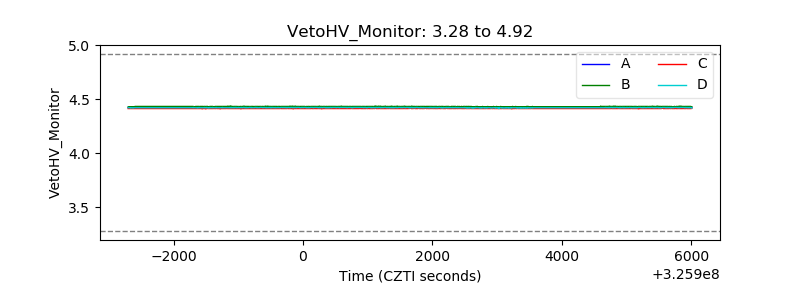 |
| Veto LLD | 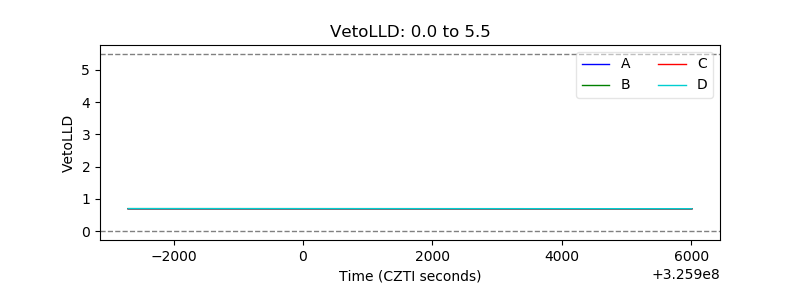 |
| Alpha Counter | 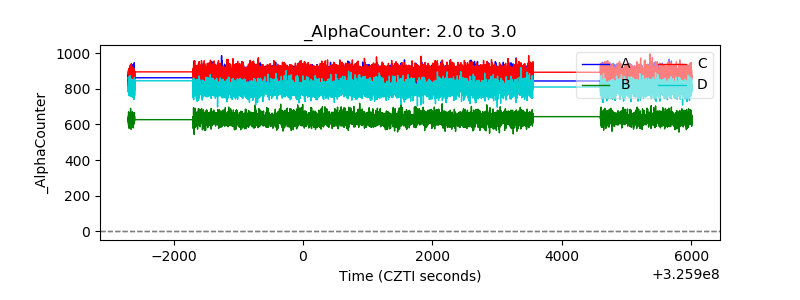 |
| _CPM_Rate | 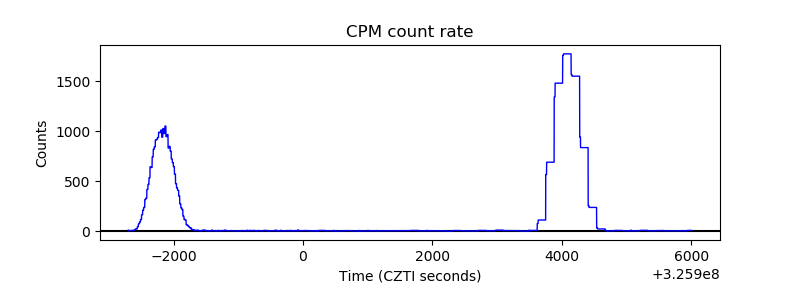 |
| CZT Counter | 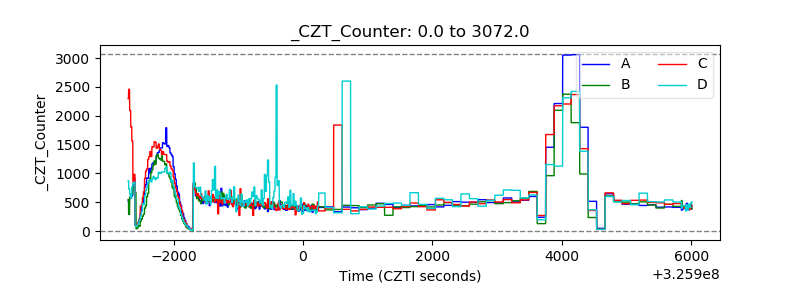 |
| +2.5 Volts monitor |  |
| +5 Volts monitor | 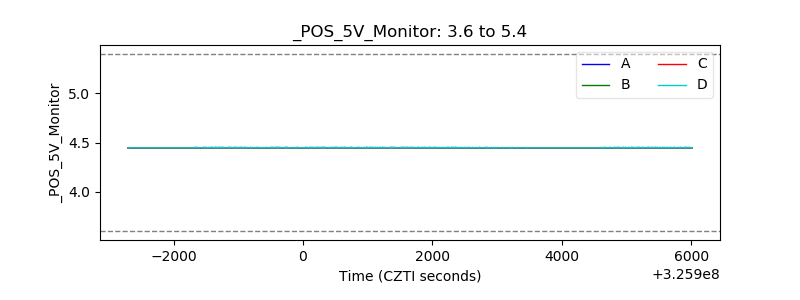 |
| _ROLL_ROT | 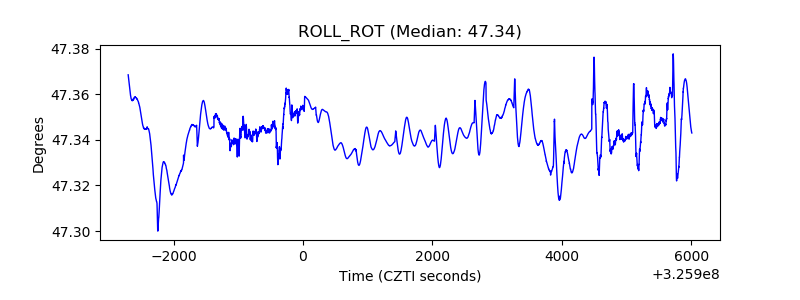 |
| _Roll_DEC | 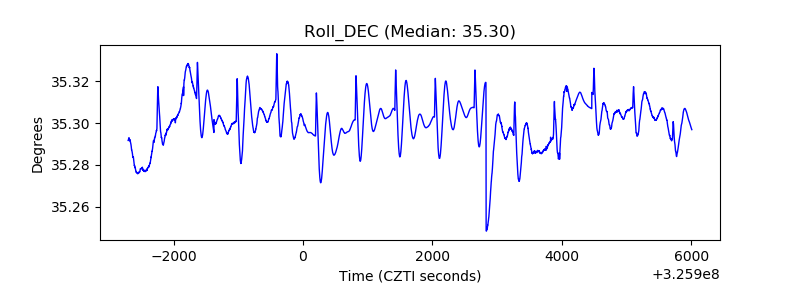 |
| _Roll_RA | 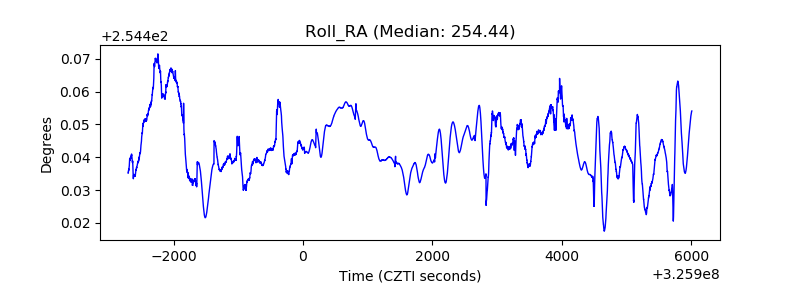 |
| Veto Counter | 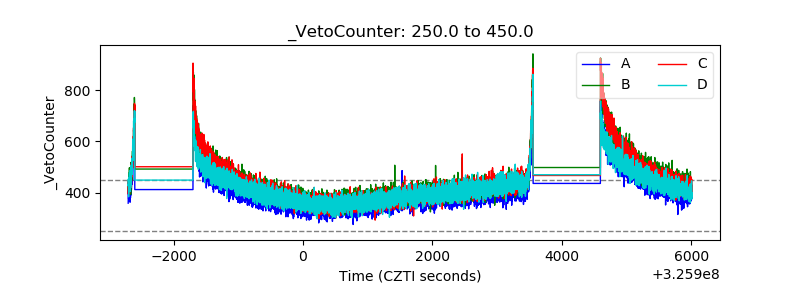 |