| Param | Original file | Final file |
|---|---|---|
| Filename | modeM0/AS1T03_197T01_9000003626_24808cztM0_level2.evt | modeM0/AS1T03_197T01_9000003626_24808cztM0_level2_quad_clean.evt |
| Size (bytes) | 464,616,000 | 107,467,200 |
| Size | 443.1 MB | 102.5 MB |
| Events in quadrant A | 3,327,419 | 714,257 |
| Events in quadrant B | 3,523,033 | 723,017 |
| Events in quadrant C | 3,364,745 | 684,198 |
| Events in quadrant D | 3,409,246 | 674,942 |
| Mode M9 | |||
|---|---|---|---|
| Quadrant | BADHDUFLAG | Total packets | Discarded packets |
| A | 0 | 16 | 0 |
| B | 0 | 17 | 0 |
| C | 0 | 17 | 0 |
| D | 0 | 17 | 0 |
| Mode SS | |||
|---|---|---|---|
| Quadrant | BADHDUFLAG | Total packets | Discarded packets |
| A | 0 | 132 | 0 |
| B | 0 | 132 | 0 |
| C | 0 | 132 | 0 |
| D | 0 | 132 | 0 |
| Mode M0 | |||
|---|---|---|---|
| Quadrant | BADHDUFLAG | Total packets | Discarded packets |
| A | 0 | 13765 | 2 |
| B | 0 | 14454 | 2 |
| C | 0 | 13939 | 3 |
| D | 0 | 14206 | 2 |
| Quadrant | Total seconds | Saturated seconds | Saturation percentage |
|---|---|---|---|
| A | 6579 | 26 | 0.395197% |
| B | 6579 | 60 | 0.911993% |
| C | 6578 | 70 | 1.064153% |
| D | 6578 | 22 | 0.334448% |
Noise dominated data is calculated using 1-second bins in cleaned event files. If a bin has >2000 counts, and if more than 50% of those come from <1% of pixels, then it is considered to be noise-dominated and hence unusable.
| Quadrant | # 1 sec bins | Bins with >0 counts | Bins with >2000 counts | High rate bins dominated by noise | Noise dominated (total time) | Noise dominated (detector-on time) | Marked lightcurve |
|---|---|---|---|---|---|---|---|
| A | 7824 | 6580 | 0 | 0 | 0.00% | 0.00% | 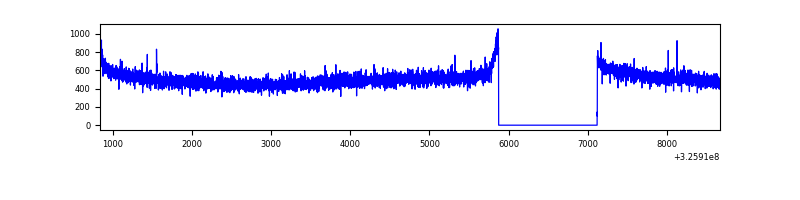 |
| B | 7824 | 6580 | 3 | 3 | 0.04% | 0.05% | 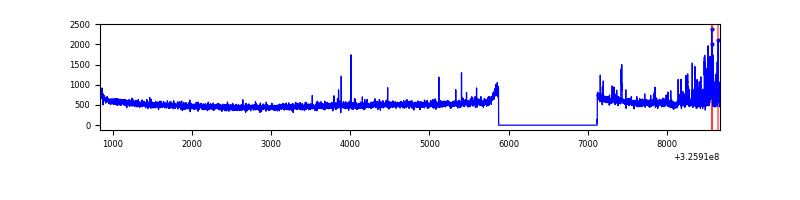 |
| C | 7823 | 6579 | 0 | 0 | 0.00% | 0.00% | 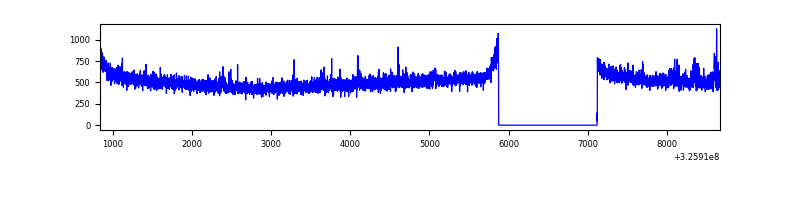 |
| D | 7823 | 6579 | 2 | 2 | 0.03% | 0.03% | 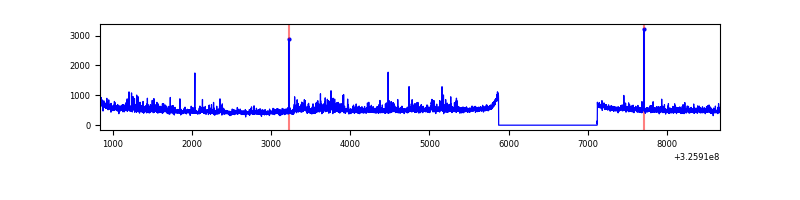 |
Top three noisy pixels from each quadrant. If the there are fewer than three noisy pixels in the level2.evt file, extra rows are filled as -1
| Pixel properties | Quadrant properties | ||||||
|---|---|---|---|---|---|---|---|
| Quadrant | DetID | PixID | Counts | Sigma | Mean | Median | Sigma |
| A | 13 | 254 | 10688 | 57.3 | 863 | 851 | 171.7 |
| A | 0 | 226 | 7392 | 38.1 | 863 | 851 | 171.7 |
| A | 3 | 137 | 7355 | 37.89 | 863 | 851 | 171.7 |
| B | 3 | 64 | 150679 | 939.7 | 853 | 833 | 159.5 |
| B | 12 | 111 | 19064 | 114.33 | 853 | 833 | 159.5 |
| B | 11 | 111 | 17296 | 103.24 | 853 | 833 | 159.5 |
| C | 14 | 238 | 131733 | 697.12 | 814 | 823 | 187.8 |
| C | 2 | 16 | 30974 | 160.56 | 814 | 823 | 187.8 |
| C | 10 | 218 | 12858 | 64.09 | 814 | 823 | 187.8 |
| D | 8 | 195 | 258205 | 1313.22 | 825 | 802 | 196.0 |
| D | 1 | 52 | 25938 | 128.24 | 825 | 802 | 196.0 |
| D | 2 | 234 | 21954 | 107.91 | 825 | 802 | 196.0 |
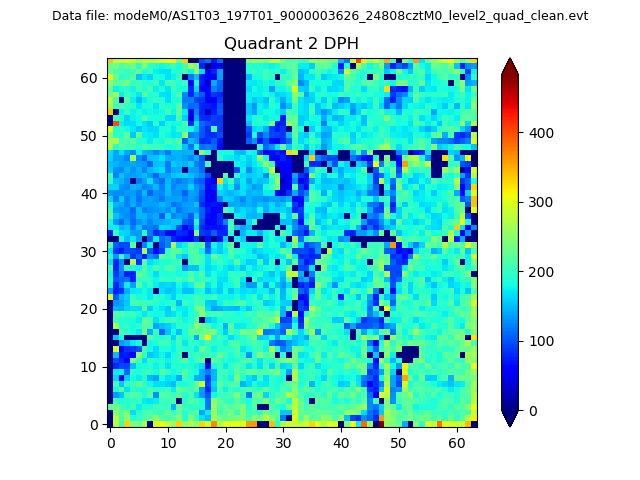
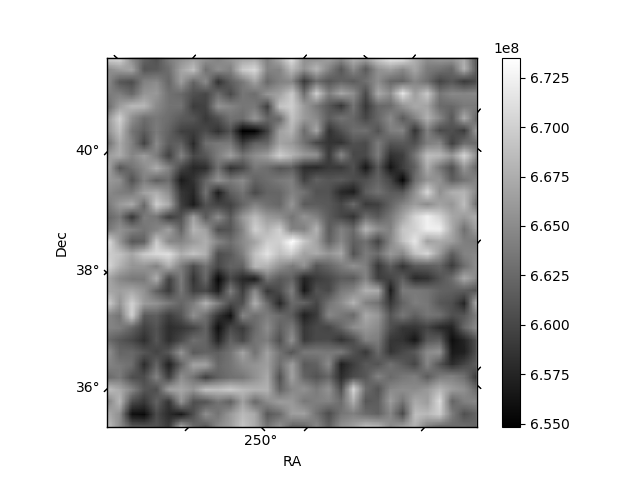
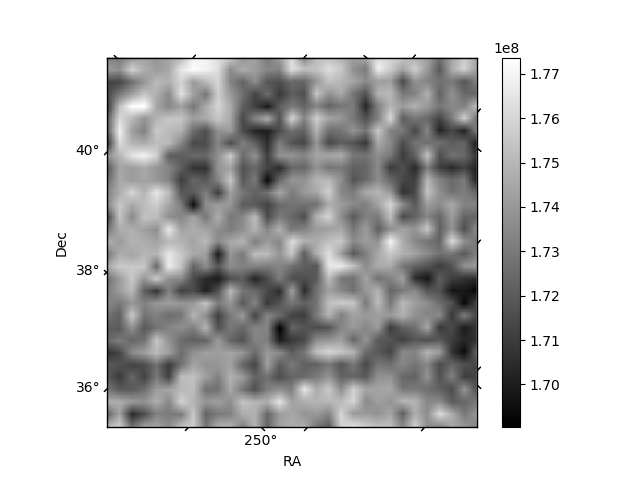
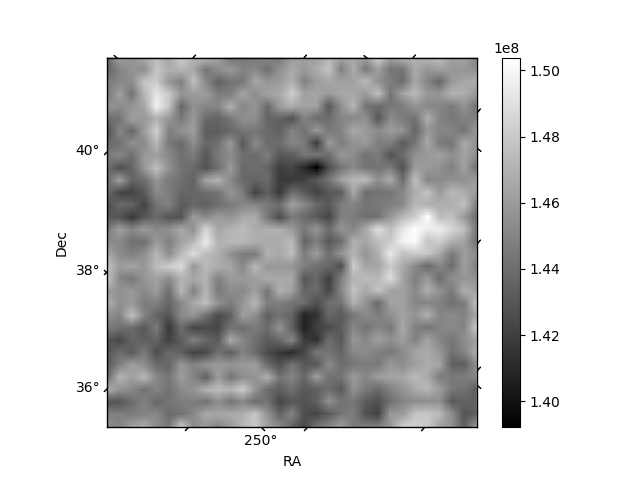
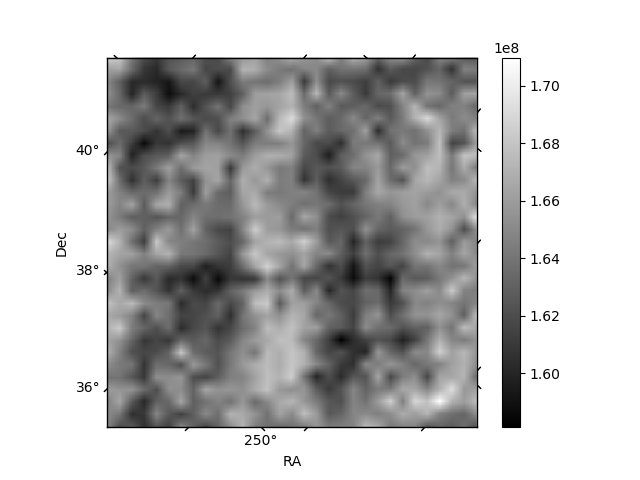
Histogram calculated using DETX and DETY for each event in the final _common_clean file
| Quadrant A | 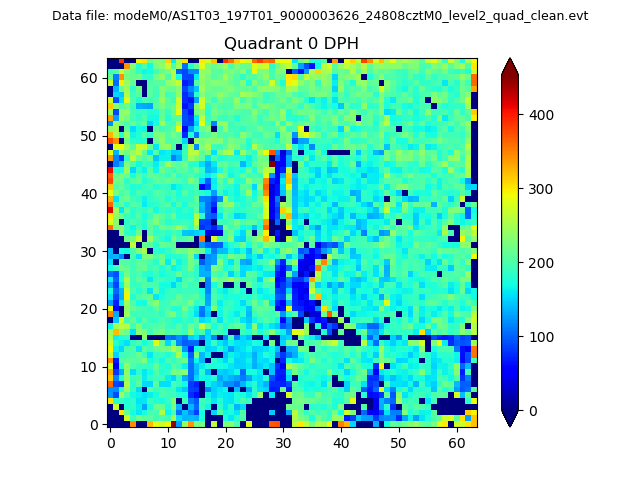 |
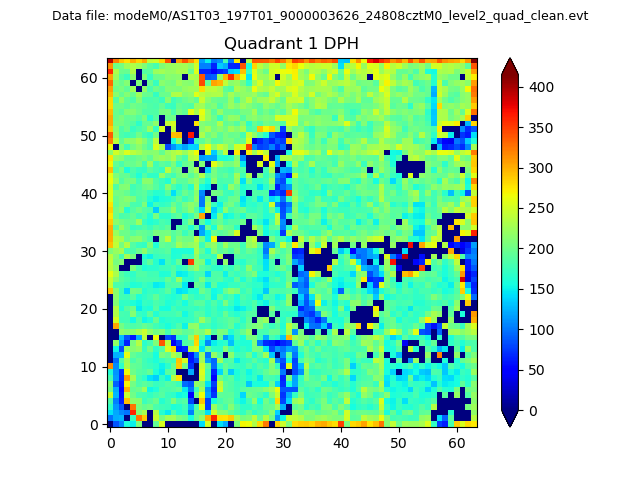 |
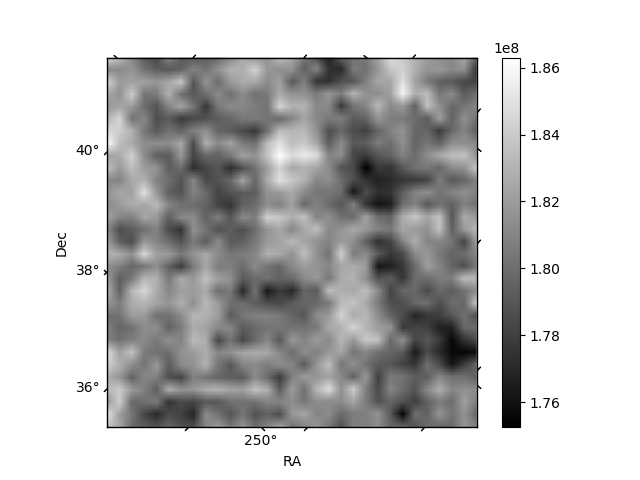
Quadrant B |
|---|---|---|---|
| Quadrant D | 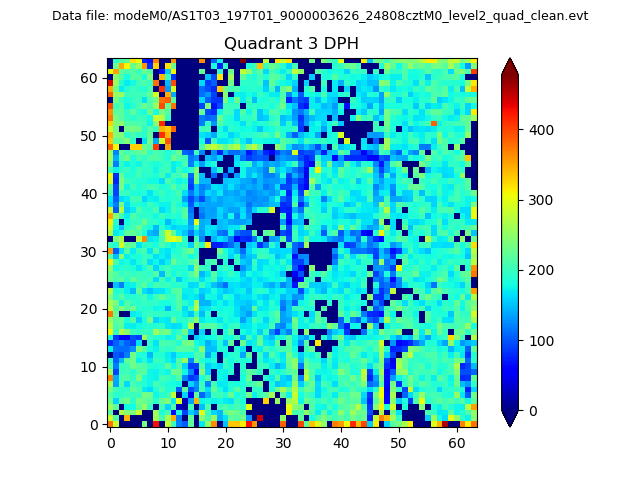 |
 |
Quadrant C |
| Plot type | Count rate plots | Images |
|---|---|---|
| Comparison with Poisson distribution Blue bars denote a histogram of data divided into 1 sec bins. Red curve is a Poisson curve with rate = median count rate of data. |
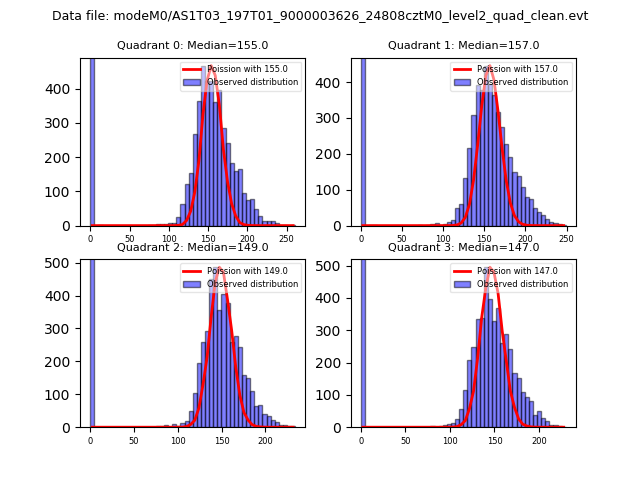 |
 |
| Quadrant-wise count rates Data is divided into 100 sec bins |
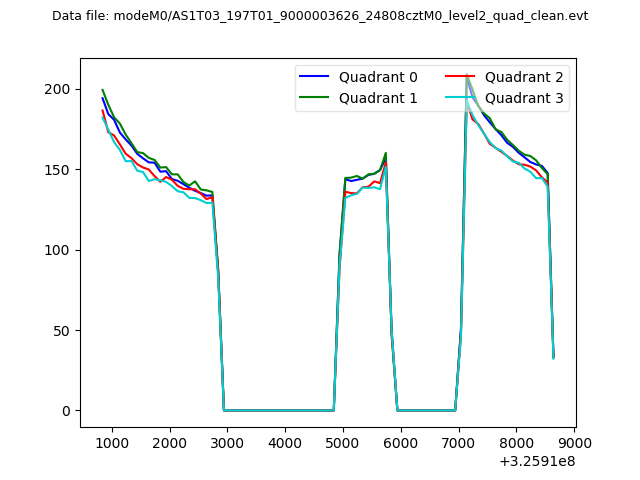 |
|
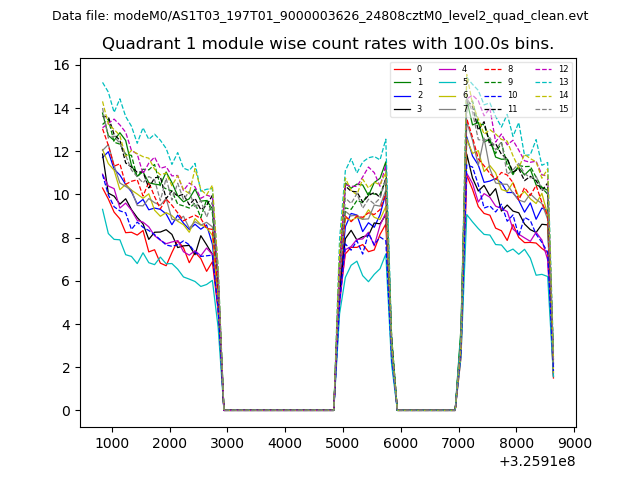
| Module-wise count rates for Quadrant A Data is divided into 100 sec bins |
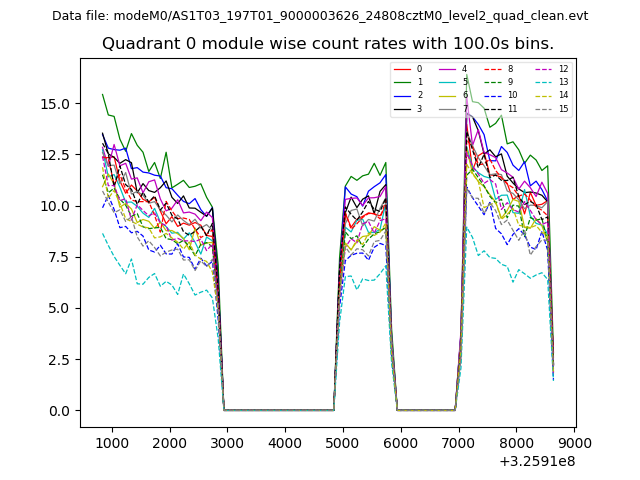 |
 |
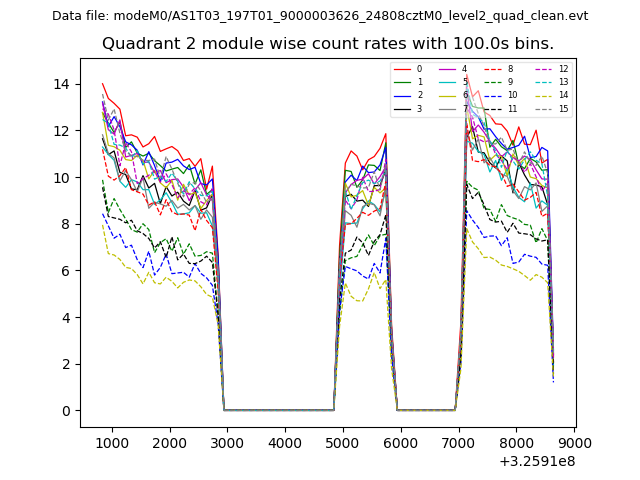
| Module-wise count rates for Quadrant B Data is divided into 100 sec bins |
 |
 |
| Module-wise count rates for Quadrant C Data is divided into 100 sec bins |
 |
 |
| Module-wise count rates for Quadrant D Data is divided into 100 sec bins |
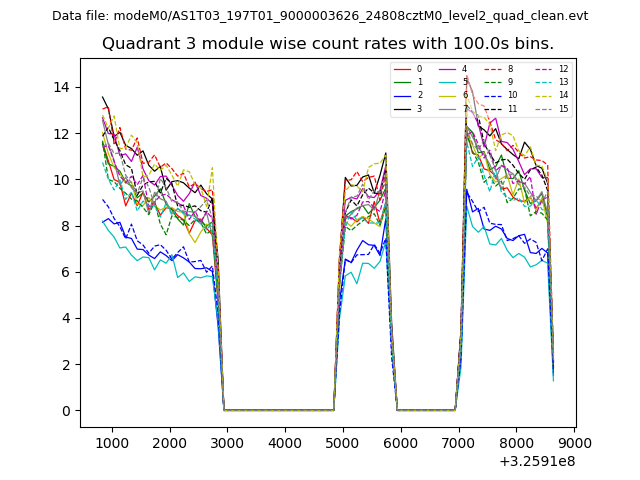 |
 |
| Parameter | Plot |
|---|---|
| CZT HV Monitor | 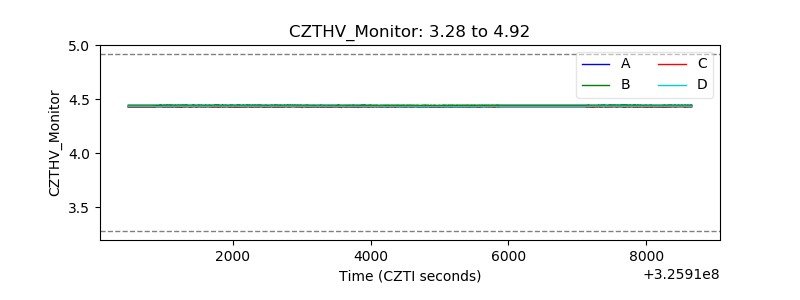 |
| D_VDD | 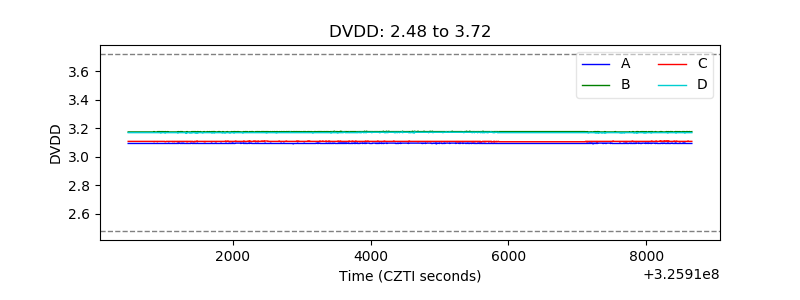 |
| Temperature 1 | 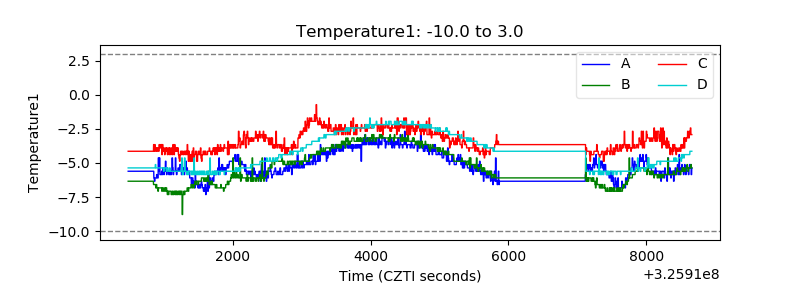 |
| Veto HV Monitor | 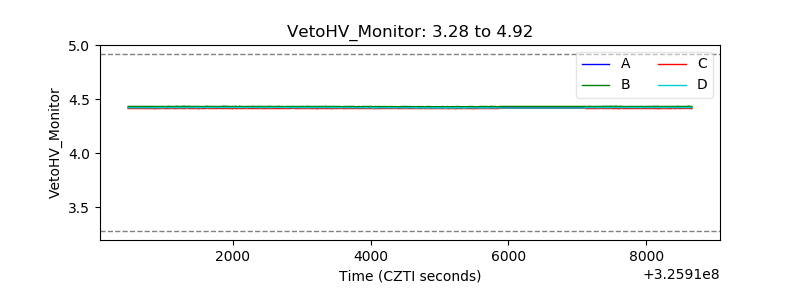 |
| Veto LLD | 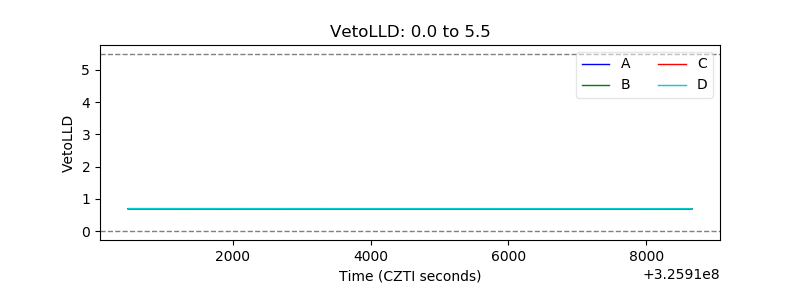 |
| Alpha Counter | 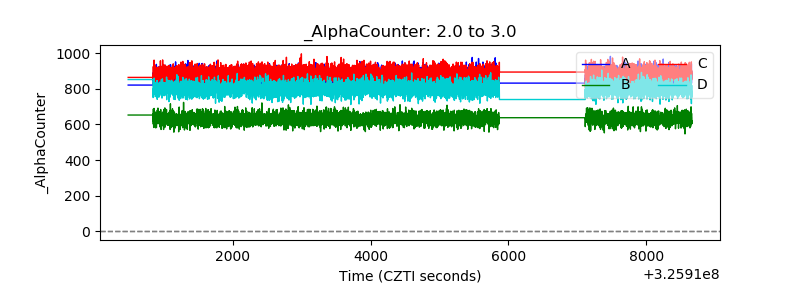 |
| _CPM_Rate | 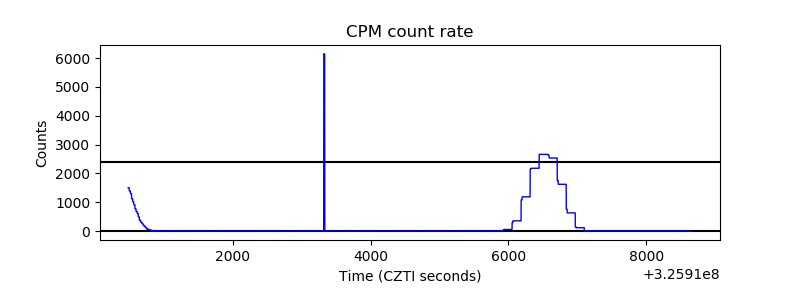 |
| CZT Counter | 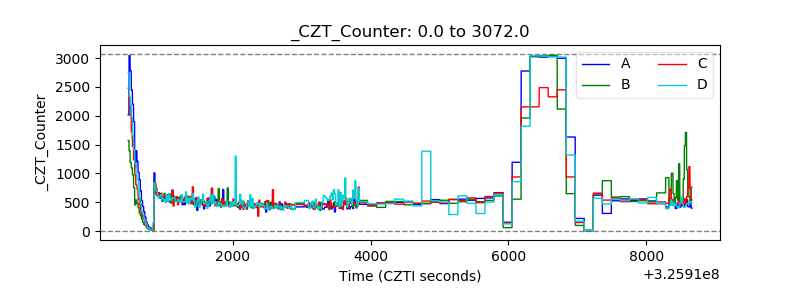 |
| +2.5 Volts monitor |  |
| +5 Volts monitor |  |
| _ROLL_ROT | 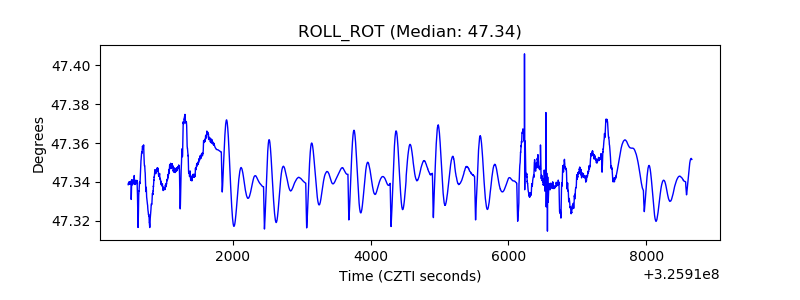 |
| _Roll_DEC | 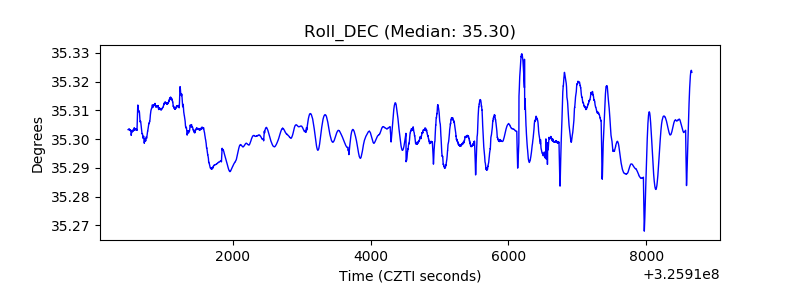 |
| _Roll_RA | 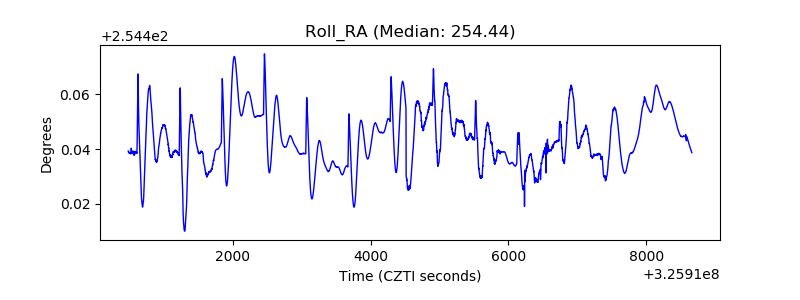 |
| Veto Counter | 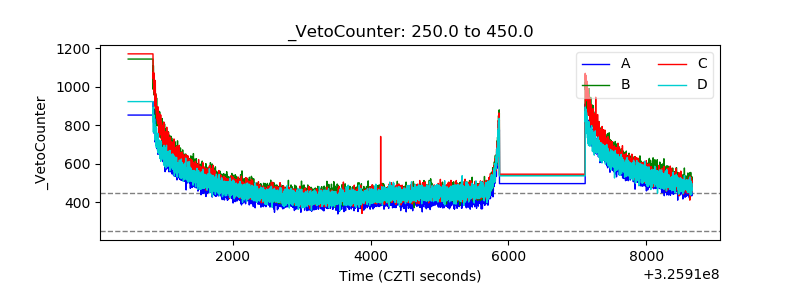 |