| Param | Original file | Final file |
|---|---|---|
| Filename | modeM0/AS1T03_197T01_9000003626_24809cztM0_level2.evt | modeM0/AS1T03_197T01_9000003626_24809cztM0_level2_quad_clean.evt |
| Size (bytes) | 225,688,320 | 43,076,160 |
| Size | 215.2 MB | 41.1 MB |
| Events in quadrant A | 1,610,764 | 282,557 |
| Events in quadrant B | 1,689,838 | 271,910 |
| Events in quadrant C | 1,639,164 | 266,667 |
| Events in quadrant D | 1,678,351 | 258,905 |
| Mode M9 | |||
|---|---|---|---|
| Quadrant | BADHDUFLAG | Total packets | Discarded packets |
| A | 0 | 13 | 8 |
| B | 0 | 13 | 5 |
| C | 0 | 13 | 6 |
| D | 0 | 13 | 7 |
| Mode SS | |||
|---|---|---|---|
| Quadrant | BADHDUFLAG | Total packets | Discarded packets |
| A | 0 | 100 | 40 |
| B | 0 | 98 | 39 |
| C | 0 | 100 | 32 |
| D | 0 | 100 | 34 |
| Mode M0 | |||
|---|---|---|---|
| Quadrant | BADHDUFLAG | Total packets | Discarded packets |
| A | 0 | 10238 | 3746 |
| B | 0 | 11145 | 4419 |
| C | 0 | 10380 | 3758 |
| D | 0 | 11118 | 4343 |
| Quadrant | Total seconds | Saturated seconds | Saturation percentage |
|---|---|---|---|
| A | 3182 | 7 | 0.219987% |
| B | 3093 | 30 | 0.969932% |
| C | 3196 | 26 | 0.813517% |
| D | 3091 | 12 | 0.388224% |
Noise dominated data is calculated using 1-second bins in cleaned event files. If a bin has >2000 counts, and if more than 50% of those come from <1% of pixels, then it is considered to be noise-dominated and hence unusable.
| Quadrant | # 1 sec bins | Bins with >0 counts | Bins with >2000 counts | High rate bins dominated by noise | Noise dominated (total time) | Noise dominated (detector-on time) | Marked lightcurve |
|---|---|---|---|---|---|---|---|
| A | 6002 | 3906 | 0 | 0 | 0.00% | 0.00% | 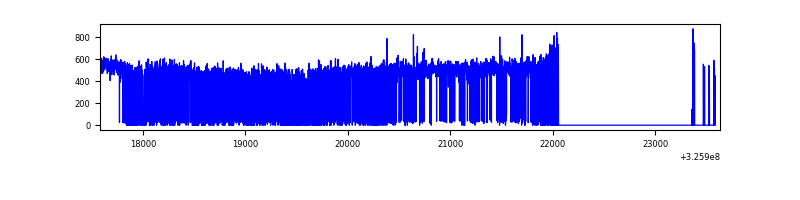 |
| B | 6029 | 3847 | 7 | 7 | 0.12% | 0.18% | 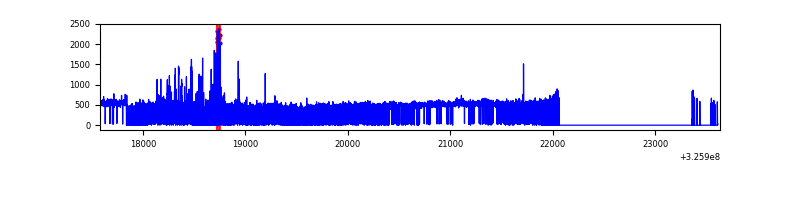 |
| C | 6002 | 3924 | 0 | 0 | 0.00% | 0.00% | 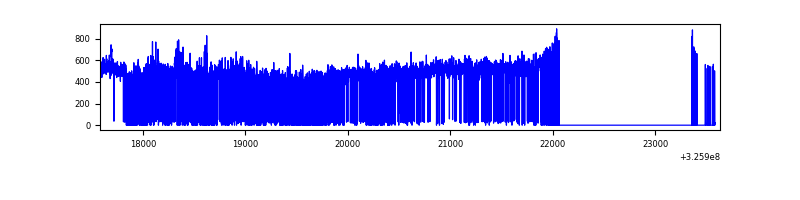 |
| D | 6049 | 3840 | 8 | 8 | 0.13% | 0.21% | 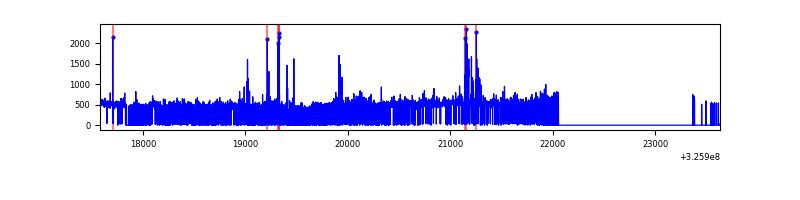 |
Top three noisy pixels from each quadrant. If the there are fewer than three noisy pixels in the level2.evt file, extra rows are filled as -1
| Pixel properties | Quadrant properties | ||||||
|---|---|---|---|---|---|---|---|
| Quadrant | DetID | PixID | Counts | Sigma | Mean | Median | Sigma |
| A | 13 | 254 | 4685 | 50.67 | 417 | 410 | 84.4 |
| A | 3 | 137 | 3672 | 38.66 | 417 | 410 | 84.4 |
| A | 0 | 226 | 3582 | 37.59 | 417 | 410 | 84.4 |
| B | 3 | 64 | 114453 | 1489.12 | 400 | 391 | 76.6 |
| B | 12 | 111 | 9059 | 113.16 | 400 | 391 | 76.6 |
| B | 11 | 111 | 8222 | 102.24 | 400 | 391 | 76.6 |
| C | 14 | 238 | 64761 | 696.74 | 395 | 398 | 92.4 |
| C | 2 | 16 | 29718 | 317.39 | 395 | 398 | 92.4 |
| C | 13 | 61 | 2766 | 25.63 | 395 | 398 | 92.4 |
| D | 8 | 195 | 126495 | 1329.64 | 391 | 378 | 94.9 |
| D | 1 | 52 | 69249 | 726.1 | 391 | 378 | 94.9 |
| D | 2 | 234 | 11172 | 113.8 | 391 | 378 | 94.9 |
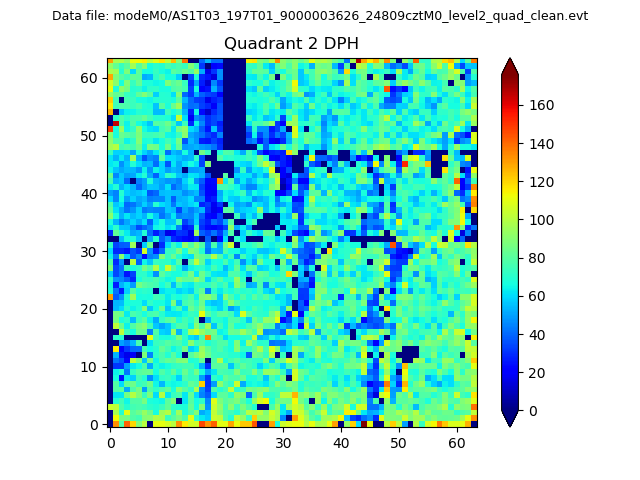
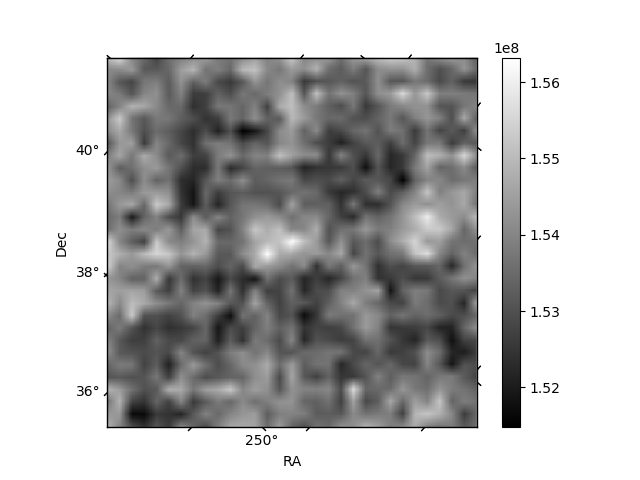
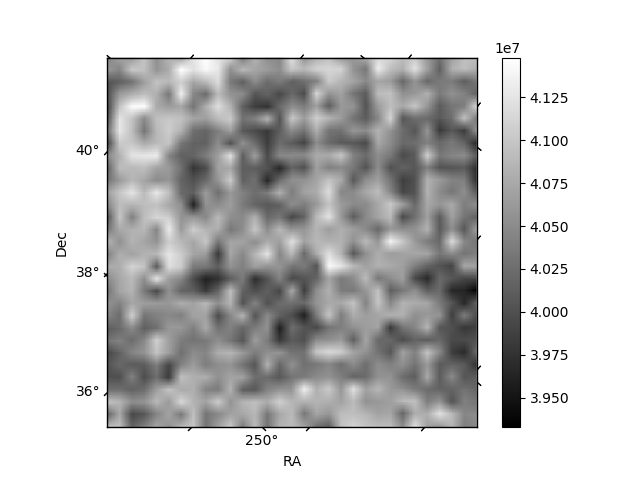
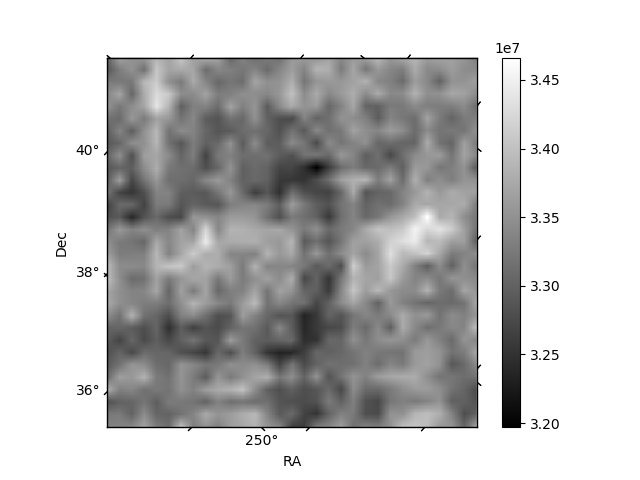
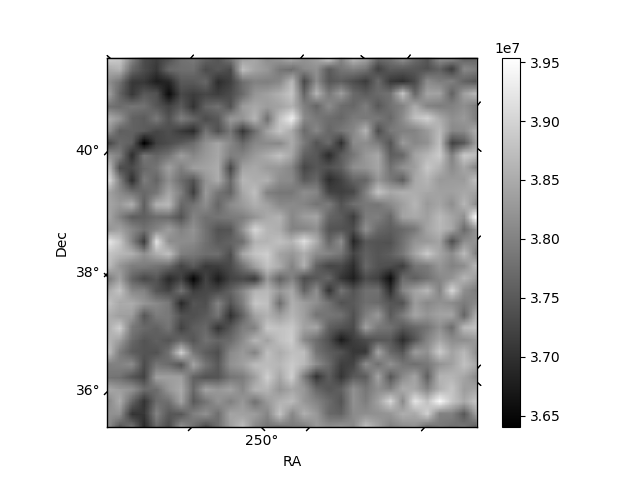
Histogram calculated using DETX and DETY for each event in the final _common_clean file
| Quadrant A | 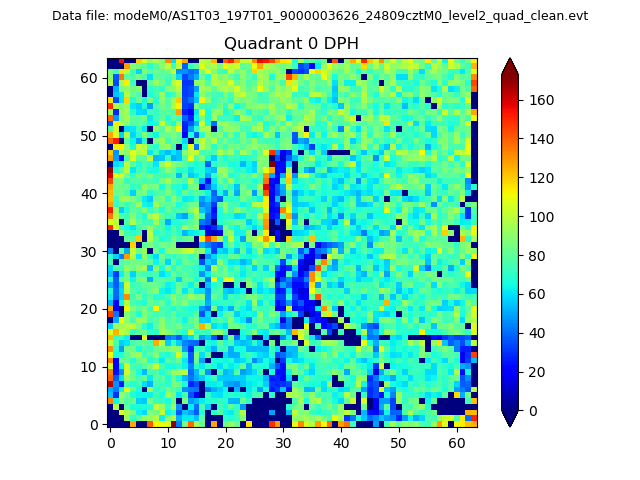 |
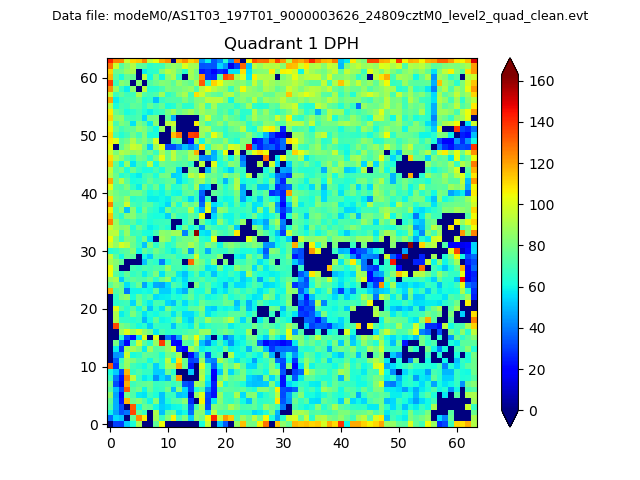 |
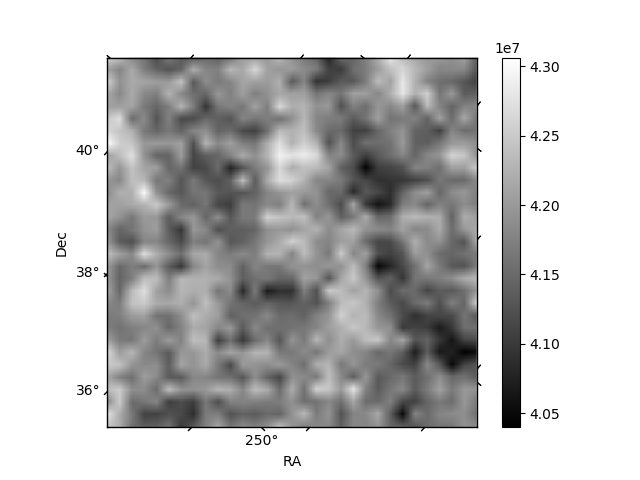
Quadrant B |
|---|---|---|---|
| Quadrant D | 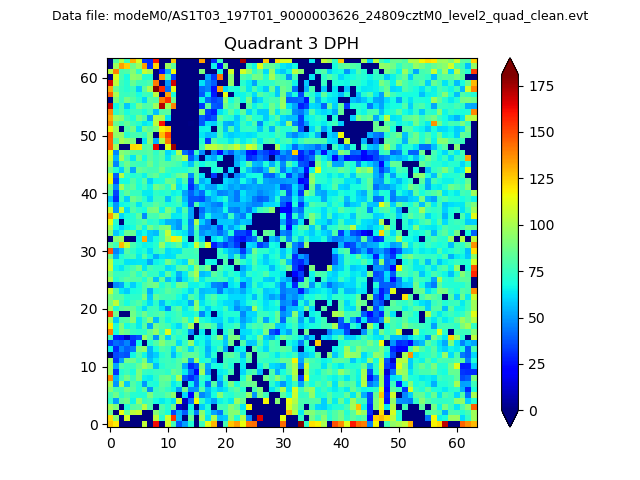 |
 |
Quadrant C |
| Plot type | Count rate plots | Images |
|---|---|---|
| Comparison with Poisson distribution Blue bars denote a histogram of data divided into 1 sec bins. Red curve is a Poisson curve with rate = median count rate of data. |
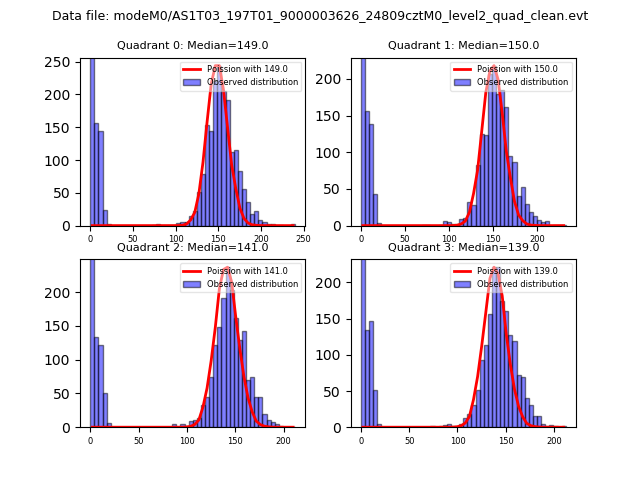 |
 |
| Quadrant-wise count rates Data is divided into 100 sec bins |
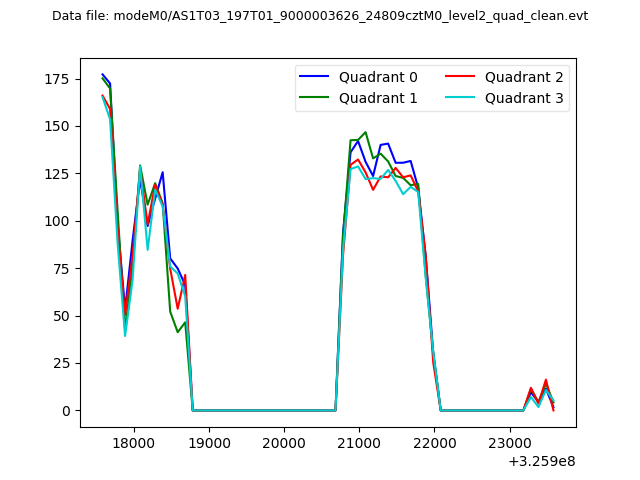 |
|
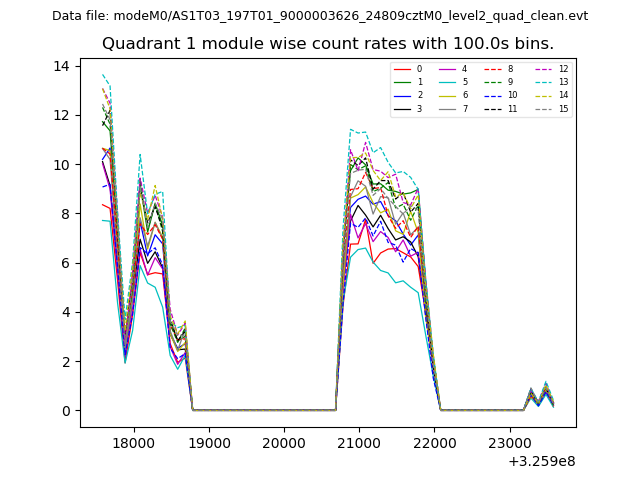
| Module-wise count rates for Quadrant A Data is divided into 100 sec bins |
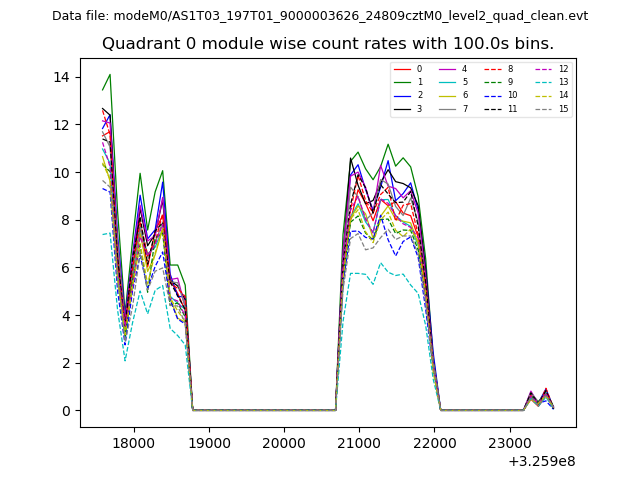 |
 |
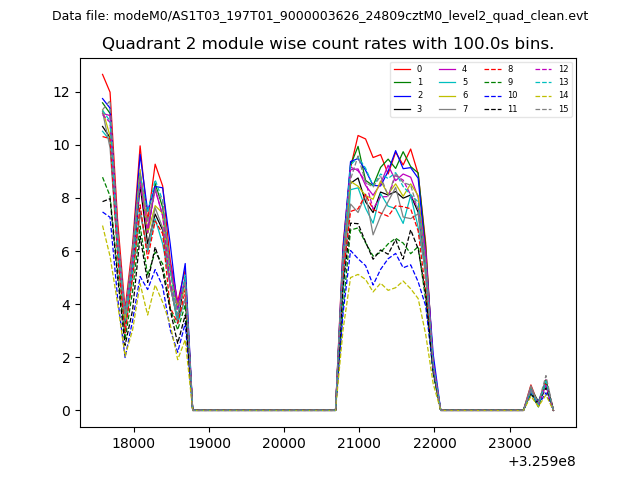
| Module-wise count rates for Quadrant B Data is divided into 100 sec bins |
 |
 |
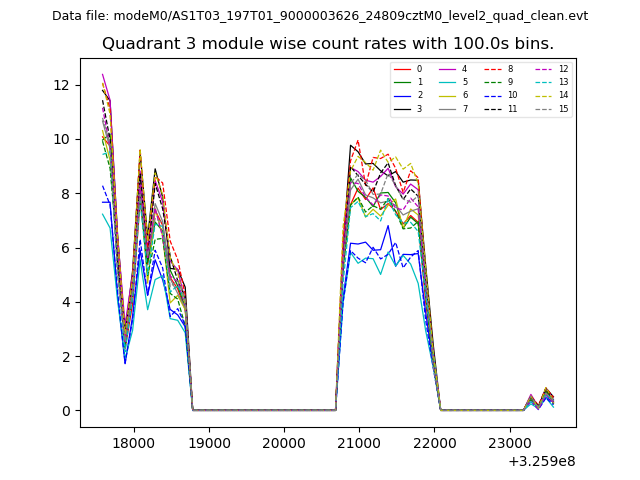
| Module-wise count rates for Quadrant C Data is divided into 100 sec bins |
 |
 |
| Module-wise count rates for Quadrant D Data is divided into 100 sec bins |
 |
 |
| Parameter | Plot |
|---|---|
| CZT HV Monitor | 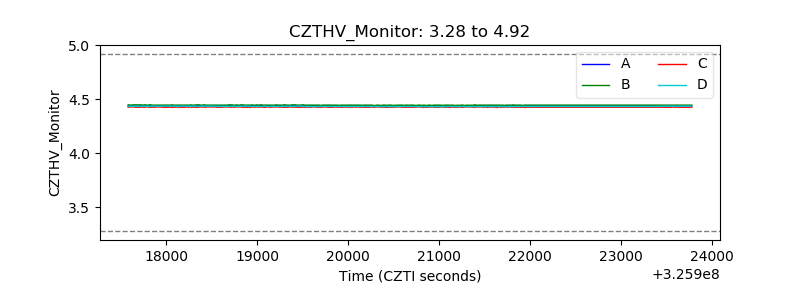 |
| D_VDD | 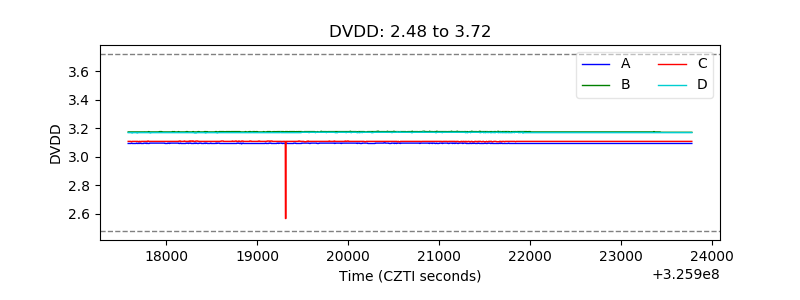 |
| Temperature 1 | 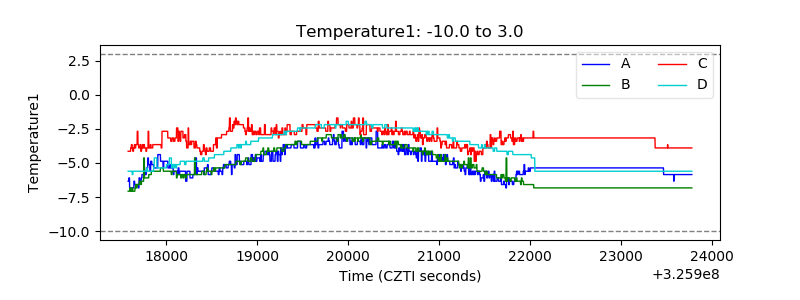 |
| Veto HV Monitor | 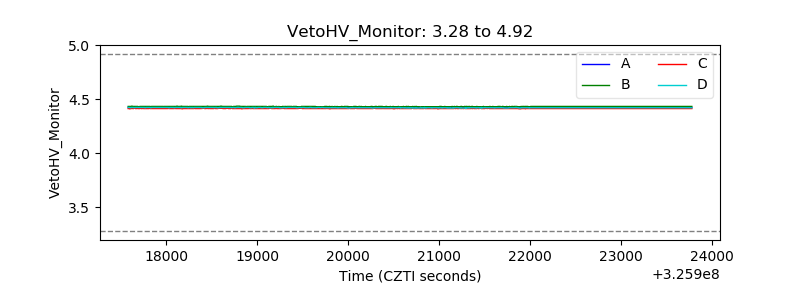 |
| Veto LLD | 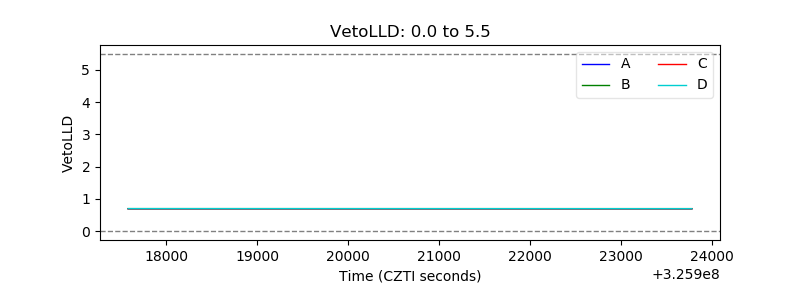 |
| Alpha Counter | 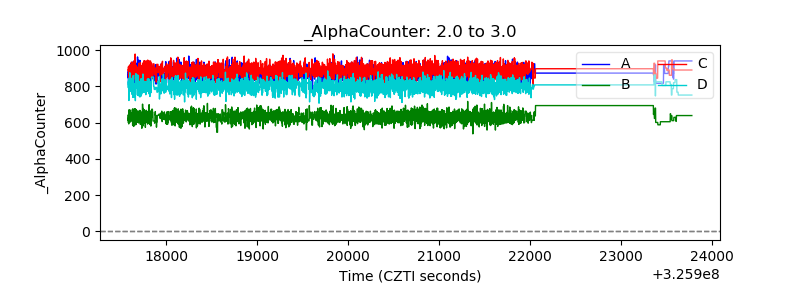 |
| _CPM_Rate | 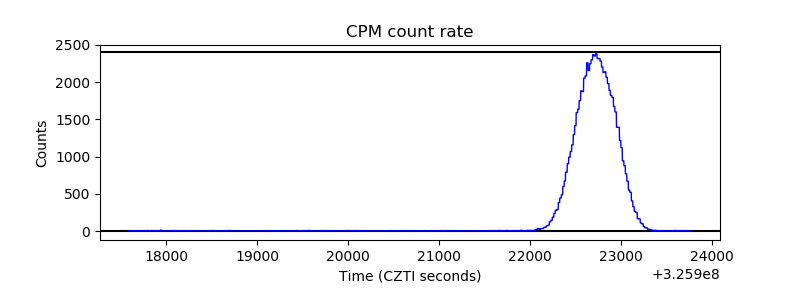 |
| CZT Counter | 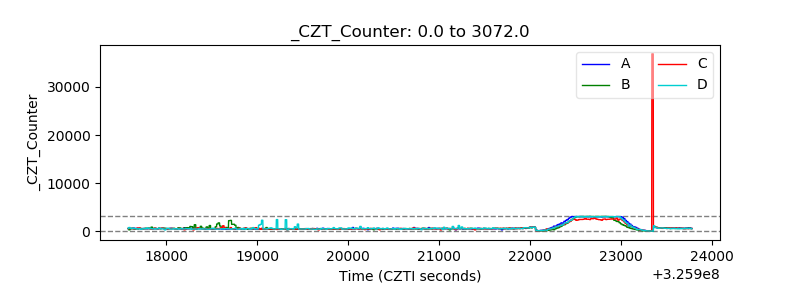 |
| +2.5 Volts monitor |  |
| +5 Volts monitor |  |
| _ROLL_ROT | 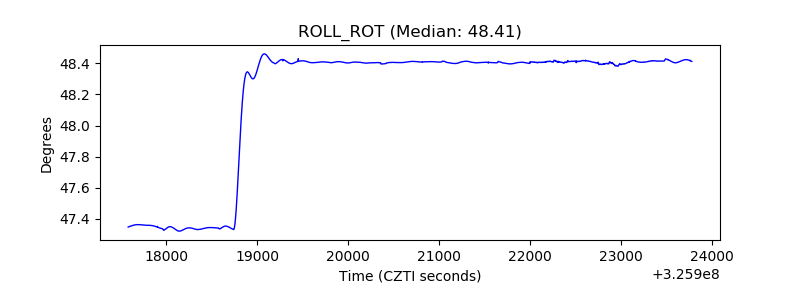 |
| _Roll_DEC | 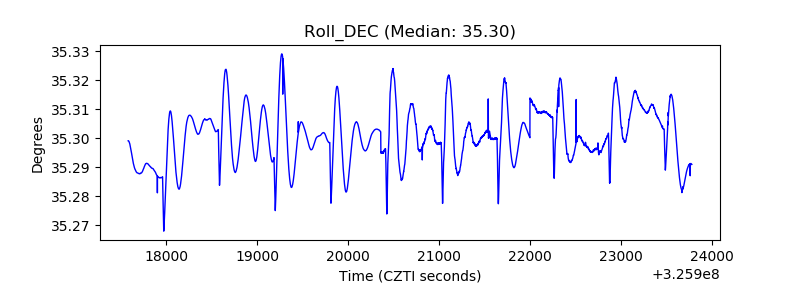 |
| _Roll_RA | 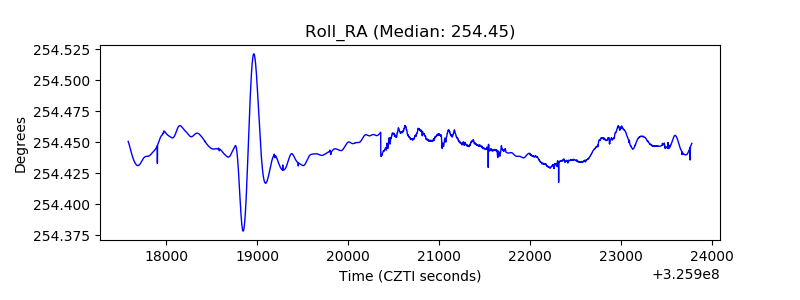 |
| Veto Counter | 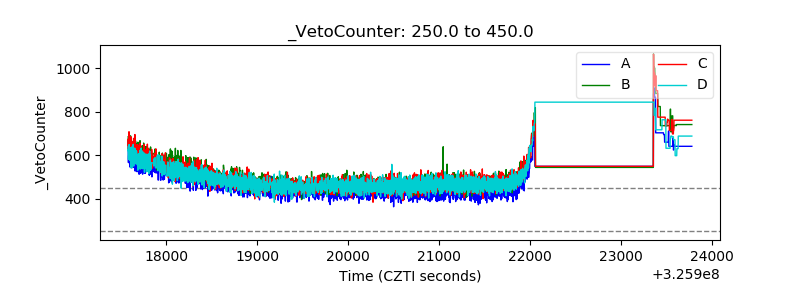 |