| Param | Original file | Final file |
|---|---|---|
| Filename | modeM0/AS1T03_197T01_9000003626_24810cztM0_level2.evt | modeM0/AS1T03_197T01_9000003626_24810cztM0_level2_quad_clean.evt |
| Size (bytes) | 777,496,320 | 135,967,680 |
| Size | 741.5 MB | 129.7 MB |
| Events in quadrant A | 5,467,750 | 872,016 |
| Events in quadrant B | 5,896,114 | 871,015 |
| Events in quadrant C | 5,474,894 | 827,997 |
| Events in quadrant D | 5,996,887 | 819,323 |
| Mode M9 | |||
|---|---|---|---|
| Quadrant | BADHDUFLAG | Total packets | Discarded packets |
| A | 0 | 26 | 0 |
| B | 0 | 26 | 0 |
| C | 0 | 26 | 0 |
| D | 0 | 26 | 0 |
| Mode SS | |||
|---|---|---|---|
| Quadrant | BADHDUFLAG | Total packets | Discarded packets |
| A | 0 | 214 | 0 |
| B | 0 | 214 | 0 |
| C | 0 | 214 | 0 |
| D | 0 | 214 | 0 |
| Mode M0 | |||
|---|---|---|---|
| Quadrant | BADHDUFLAG | Total packets | Discarded packets |
| A | 0 | 22067 | 2 |
| B | 0 | 23465 | 2 |
| C | 0 | 22300 | 2 |
| D | 0 | 24172 | 2 |
| Quadrant | Total seconds | Saturated seconds | Saturation percentage |
|---|---|---|---|
| A | 10504 | 119 | 1.132902% |
| B | 10504 | 256 | 2.437167% |
| C | 10504 | 161 | 1.532749% |
| D | 10504 | 118 | 1.123382% |
Noise dominated data is calculated using 1-second bins in cleaned event files. If a bin has >2000 counts, and if more than 50% of those come from <1% of pixels, then it is considered to be noise-dominated and hence unusable.
| Quadrant | # 1 sec bins | Bins with >0 counts | Bins with >2000 counts | High rate bins dominated by noise | Noise dominated (total time) | Noise dominated (detector-on time) | Marked lightcurve |
|---|---|---|---|---|---|---|---|
| A | 13064 | 10506 | 0 | 0 | 0.00% | 0.00% | 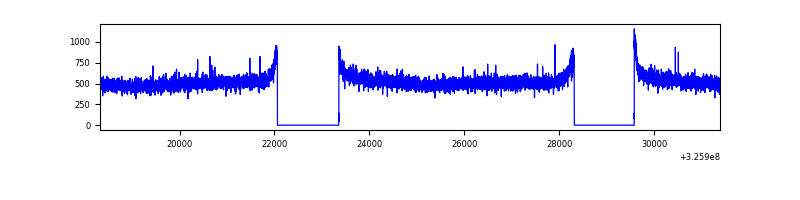 |
| B | 13064 | 10506 | 72 | 72 | 0.55% | 0.69% | 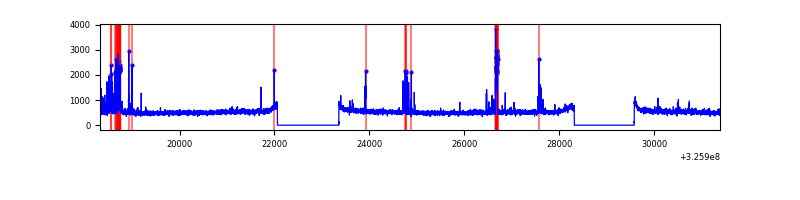 |
| C | 13064 | 10506 | 0 | 0 | 0.00% | 0.00% | 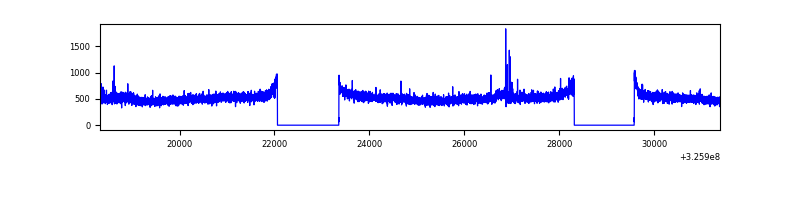 |
| D | 13064 | 10506 | 42 | 42 | 0.32% | 0.40% | 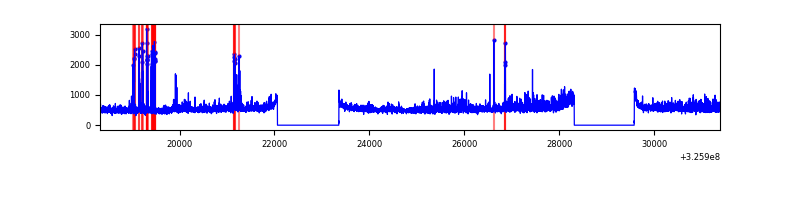 |
Top three noisy pixels from each quadrant. If the there are fewer than three noisy pixels in the level2.evt file, extra rows are filled as -1
| Pixel properties | Quadrant properties | ||||||
|---|---|---|---|---|---|---|---|
| Quadrant | DetID | PixID | Counts | Sigma | Mean | Median | Sigma |
| A | 13 | 254 | 15708 | 51.44 | 1419 | 1393 | 278.3 |
| A | 3 | 137 | 12286 | 39.14 | 1419 | 1393 | 278.3 |
| A | 0 | 226 | 12207 | 38.86 | 1419 | 1393 | 278.3 |
| B | 3 | 64 | 403175 | 1556.84 | 1385 | 1355 | 258.1 |
| B | 12 | 111 | 31388 | 116.36 | 1385 | 1355 | 258.1 |
| B | 4 | 80 | 29723 | 109.91 | 1385 | 1355 | 258.1 |
| C | 14 | 238 | 216441 | 709.08 | 1325 | 1333 | 303.4 |
| C | 10 | 218 | 42661 | 136.23 | 1325 | 1333 | 303.4 |
| C | 2 | 16 | 38955 | 124.02 | 1325 | 1333 | 303.4 |
| D | 8 | 195 | 621437 | 1919.55 | 1360 | 1322 | 323.1 |
| D | 1 | 52 | 230641 | 709.85 | 1360 | 1322 | 323.1 |
| D | 2 | 234 | 37367 | 111.58 | 1360 | 1322 | 323.1 |
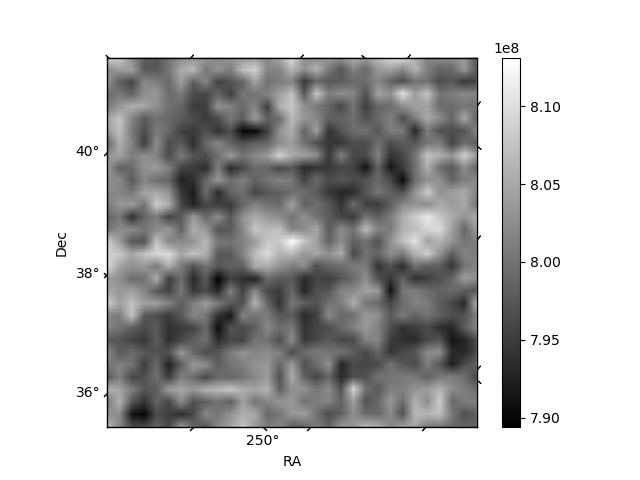
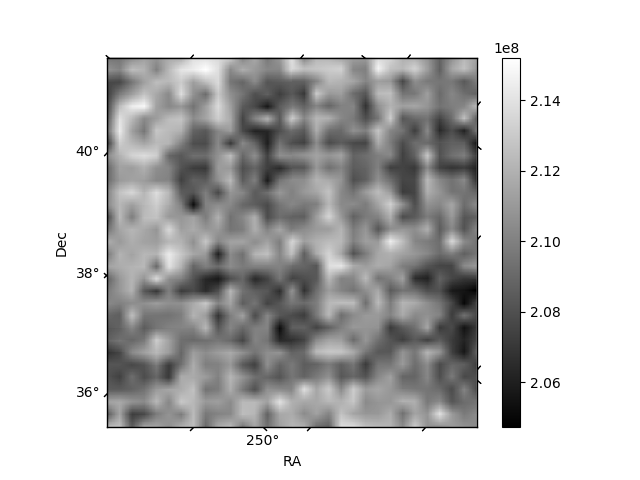
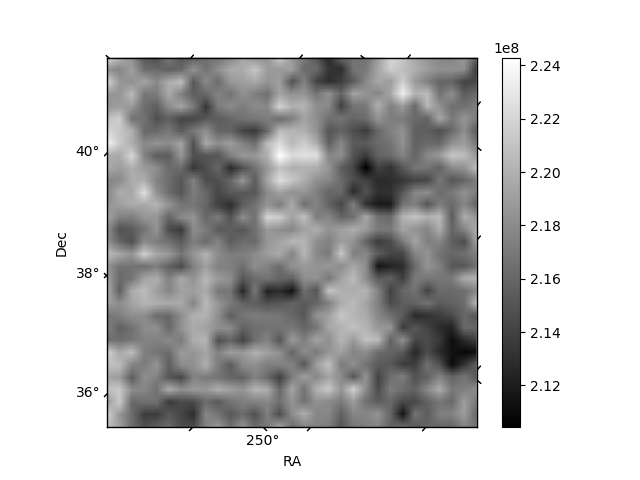
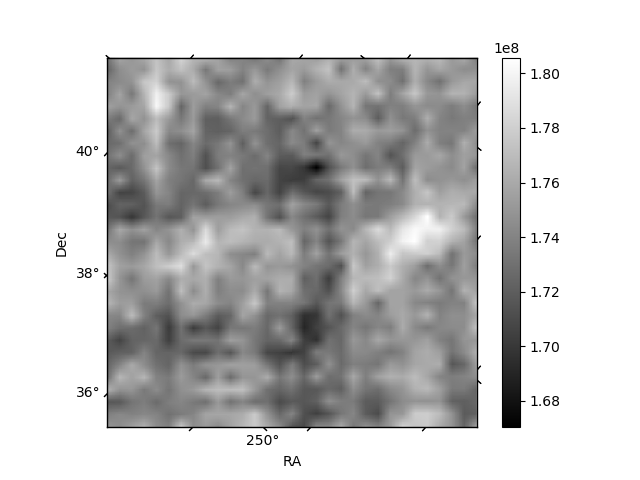
Histogram calculated using DETX and DETY for each event in the final _common_clean file
| Quadrant A | 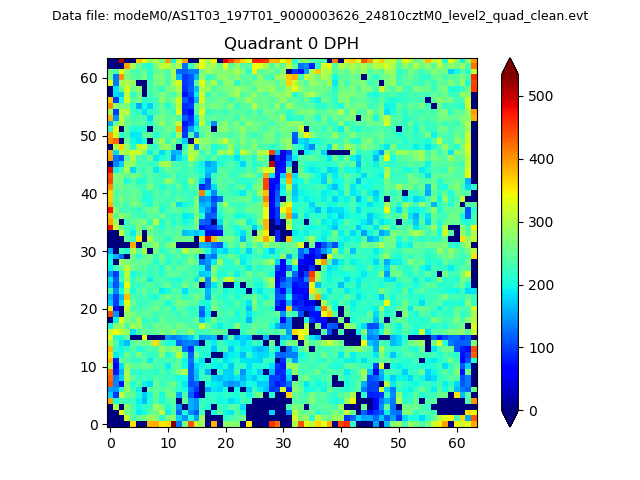 |
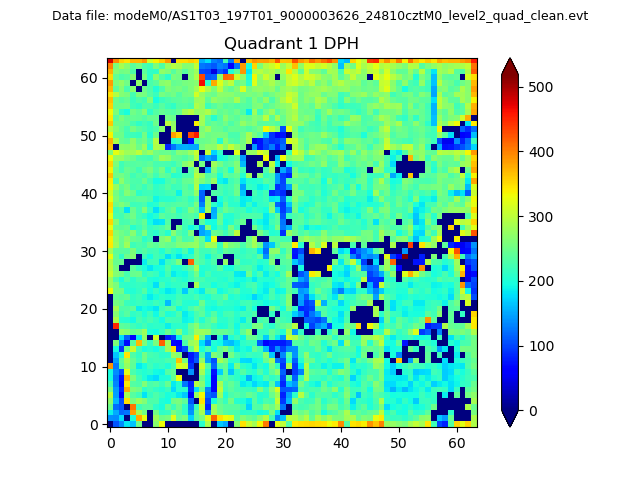 |
Quadrant B |
|---|---|---|---|
| Quadrant D | 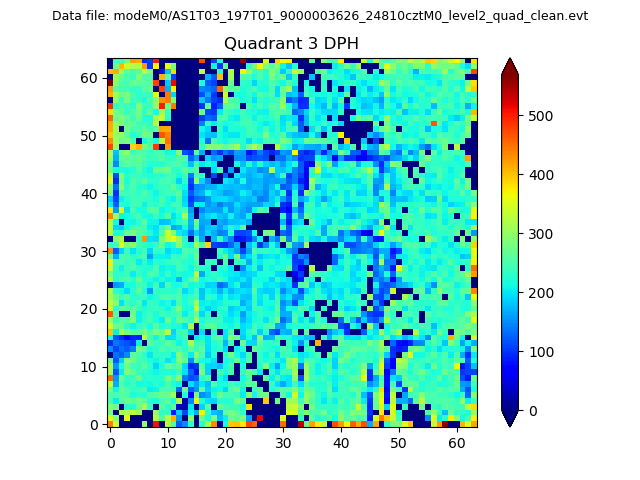 |
 |
Quadrant C |
| Plot type | Count rate plots | Images |
|---|---|---|
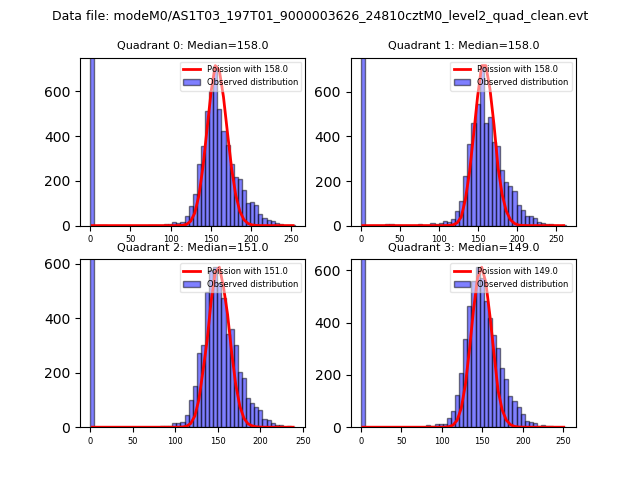
| Comparison with Poisson distribution Blue bars denote a histogram of data divided into 1 sec bins. Red curve is a Poisson curve with rate = median count rate of data. |
 |
 |
| Quadrant-wise count rates Data is divided into 100 sec bins |
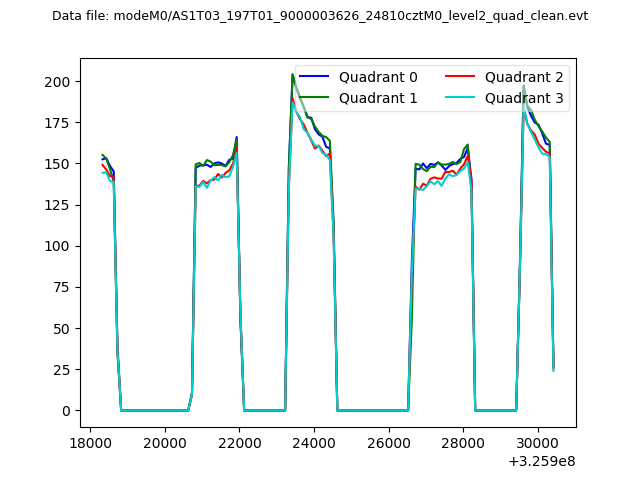 |
|
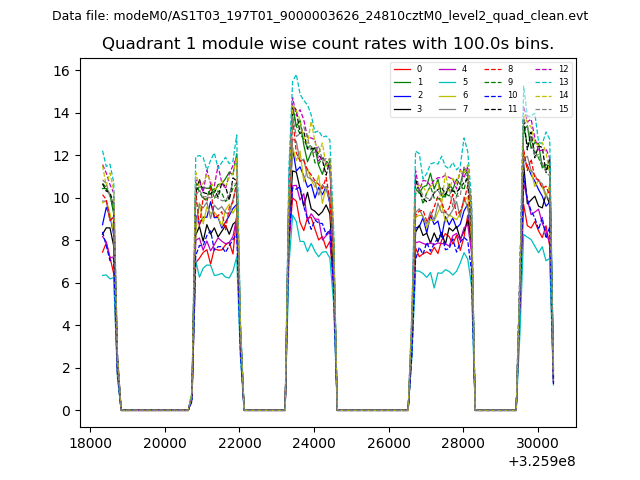
| Module-wise count rates for Quadrant A Data is divided into 100 sec bins |
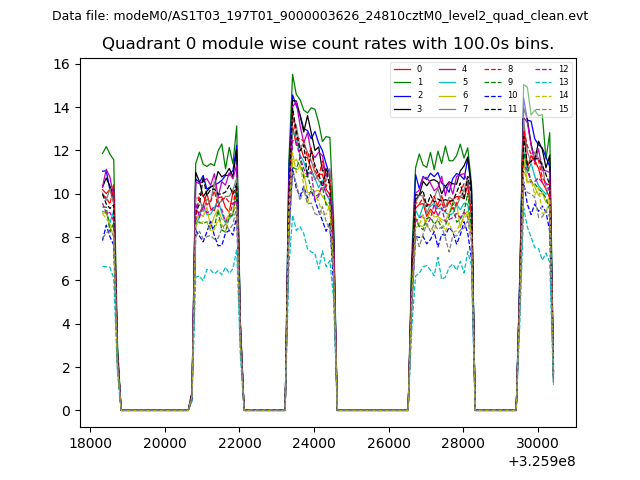 |
 |
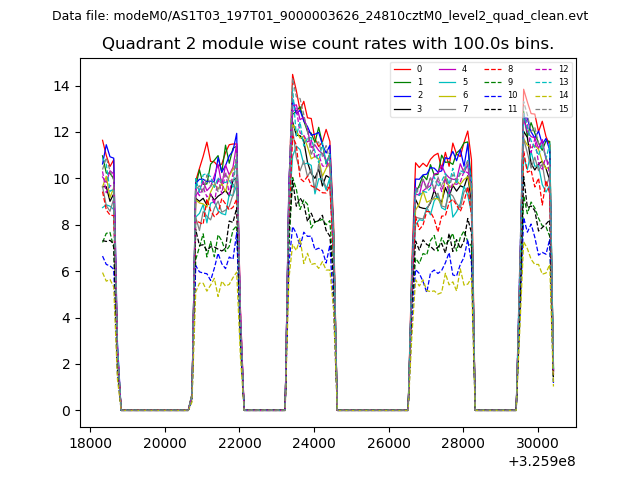
| Module-wise count rates for Quadrant B Data is divided into 100 sec bins |
 |
 |
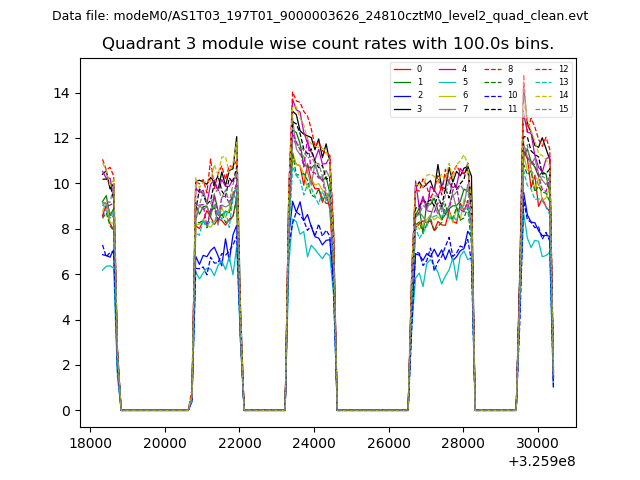
| Module-wise count rates for Quadrant C Data is divided into 100 sec bins |
 |
 |
| Module-wise count rates for Quadrant D Data is divided into 100 sec bins |
 |
 |
| Parameter | Plot |
|---|---|
| CZT HV Monitor | 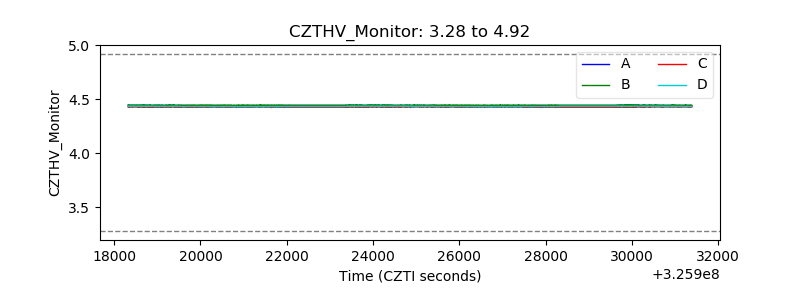 |
| D_VDD | 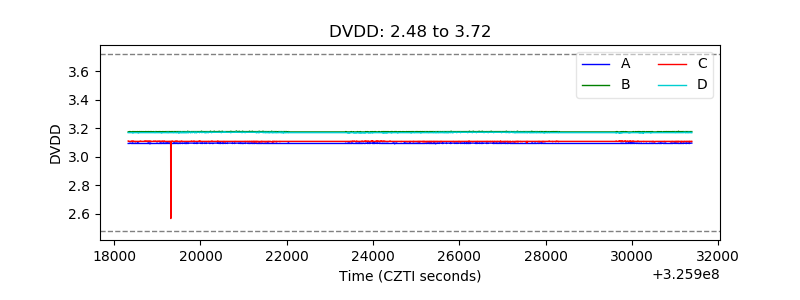 |
| Temperature 1 |  |
| Veto HV Monitor | 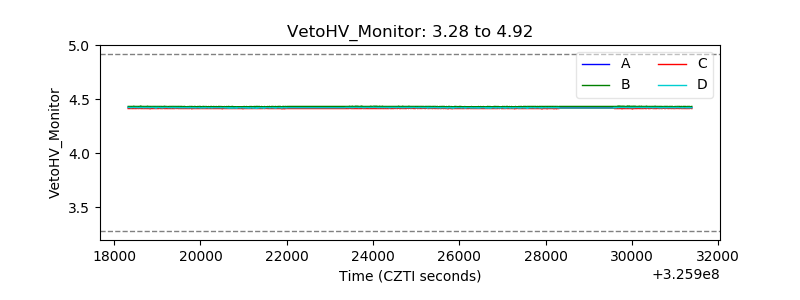 |
| Veto LLD | 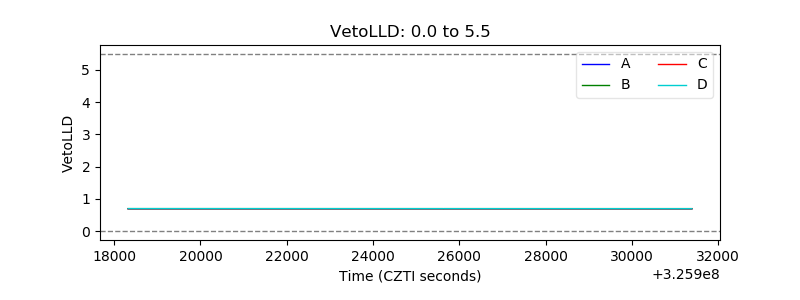 |
| Alpha Counter | 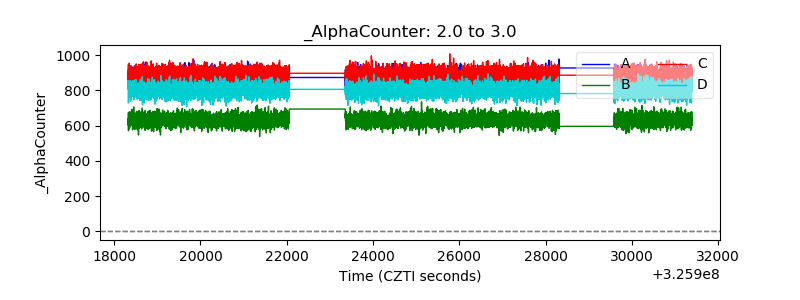 |
| _CPM_Rate | 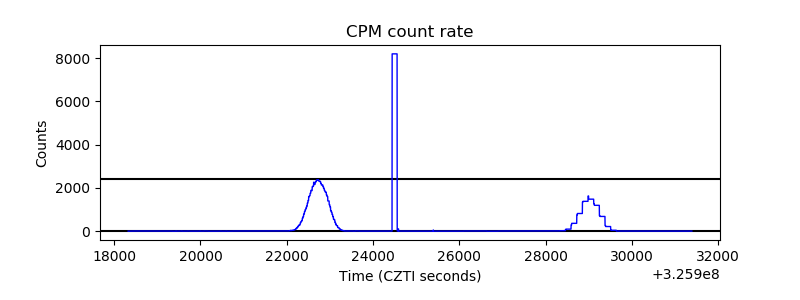 |
| CZT Counter |  |
| +2.5 Volts monitor | 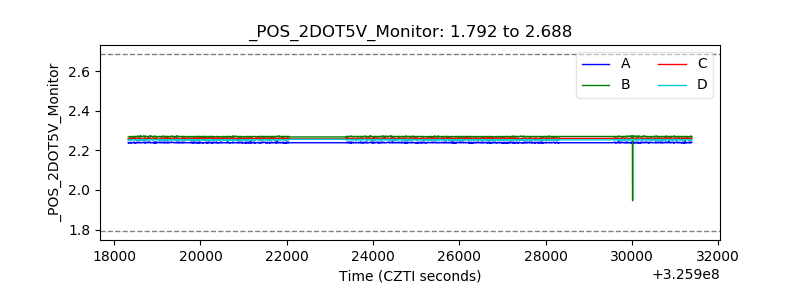 |
| +5 Volts monitor |  |
| _ROLL_ROT | 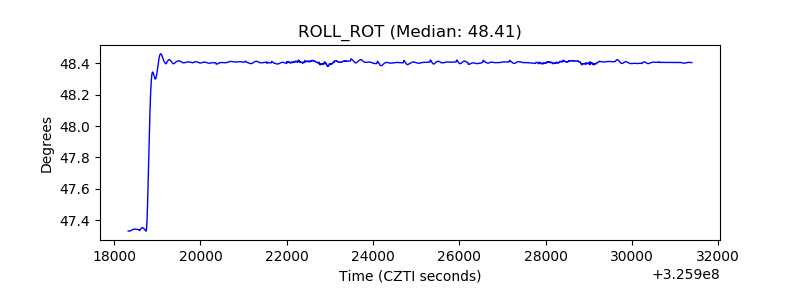 |
| _Roll_DEC | 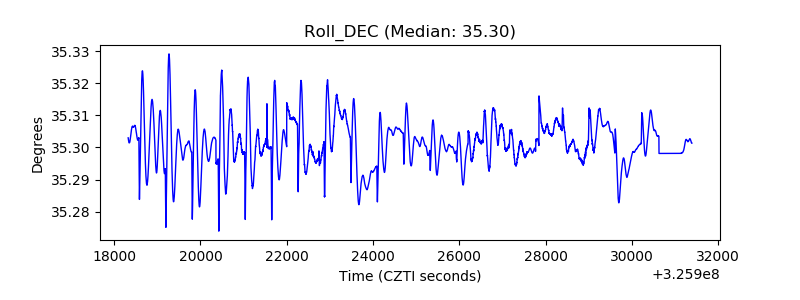 |
| _Roll_RA | 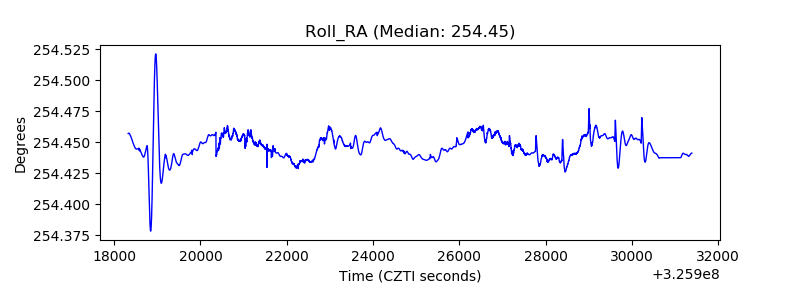 |
| Veto Counter | 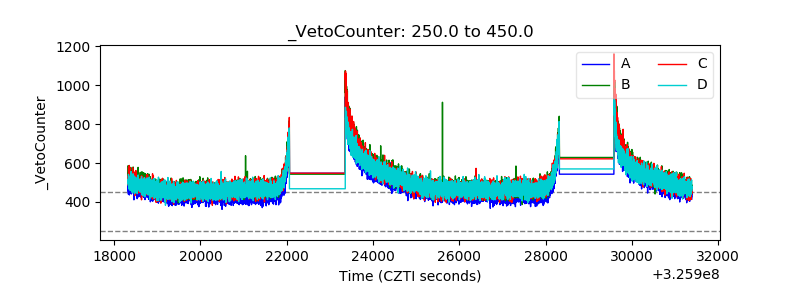 |