| Param | Original file | Final file |
|---|---|---|
| Filename | modeM0/AS1T03_197T01_9000003626_24813cztM0_level2.evt | modeM0/AS1T03_197T01_9000003626_24813cztM0_level2_quad_clean.evt |
| Size (bytes) | 520,557,120 | 80,844,480 |
| Size | 496.4 MB | 77.1 MB |
| Events in quadrant A | 3,629,007 | 492,916 |
| Events in quadrant B | 4,345,439 | 493,434 |
| Events in quadrant C | 3,591,846 | 477,049 |
| Events in quadrant D | 3,698,848 | 472,459 |
| Mode M9 | |||
|---|---|---|---|
| Quadrant | BADHDUFLAG | Total packets | Discarded packets |
| A | 0 | 6 | 0 |
| B | 0 | 7 | 0 |
| C | 0 | 7 | 0 |
| D | 0 | 7 | 0 |
| Mode SS | |||
|---|---|---|---|
| Quadrant | BADHDUFLAG | Total packets | Discarded packets |
| A | 0 | 152 | 0 |
| B | 0 | 150 | 0 |
| C | 0 | 150 | 0 |
| D | 0 | 150 | 0 |
| Mode M0 | |||
|---|---|---|---|
| Quadrant | BADHDUFLAG | Total packets | Discarded packets |
| A | 0 | 15328 | 2 |
| B | 0 | 17443 | 3 |
| C | 0 | 15192 | 2 |
| D | 0 | 15705 | 2 |
| Quadrant | Total seconds | Saturated seconds | Saturation percentage |
|---|---|---|---|
| A | 7354 | 195 | 2.651618% |
| B | 7353 | 519 | 7.058344% |
| C | 7353 | 222 | 3.019176% |
| D | 7353 | 180 | 2.447980% |
Noise dominated data is calculated using 1-second bins in cleaned event files. If a bin has >2000 counts, and if more than 50% of those come from <1% of pixels, then it is considered to be noise-dominated and hence unusable.
| Quadrant | # 1 sec bins | Bins with >0 counts | Bins with >2000 counts | High rate bins dominated by noise | Noise dominated (total time) | Noise dominated (detector-on time) | Marked lightcurve |
|---|---|---|---|---|---|---|---|
| A | 7814 | 7356 | 3 | 3 | 0.04% | 0.04% | 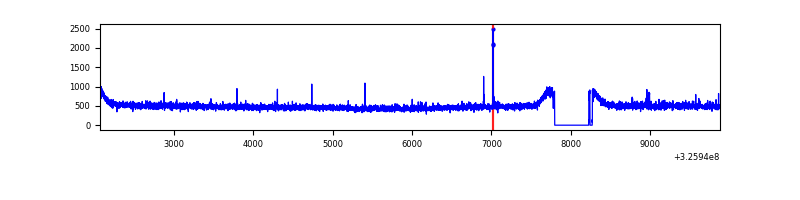 |
| B | 7813 | 7355 | 247 | 247 | 3.16% | 3.36% |  |
| C | 7813 | 7355 | 0 | 0 | 0.00% | 0.00% |  |
| D | 7813 | 7355 | 28 | 28 | 0.36% | 0.38% |  |
Top three noisy pixels from each quadrant. If the there are fewer than three noisy pixels in the level2.evt file, extra rows are filled as -1
| Pixel properties | Quadrant properties | ||||||
|---|---|---|---|---|---|---|---|
| Quadrant | DetID | PixID | Counts | Sigma | Mean | Median | Sigma |
| A | 12 | 96 | 15279 | 76.28 | 935 | 915 | 188.3 |
| A | 11 | 208 | 12336 | 60.66 | 935 | 915 | 188.3 |
| A | 13 | 254 | 11547 | 56.46 | 935 | 915 | 188.3 |
| B | 3 | 64 | 788575 | 4564.35 | 900 | 875 | 172.6 |
| B | 12 | 111 | 21815 | 121.34 | 900 | 875 | 172.6 |
| B | 11 | 111 | 19881 | 110.13 | 900 | 875 | 172.6 |
| C | 14 | 238 | 138730 | 669.27 | 882 | 886 | 206.0 |
| C | 7 | 247 | 13986 | 63.6 | 882 | 886 | 206.0 |
| C | 13 | 61 | 6179 | 25.7 | 882 | 886 | 206.0 |
| D | 8 | 195 | 173151 | 785.44 | 903 | 876 | 219.3 |
| D | 2 | 120 | 66803 | 300.57 | 903 | 876 | 219.3 |
| D | 1 | 52 | 30168 | 133.55 | 903 | 876 | 219.3 |
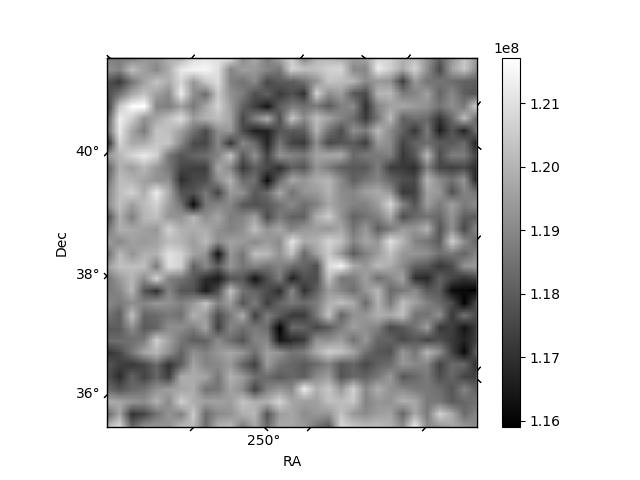
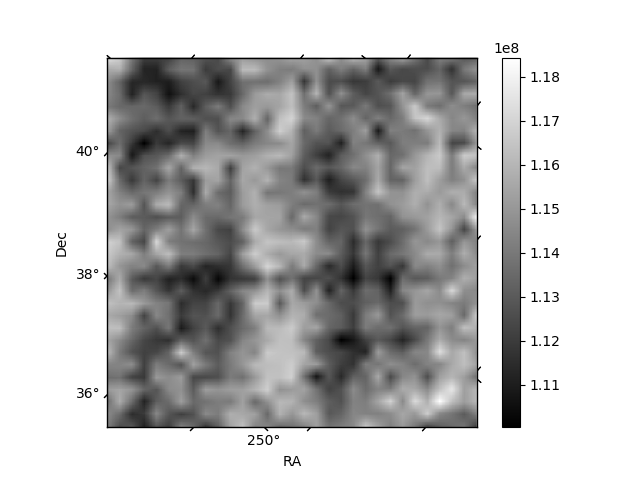
Histogram calculated using DETX and DETY for each event in the final _common_clean file
| Quadrant A |  |
 |
Quadrant B |
|---|---|---|---|
| Quadrant D |  |
 |
Quadrant C |
| Plot type | Count rate plots | Images |
|---|---|---|
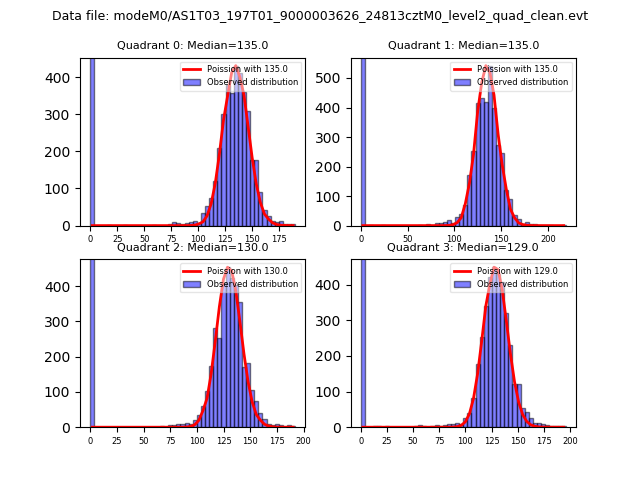
| Comparison with Poisson distribution Blue bars denote a histogram of data divided into 1 sec bins. Red curve is a Poisson curve with rate = median count rate of data. |
 |
 |
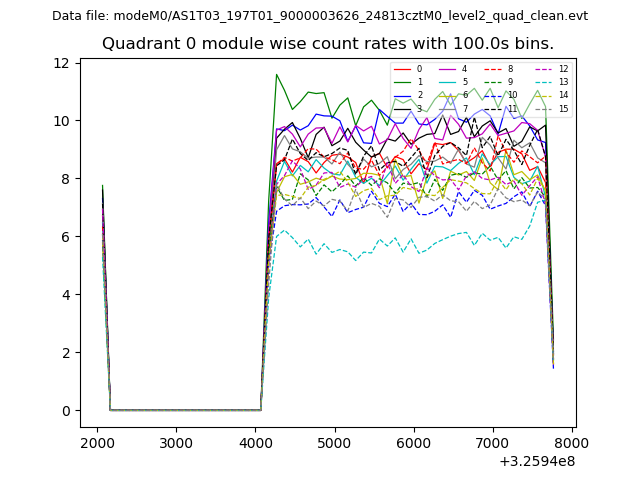
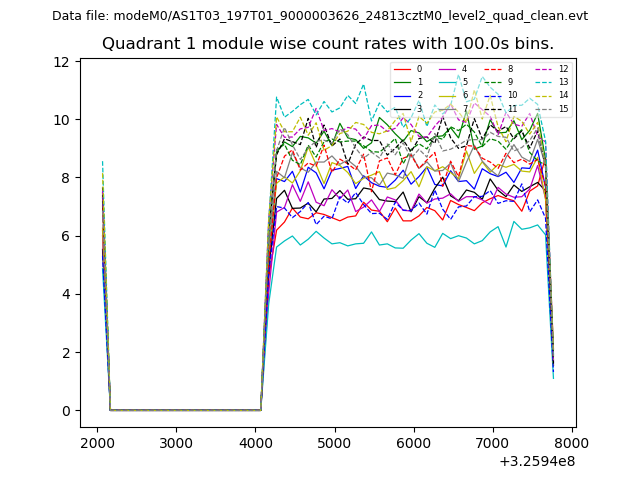
| Quadrant-wise count rates Data is divided into 100 sec bins |
 |
|
| Module-wise count rates for Quadrant A Data is divided into 100 sec bins |
 |
 |
| Module-wise count rates for Quadrant B Data is divided into 100 sec bins |
 |
 |
| Module-wise count rates for Quadrant C Data is divided into 100 sec bins |
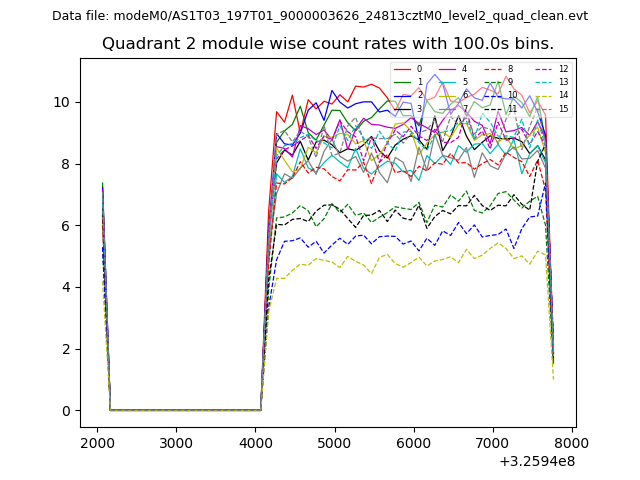 |
 |
| Module-wise count rates for Quadrant D Data is divided into 100 sec bins |
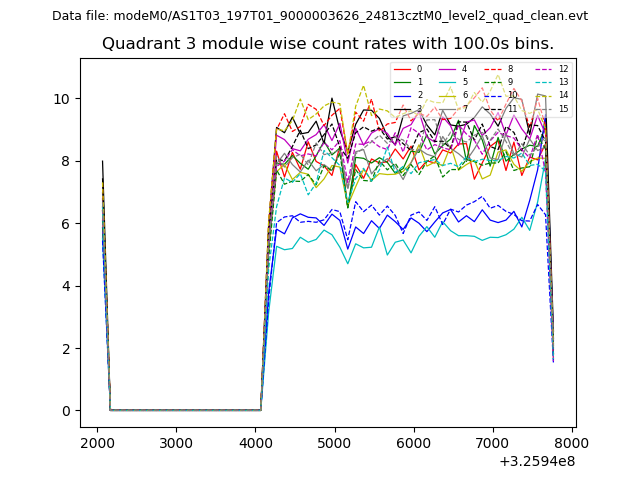 |
 |
| Parameter | Plot |
|---|---|
| CZT HV Monitor | 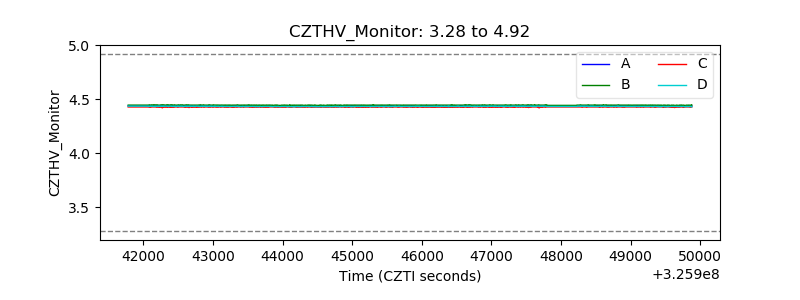 |
| D_VDD | 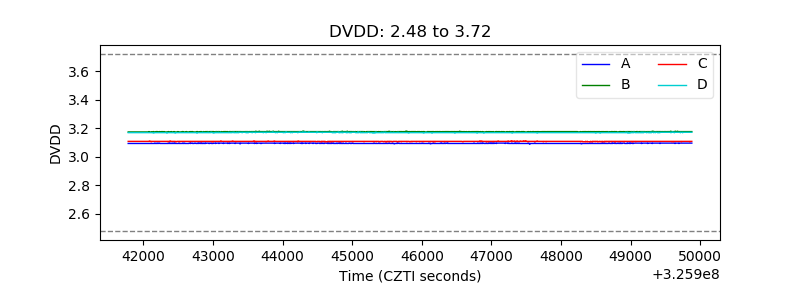 |
| Temperature 1 | 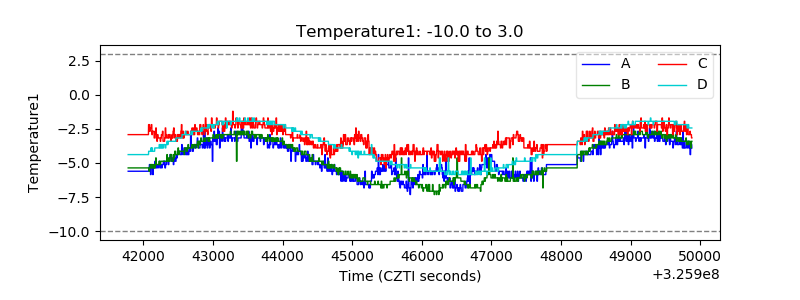 |
| Veto HV Monitor | 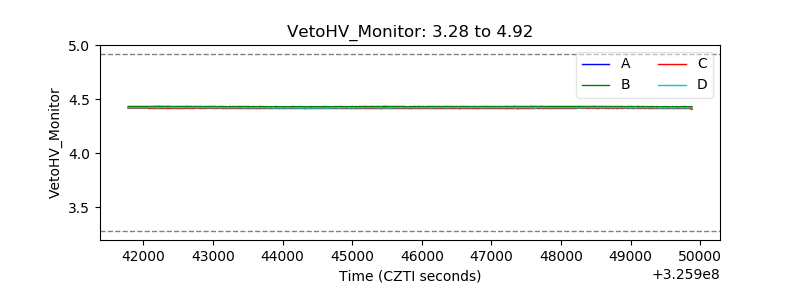 |
| Veto LLD | 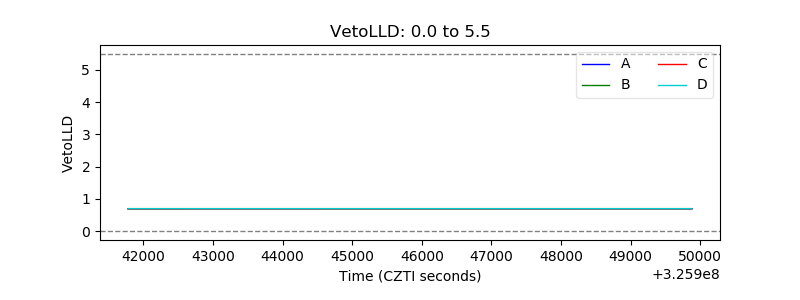 |
| Alpha Counter | 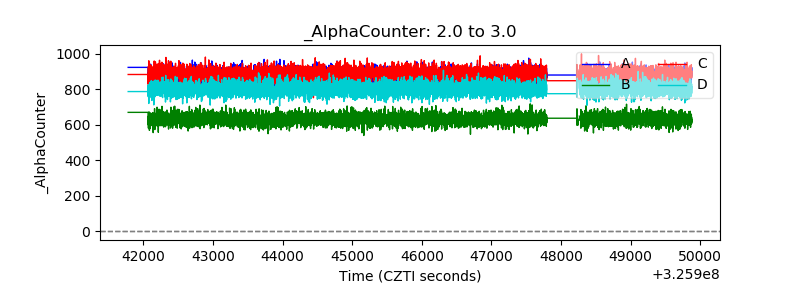 |
| _CPM_Rate | 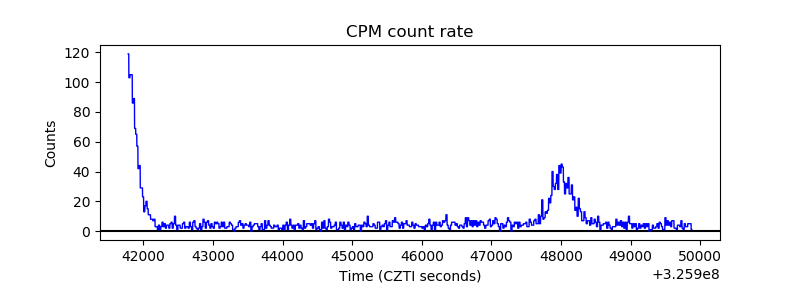 |
| CZT Counter |  |
| +2.5 Volts monitor |  |
| +5 Volts monitor |  |
| _ROLL_ROT | 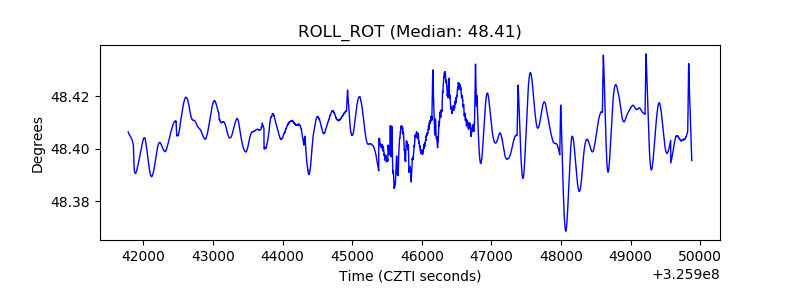 |
| _Roll_DEC | 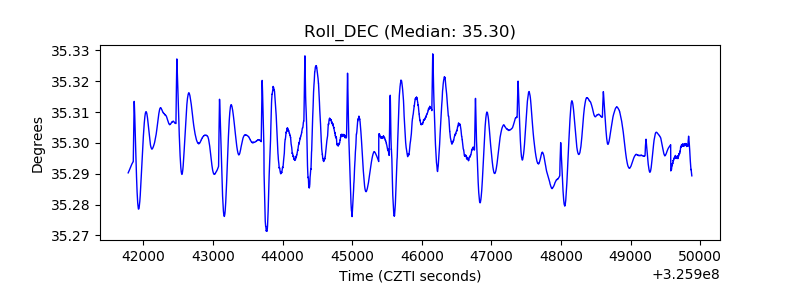 |
| _Roll_RA |  |
| Veto Counter | 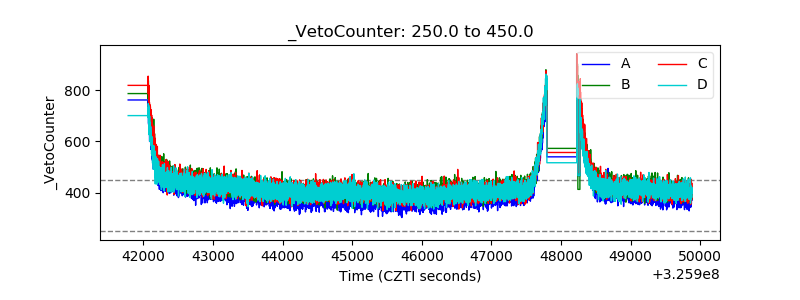 |