| Param | Original file | Final file |
|---|---|---|
| Filename | modeM0/AS1T03_197T01_9000003626_24814cztM0_level2.evt | modeM0/AS1T03_197T01_9000003626_24814cztM0_level2_quad_clean.evt |
| Size (bytes) | 516,772,800 | 85,417,920 |
| Size | 492.8 MB | 81.5 MB |
| Events in quadrant A | 3,701,908 | 524,696 |
| Events in quadrant B | 3,761,267 | 524,931 |
| Events in quadrant C | 3,761,504 | 505,587 |
| Events in quadrant D | 3,908,455 | 501,568 |
| Mode M9 | |||
|---|---|---|---|
| Quadrant | BADHDUFLAG | Total packets | Discarded packets |
| A | 0 | 4 | 0 |
| B | 0 | 5 | 0 |
| C | 0 | 5 | 0 |
| D | 0 | 5 | 0 |
| Mode SS | |||
|---|---|---|---|
| Quadrant | BADHDUFLAG | Total packets | Discarded packets |
| A | 0 | 156 | 0 |
| B | 0 | 156 | 0 |
| C | 0 | 156 | 0 |
| D | 0 | 156 | 0 |
| Mode M0 | |||
|---|---|---|---|
| Quadrant | BADHDUFLAG | Total packets | Discarded packets |
| A | 0 | 15842 | 2 |
| B | 0 | 15953 | 2 |
| C | 0 | 15851 | 2 |
| D | 0 | 16416 | 2 |
| Quadrant | Total seconds | Saturated seconds | Saturation percentage |
|---|---|---|---|
| A | 7609 | 192 | 2.523328% |
| B | 7609 | 213 | 2.799317% |
| C | 7609 | 233 | 3.062163% |
| D | 7609 | 169 | 2.221054% |
Noise dominated data is calculated using 1-second bins in cleaned event files. If a bin has >2000 counts, and if more than 50% of those come from <1% of pixels, then it is considered to be noise-dominated and hence unusable.
| Quadrant | # 1 sec bins | Bins with >0 counts | Bins with >2000 counts | High rate bins dominated by noise | Noise dominated (total time) | Noise dominated (detector-on time) | Marked lightcurve |
|---|---|---|---|---|---|---|---|
| A | 7904 | 7611 | 4 | 4 | 0.05% | 0.05% | 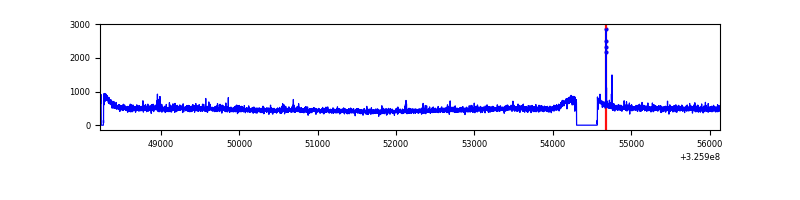 |
| B | 7904 | 7611 | 1 | 1 | 0.01% | 0.01% | 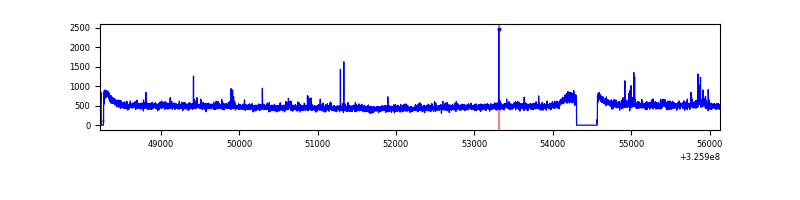 |
| C | 7904 | 7611 | 1 | 1 | 0.01% | 0.01% | 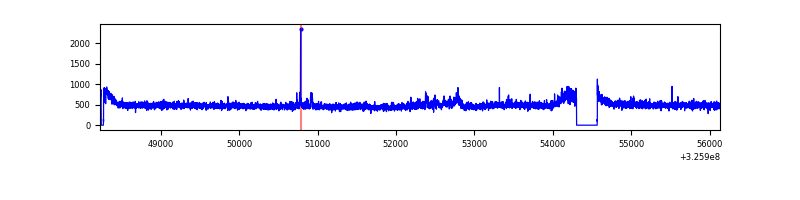 |
| D | 7904 | 7611 | 9 | 9 | 0.11% | 0.12% | 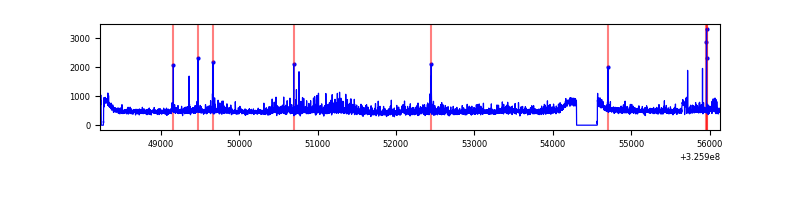 |
Top three noisy pixels from each quadrant. If the there are fewer than three noisy pixels in the level2.evt file, extra rows are filled as -1
| Pixel properties | Quadrant properties | ||||||
|---|---|---|---|---|---|---|---|
| Quadrant | DetID | PixID | Counts | Sigma | Mean | Median | Sigma |
| A | 12 | 96 | 26955 | 135.42 | 950 | 930 | 192.2 |
| A | 11 | 208 | 14119 | 68.63 | 950 | 930 | 192.2 |
| A | 13 | 254 | 11526 | 55.14 | 950 | 930 | 192.2 |
| B | 3 | 64 | 33511 | 180.07 | 937 | 910 | 181.1 |
| B | 12 | 111 | 22819 | 121.01 | 937 | 910 | 181.1 |
| B | 11 | 111 | 20634 | 108.94 | 937 | 910 | 181.1 |
| C | 14 | 238 | 140954 | 667.9 | 899 | 902 | 209.7 |
| C | 7 | 247 | 78770 | 371.35 | 899 | 902 | 209.7 |
| C | 3 | 233 | 22300 | 102.05 | 899 | 902 | 209.7 |
| D | 8 | 195 | 366710 | 1633.96 | 919 | 889 | 223.9 |
| D | 1 | 52 | 42176 | 184.41 | 919 | 889 | 223.9 |
| D | 2 | 234 | 29872 | 129.45 | 919 | 889 | 223.9 |
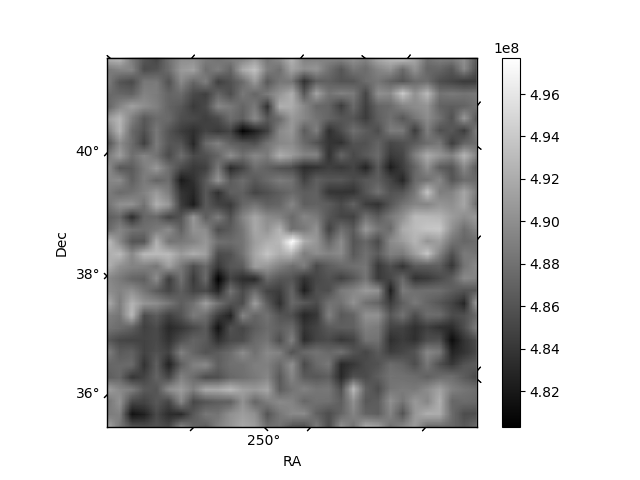
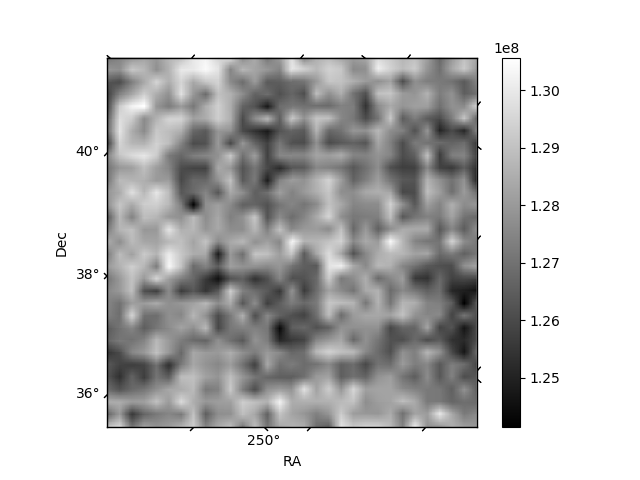
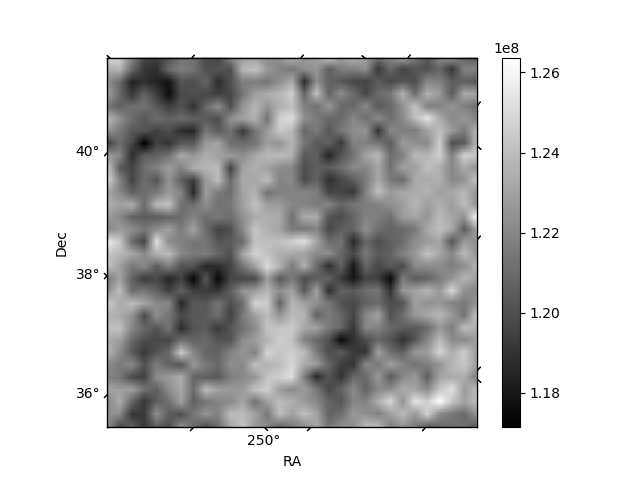
Histogram calculated using DETX and DETY for each event in the final _common_clean file
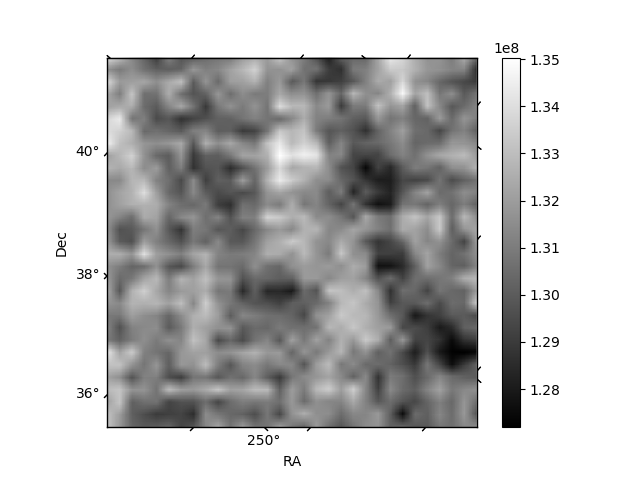
| Quadrant A | 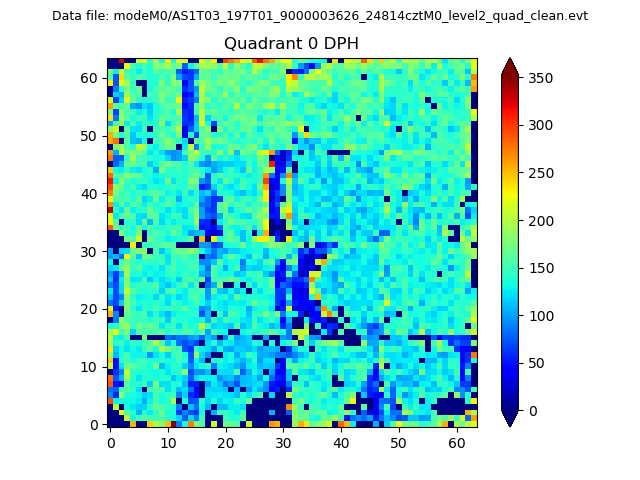 |
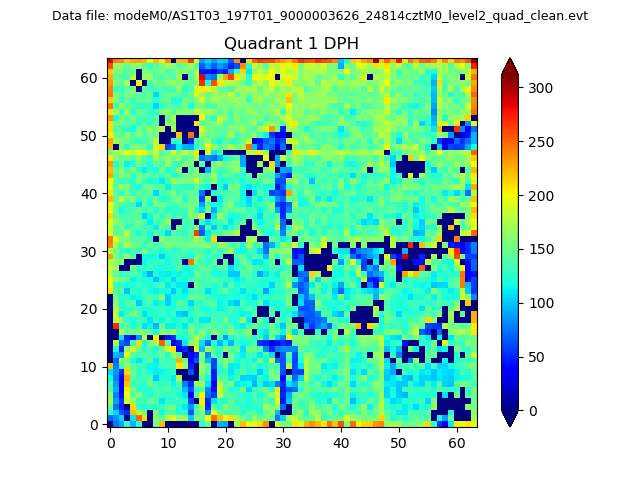 |
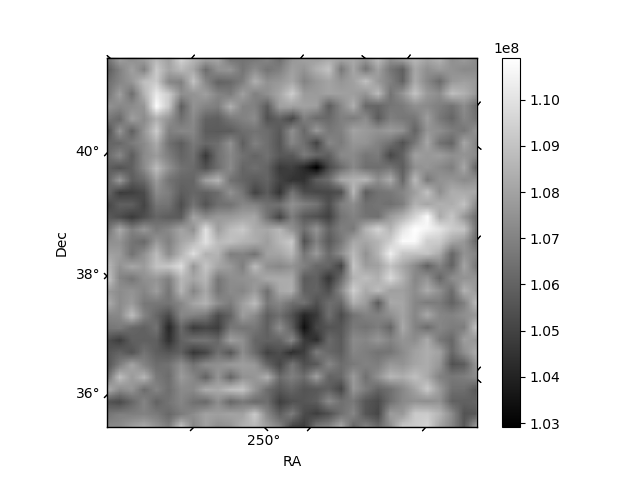
Quadrant B |
|---|---|---|---|
| Quadrant D | 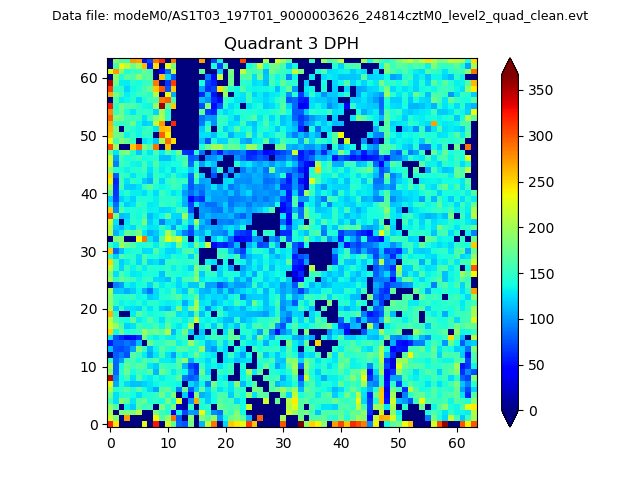 |
 |
Quadrant C |
| Plot type | Count rate plots | Images |
|---|---|---|
| Comparison with Poisson distribution Blue bars denote a histogram of data divided into 1 sec bins. Red curve is a Poisson curve with rate = median count rate of data. |
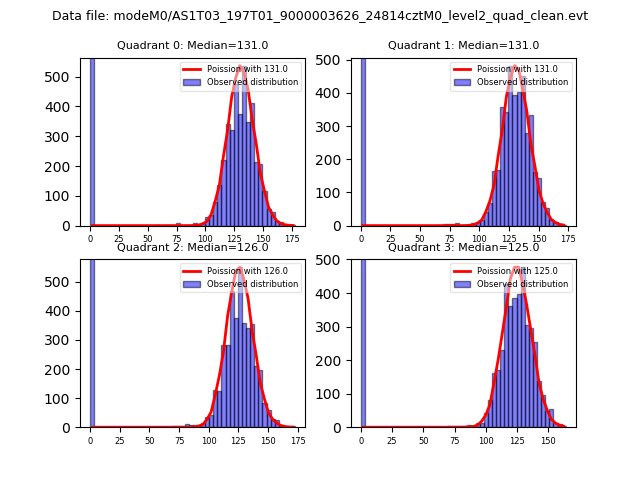 |
 |
| Quadrant-wise count rates Data is divided into 100 sec bins |
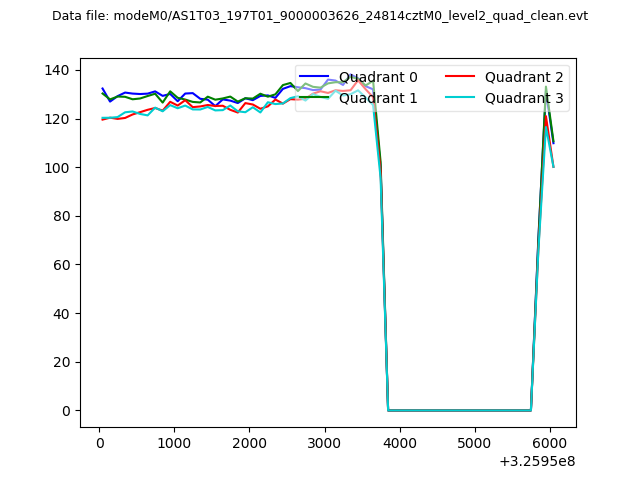 |
|
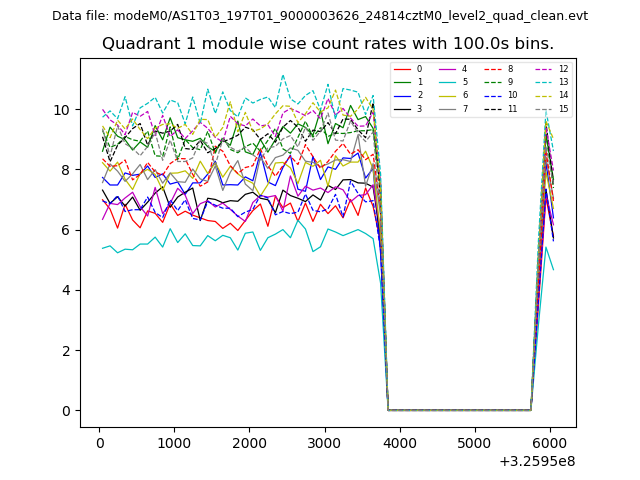
| Module-wise count rates for Quadrant A Data is divided into 100 sec bins |
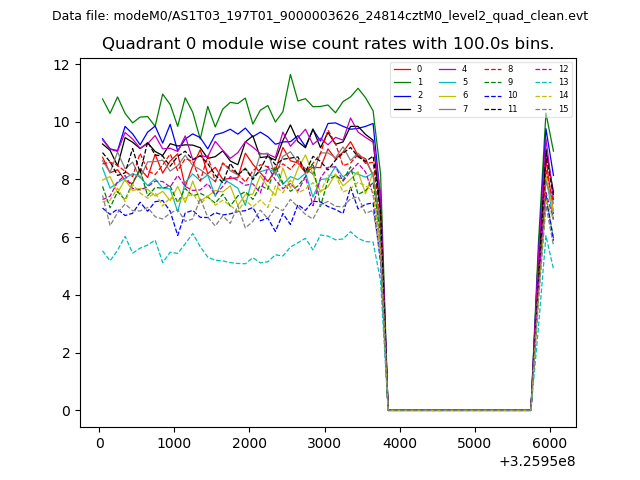 |
 |
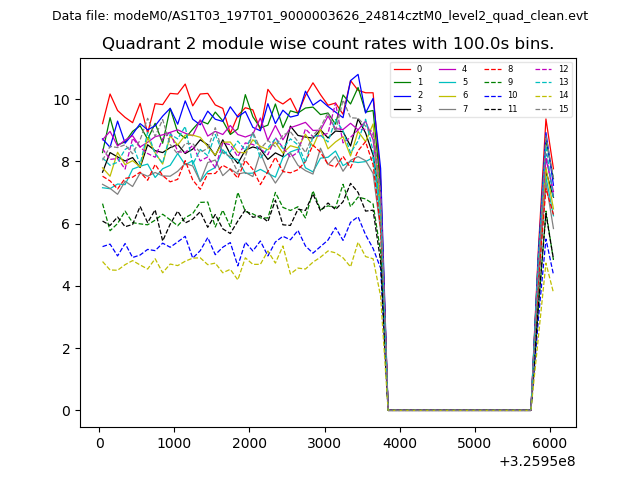
| Module-wise count rates for Quadrant B Data is divided into 100 sec bins |
 |
 |
| Module-wise count rates for Quadrant C Data is divided into 100 sec bins |
 |
 |
| Module-wise count rates for Quadrant D Data is divided into 100 sec bins |
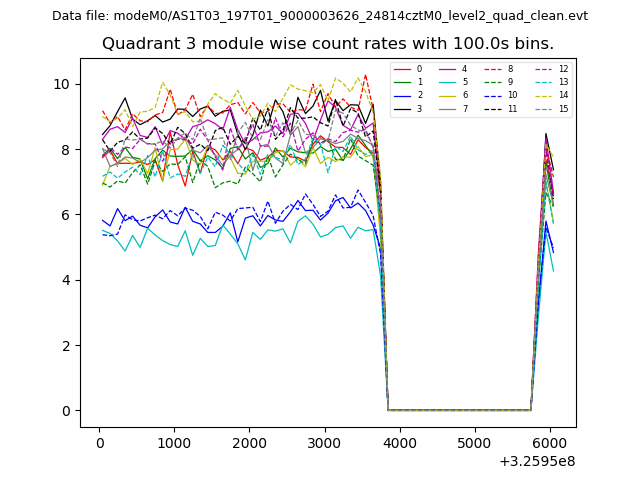 |
 |
| Parameter | Plot |
|---|---|
| CZT HV Monitor | 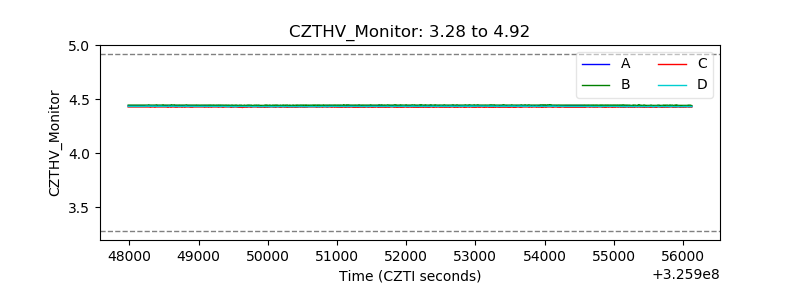 |
| D_VDD | 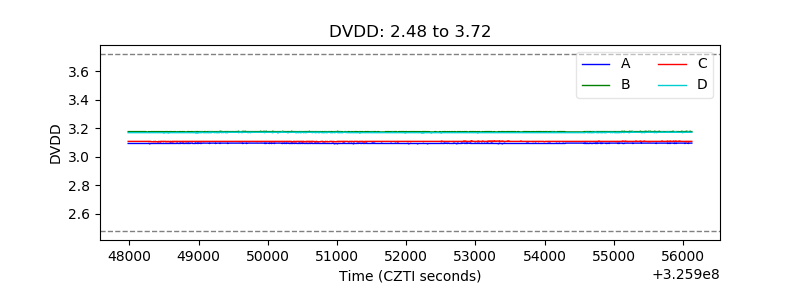 |
| Temperature 1 | 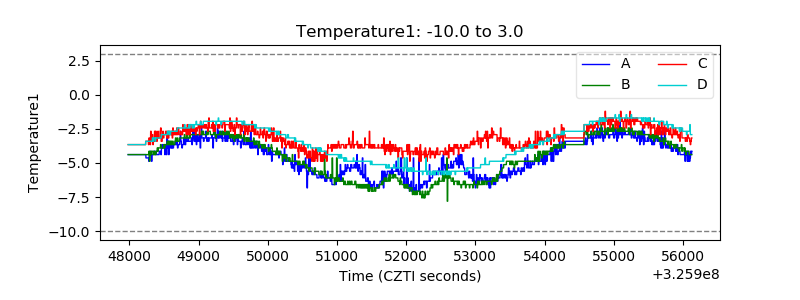 |
| Veto HV Monitor | 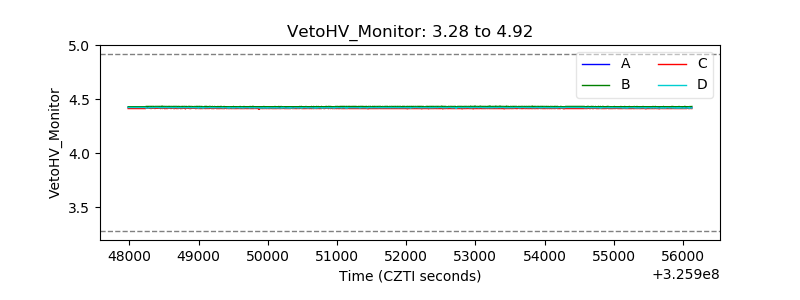 |
| Veto LLD | 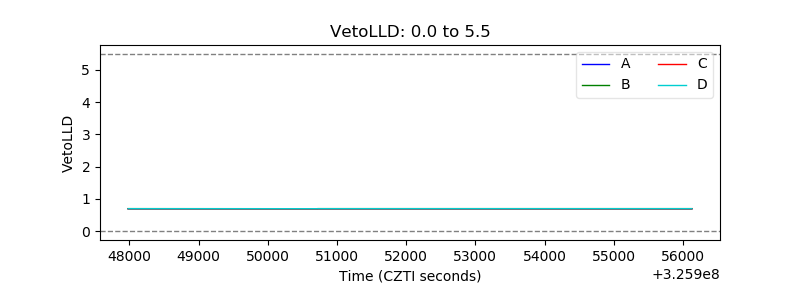 |
| Alpha Counter |  |
| _CPM_Rate | 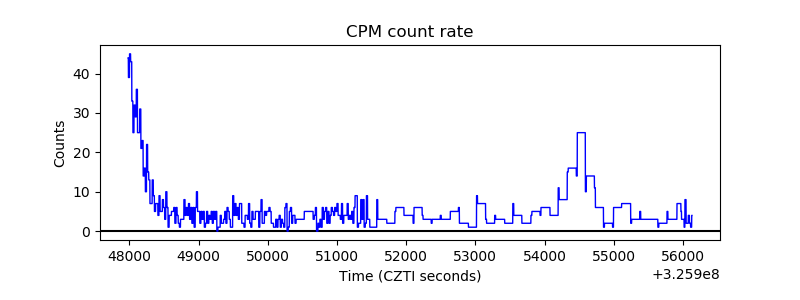 |
| CZT Counter |  |
| +2.5 Volts monitor |  |
| +5 Volts monitor |  |
| _ROLL_ROT | 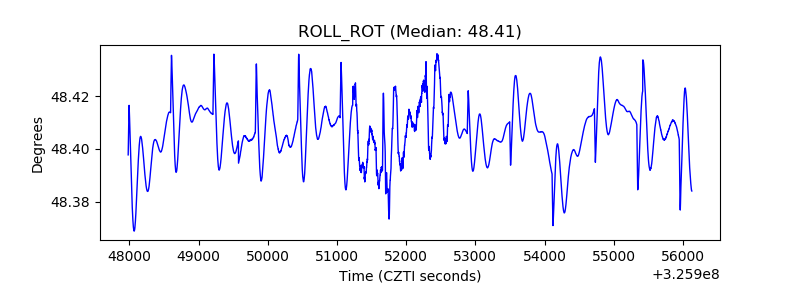 |
| _Roll_DEC | 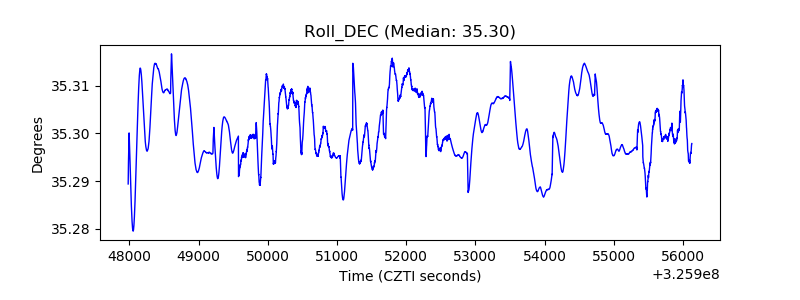 |
| _Roll_RA | 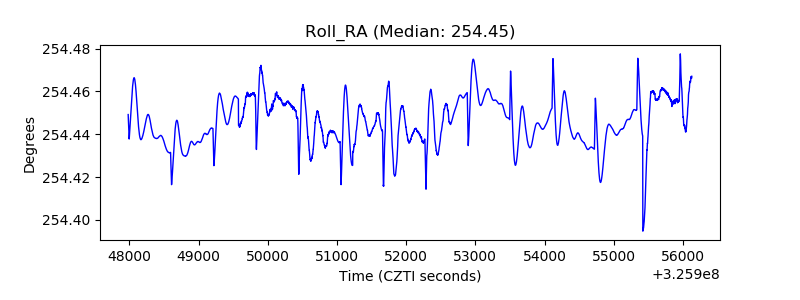 |
| Veto Counter | 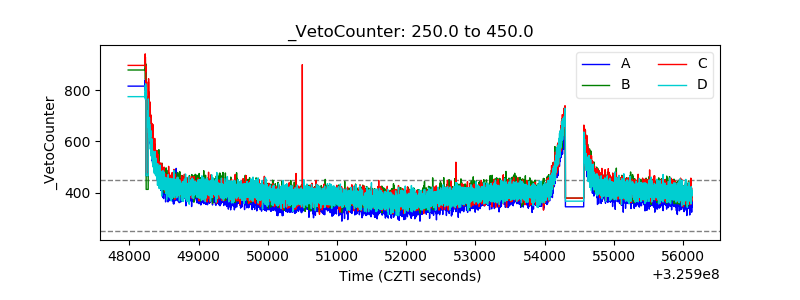 |