| Param | Original file | Final file |
|---|---|---|
| Filename | modeM0/AS1A07_045T01_9000003628cztM0_level2.fits | modeM0/AS1A07_045T01_9000003628cztM0_level2_quad_clean.evt |
| Size (bytes) | 548,608,320 | 389,666,880 |
| Size | 523.2 MB | 371.6 MB |
| Events in quadrant A | 3,474,482 | 2,159,007 |
| Events in quadrant B | 3,293,126 | 2,150,949 |
| Events in quadrant C | 3,294,804 | 1,996,522 |
| Events in quadrant D | 2,920,934 | 1,860,204 |
| Mode M9 | |||
|---|---|---|---|
| Quadrant | BADHDUFLAG | Total packets | Discarded packets |
| A | 0 | 103 | 0 |
| B | 0 | 103 | 0 |
| C | 0 | 103 | 0 |
| D | 0 | 103 | 0 |
| Mode M0 | |||
|---|---|---|---|
| Quadrant | BADHDUFLAG | Total packets | Discarded packets |
| A | 0 | 110459 | 0 |
| B | 0 | 121326 | 0 |
| C | 0 | 117605 | 0 |
| D | 0 | 119363 | 0 |
| Mode SS | |||
|---|---|---|---|
| Quadrant | BADHDUFLAG | Total packets | Discarded packets |
| A | 0 | 1076 | 0 |
| B | 0 | 1076 | 0 |
| C | 0 | 1076 | 0 |
| D | 0 | 1076 | 0 |
| Quadrant | Total seconds | Saturated seconds | Saturation percentage |
|---|---|---|---|
| A | 52941 | 562 | 1.061559% |
| B | 52941 | 1360 | 2.568897% |
| C | 52941 | 1111 | 2.098563% |
| D | 52940 | 488 | 0.921798% |
Noise dominated data is calculated using 1-second bins in cleaned event files. If a bin has >2000 counts, and if more than 50% of those come from <1% of pixels, then it is considered to be noise-dominated and hence unusable.
| Quadrant | # 1 sec bins | Bins with >0 counts | Bins with >2000 counts | High rate bins dominated by noise | Noise dominated (total time) | Noise dominated (detector-on time) | Marked lightcurve |
|---|---|---|---|---|---|---|---|
| A | 63086 | 52940 | 0 | 0 | 0.00% | 0.00% |  |
| B | 63086 | 52933 | 0 | 0 | 0.00% | 0.00% |  |
| C | 63086 | 52924 | 0 | 0 | 0.00% | 0.00% |  |
| D | 63086 | 52940 | 0 | 0 | 0.00% | 0.00% |  |
Top three noisy pixels from each quadrant. If the there are fewer than three noisy pixels in the level2.evt file, extra rows are filled as -1
| Pixel properties | Quadrant properties | ||||||
|---|---|---|---|---|---|---|---|
| Quadrant | DetID | PixID | Counts | Sigma | Mean | Median | Sigma |
| A | 0 | 29 | 3291 | 11.23 | 903 | 852 | 217.2 |
| A | 7 | 110 | 2716 | 8.58 | 903 | 852 | 217.2 |
| A | 0 | 30 | 2545 | 7.8 | 903 | 852 | 217.2 |
| B | 2 | 9 | 2618 | 10.49 | 869 | 832 | 170.2 |
| B | 5 | 232 | 2169 | 7.86 | 869 | 832 | 170.2 |
| B | 5 | 225 | 2151 | 7.75 | 869 | 832 | 170.2 |
| C | 1 | 80 | 2467 | 7.4 | 869 | 813 | 223.5 |
| C | 1 | 81 | 2445 | 7.3 | 869 | 813 | 223.5 |
| C | 3 | 234 | 2306 | 6.68 | 869 | 813 | 223.5 |
| D | 3 | 14 | 2119 | 6.16 | 832 | 756 | 221.4 |
| D | 10 | 189 | 2060 | 5.89 | 832 | 756 | 221.4 |
| D | 7 | 3 | 2043 | 5.81 | 832 | 756 | 221.4 |
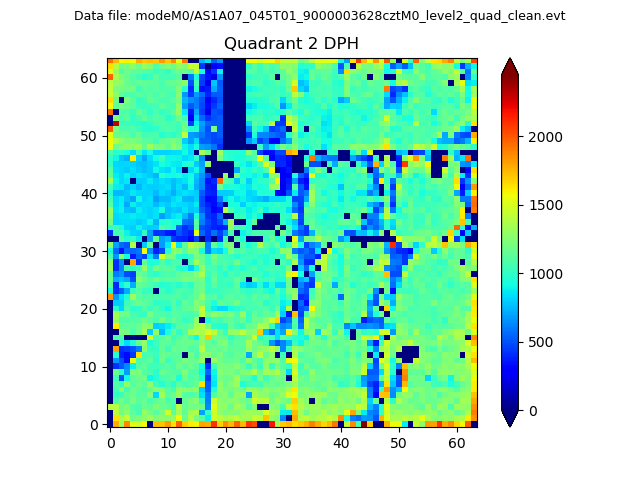
Histogram calculated using DETX and DETY for each event in the final _common_clean file
| Quadrant A |  |
 |
Quadrant B |
|---|---|---|---|
| Quadrant D |  |
 |
Quadrant C |
| Plot type | Count rate plots | Images |
|---|---|---|
| Comparison with Poisson distribution Blue bars denote a histogram of data divided into 1 sec bins. Red curve is a Poisson curve with rate = median count rate of data. |
 |
 |
| Quadrant-wise count rates Data is divided into 100 sec bins |
 |
|
| Module-wise count rates for Quadrant A Data is divided into 100 sec bins |
 |
 |
| Module-wise count rates for Quadrant B Data is divided into 100 sec bins |
 |
 |
| Module-wise count rates for Quadrant C Data is divided into 100 sec bins |
 |
 |
| Module-wise count rates for Quadrant D Data is divided into 100 sec bins |
 |
 |
| Parameter | Plot |
|---|---|
| CZT HV Monitor |  |
| D_VDD |  |
| Temperature 1 |  |
| Veto HV Monitor |  |
| Veto LLD |  |
| Alpha Counter |  |
| _CPM_Rate |  |
| CZT Counter |  |
| +2.5 Volts monitor |  |
| +5 Volts monitor |  |
| _ROLL_ROT | 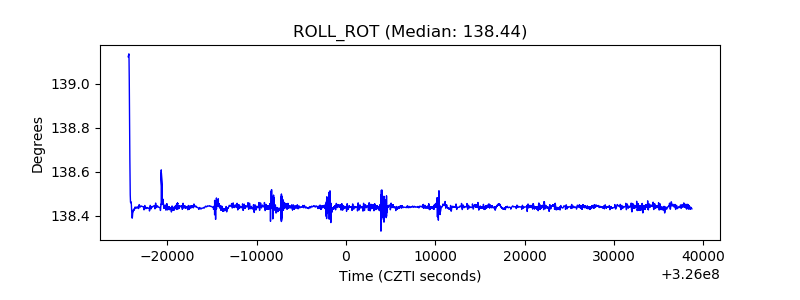 |
| _Roll_DEC |  |
| _Roll_RA |  |
| Veto Counter |  |