| Param | Original file | Final file |
|---|---|---|
| Filename | modeM0/AS1A07_045T01_9000003628_24818cztM0_level2.evt | modeM0/AS1A07_045T01_9000003628_24818cztM0_level2_quad_clean.evt |
| Size (bytes) | 314,910,720 | 51,736,320 |
| Size | 300.3 MB | 49.3 MB |
| Events in quadrant A | 2,255,716 | 313,305 |
| Events in quadrant B | 2,286,861 | 319,446 |
| Events in quadrant C | 2,340,416 | 301,671 |
| Events in quadrant D | 2,329,475 | 297,673 |
| Mode M9 | |||
|---|---|---|---|
| Quadrant | BADHDUFLAG | Total packets | Discarded packets |
| A | 0 | 8 | 0 |
| B | 0 | 8 | 0 |
| C | 0 | 8 | 0 |
| D | 0 | 8 | 0 |
| Mode M0 | |||
|---|---|---|---|
| Quadrant | BADHDUFLAG | Total packets | Discarded packets |
| A | 0 | 9783 | 1 |
| B | 0 | 9852 | 1 |
| C | 0 | 10130 | 1 |
| D | 0 | 10180 | 1 |
| Mode SS | |||
|---|---|---|---|
| Quadrant | BADHDUFLAG | Total packets | Discarded packets |
| A | 0 | 98 | 0 |
| B | 0 | 98 | 0 |
| C | 0 | 98 | 0 |
| D | 0 | 98 | 0 |
| Quadrant | Total seconds | Saturated seconds | Saturation percentage |
|---|---|---|---|
| A | 4756 | 31 | 0.651808% |
| B | 4756 | 35 | 0.735913% |
| C | 4756 | 74 | 1.555929% |
| D | 4756 | 24 | 0.504626% |
Noise dominated data is calculated using 1-second bins in cleaned event files. If a bin has >2000 counts, and if more than 50% of those come from <1% of pixels, then it is considered to be noise-dominated and hence unusable.
| Quadrant | # 1 sec bins | Bins with >0 counts | Bins with >2000 counts | High rate bins dominated by noise | Noise dominated (total time) | Noise dominated (detector-on time) | Marked lightcurve |
|---|---|---|---|---|---|---|---|
| A | 5611 | 4757 | 0 | 0 | 0.00% | 0.00% | 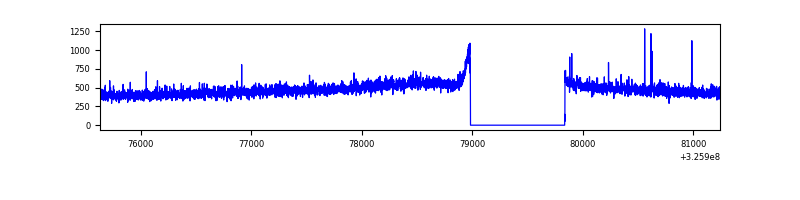 |
| B | 5611 | 4757 | 0 | 0 | 0.00% | 0.00% | 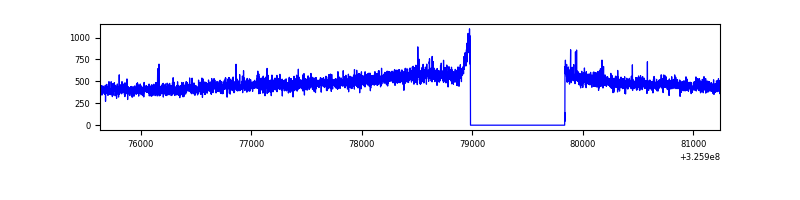 |
| C | 5611 | 4757 | 1 | 1 | 0.02% | 0.02% | 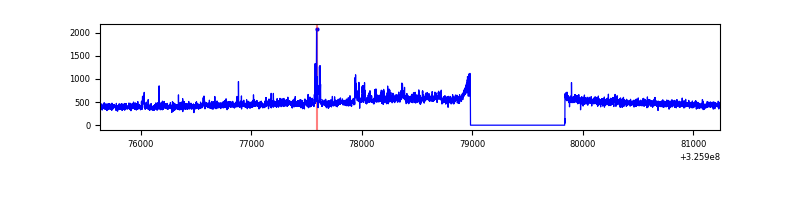 |
| D | 5611 | 4757 | 2 | 2 | 0.04% | 0.04% | 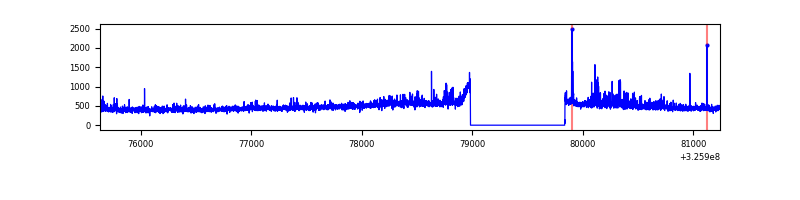 |
Top three noisy pixels from each quadrant. If the there are fewer than three noisy pixels in the level2.evt file, extra rows are filled as -1
| Pixel properties | Quadrant properties | ||||||
|---|---|---|---|---|---|---|---|
| Quadrant | DetID | PixID | Counts | Sigma | Mean | Median | Sigma |
| A | 12 | 96 | 10771 | 86.04 | 581 | 567 | 118.6 |
| A | 13 | 254 | 7057 | 54.72 | 581 | 567 | 118.6 |
| A | 3 | 137 | 5506 | 41.64 | 581 | 567 | 118.6 |
| B | 3 | 64 | 14198 | 120.9 | 576 | 561 | 112.8 |
| B | 12 | 111 | 14143 | 120.42 | 576 | 561 | 112.8 |
| B | 11 | 111 | 12644 | 107.13 | 576 | 561 | 112.8 |
| C | 14 | 238 | 89305 | 673.3 | 554 | 559 | 131.8 |
| C | 2 | 16 | 44175 | 330.91 | 554 | 559 | 131.8 |
| C | 7 | 247 | 34971 | 261.08 | 554 | 559 | 131.8 |
| D | 8 | 195 | 187095 | 1362.48 | 563 | 547 | 136.9 |
| D | 2 | 234 | 20176 | 143.36 | 563 | 547 | 136.9 |
| D | 13 | 138 | 8493 | 58.03 | 563 | 547 | 136.9 |
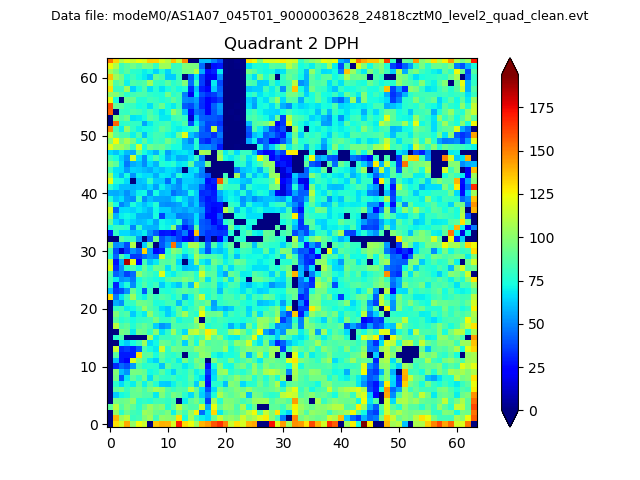
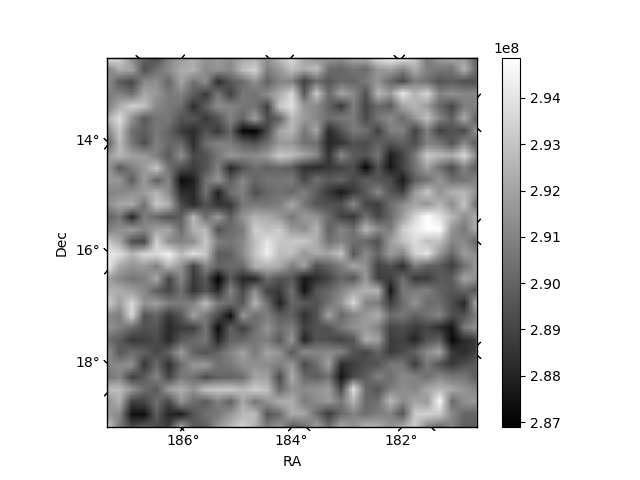
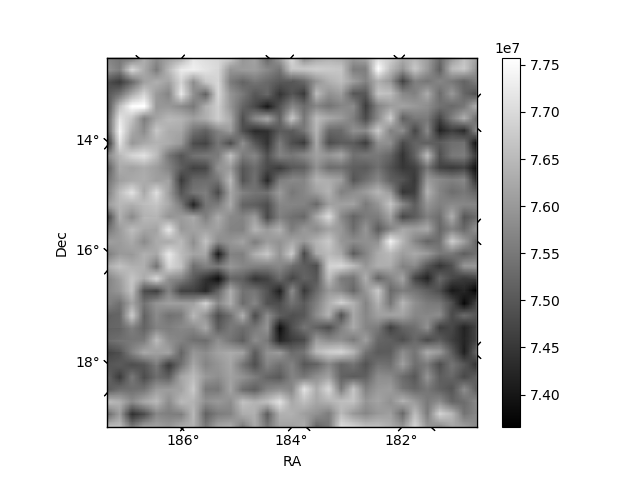
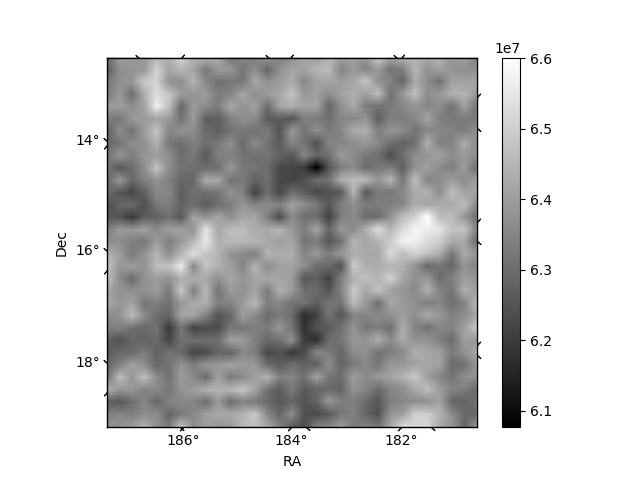
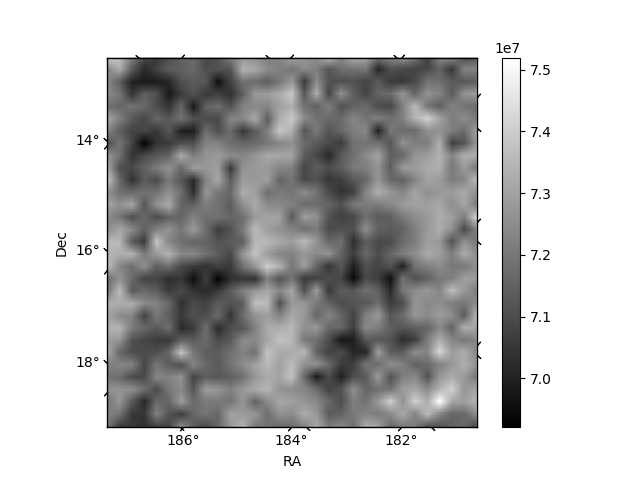
Histogram calculated using DETX and DETY for each event in the final _common_clean file
| Quadrant A | 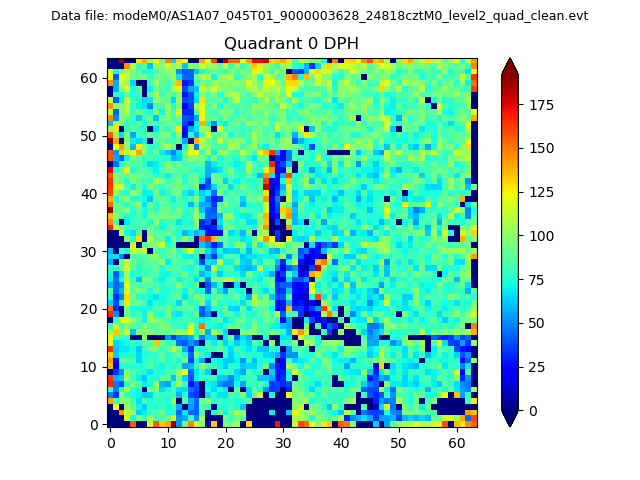 |
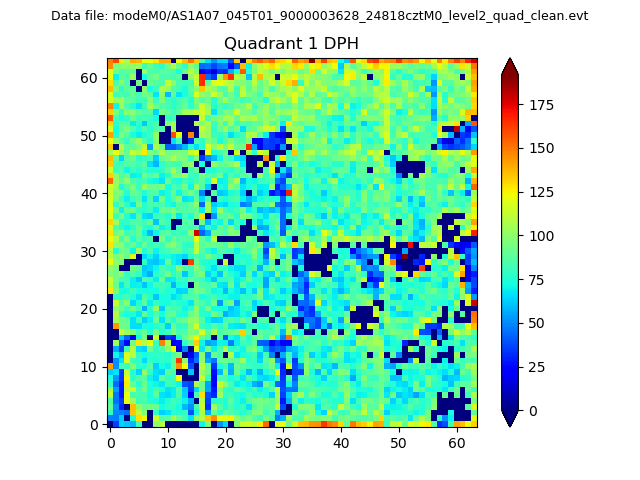 |
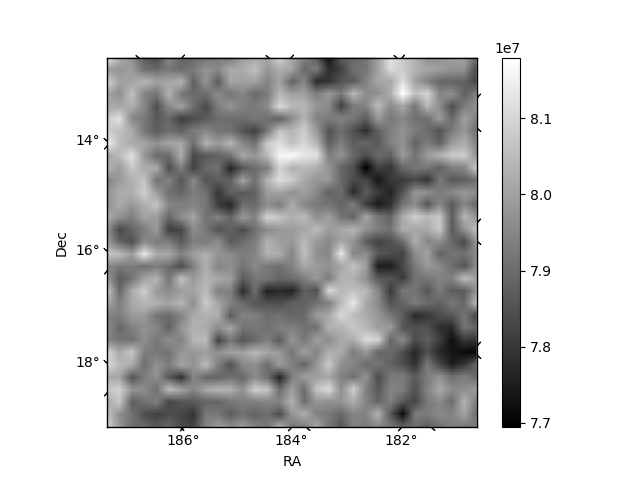
Quadrant B |
|---|---|---|---|
| Quadrant D | 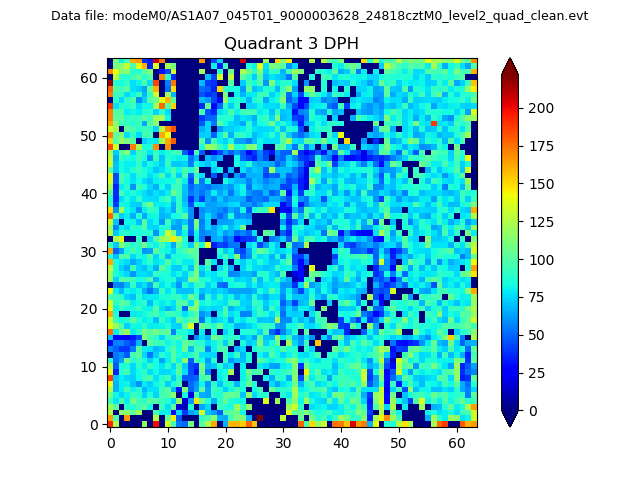 |
 |
Quadrant C |
| Plot type | Count rate plots | Images |
|---|---|---|
| Comparison with Poisson distribution Blue bars denote a histogram of data divided into 1 sec bins. Red curve is a Poisson curve with rate = median count rate of data. |
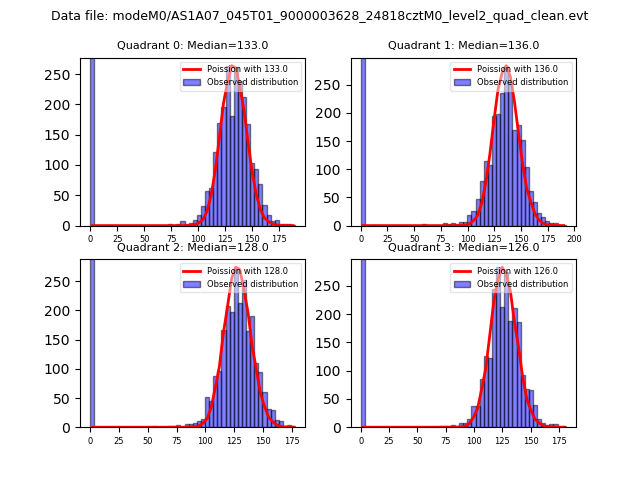 |
 |
| Quadrant-wise count rates Data is divided into 100 sec bins |
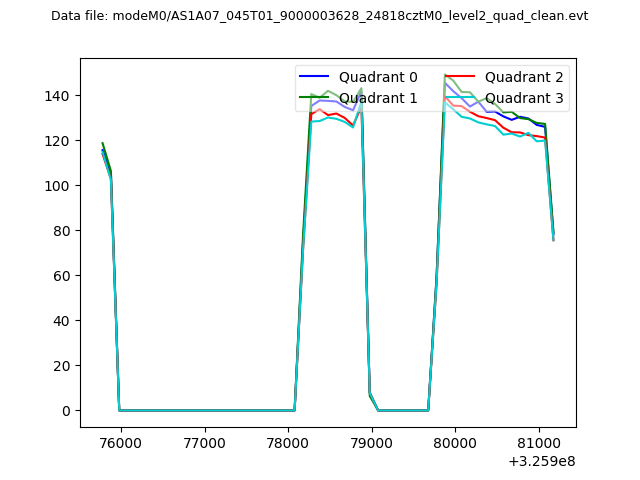 |
|
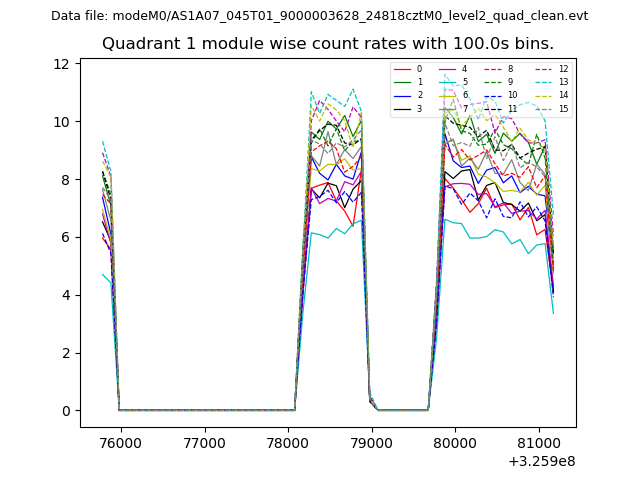
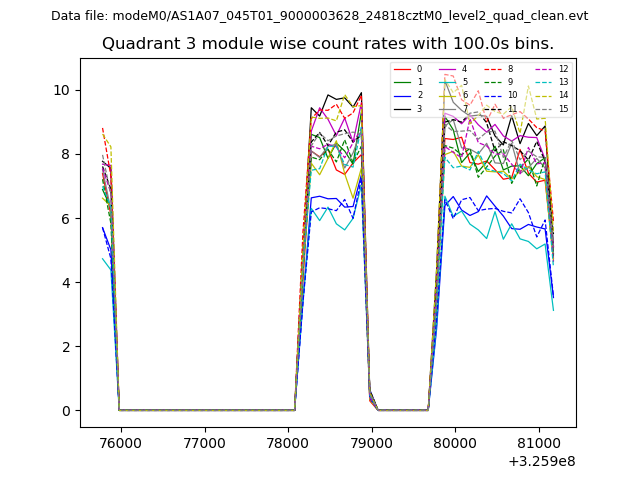
| Module-wise count rates for Quadrant A Data is divided into 100 sec bins |
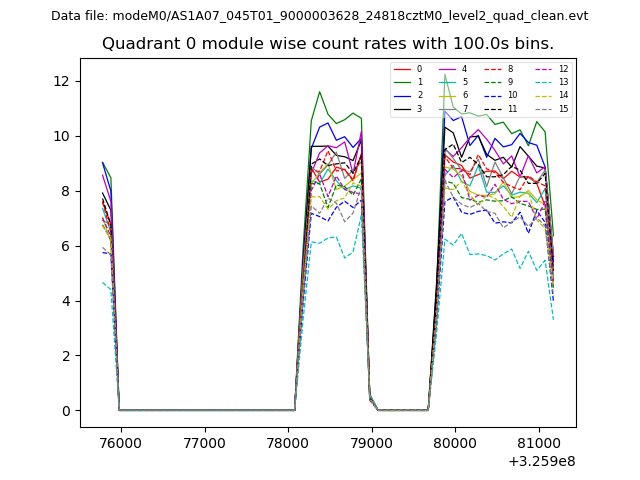 |
 |
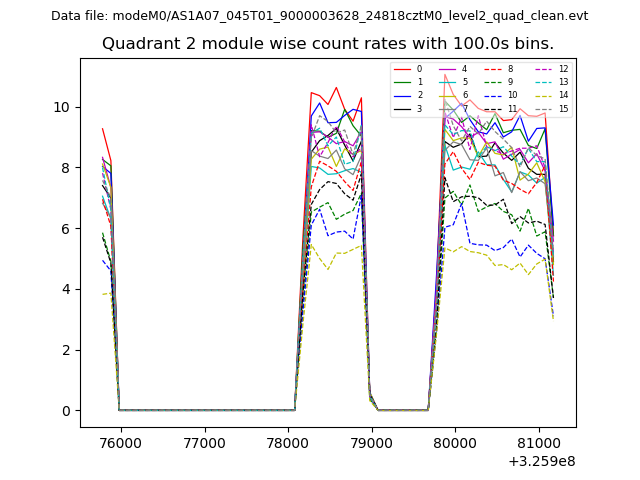
| Module-wise count rates for Quadrant B Data is divided into 100 sec bins |
 |
 |
| Module-wise count rates for Quadrant C Data is divided into 100 sec bins |
 |
 |
| Module-wise count rates for Quadrant D Data is divided into 100 sec bins |
 |
 |
| Parameter | Plot |
|---|---|
| CZT HV Monitor | 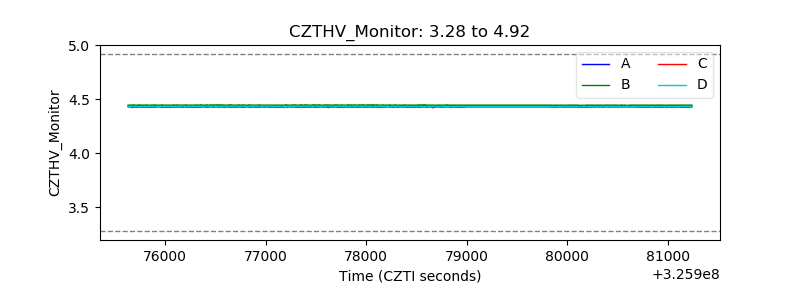 |
| D_VDD | 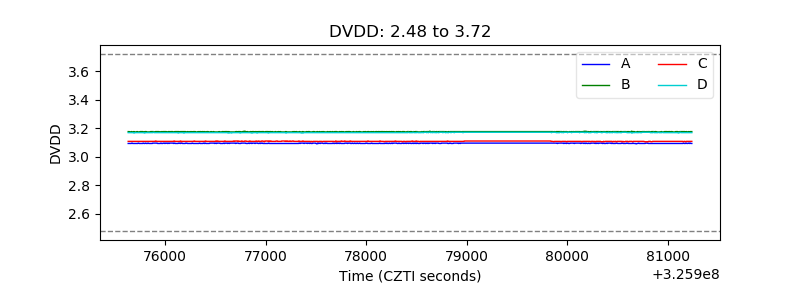 |
| Temperature 1 | 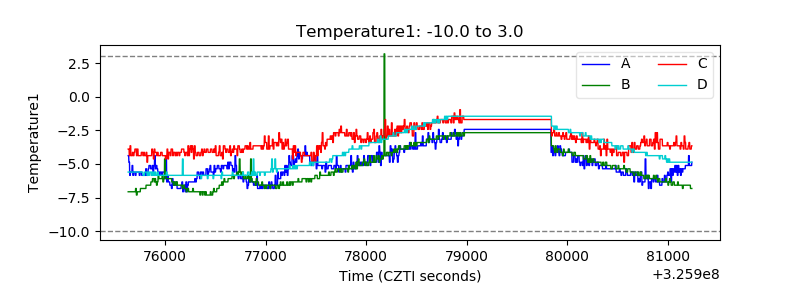 |
| Veto HV Monitor | 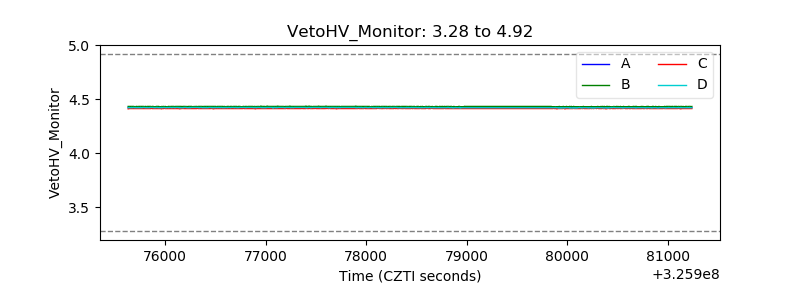 |
| Veto LLD | 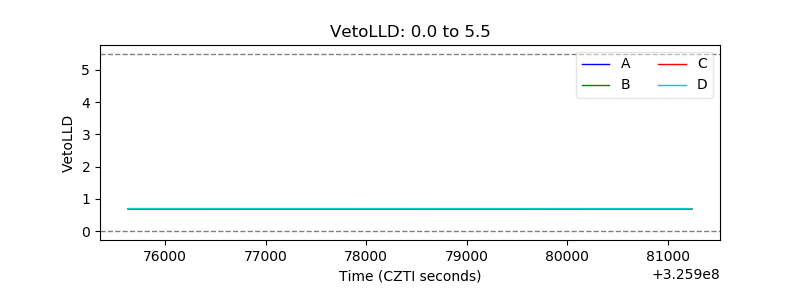 |
| Alpha Counter | 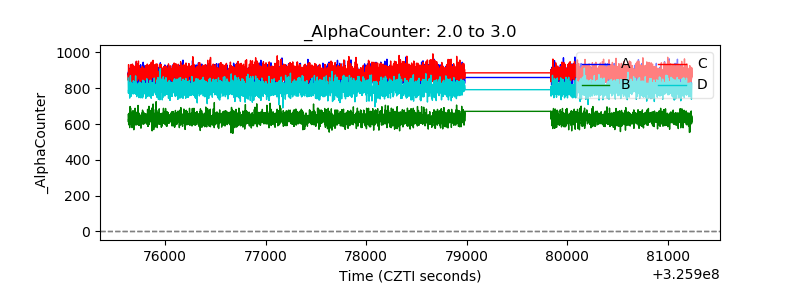 |
| _CPM_Rate | 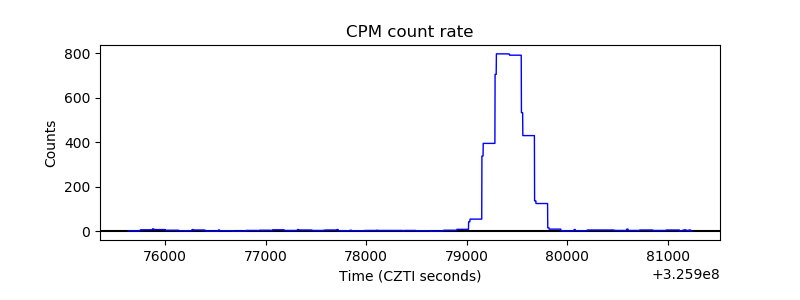 |
| CZT Counter | 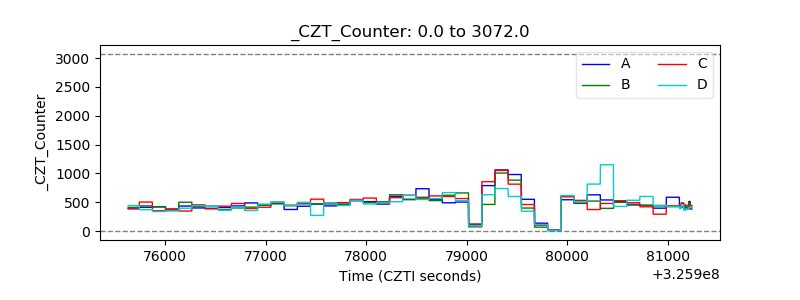 |
| +2.5 Volts monitor | 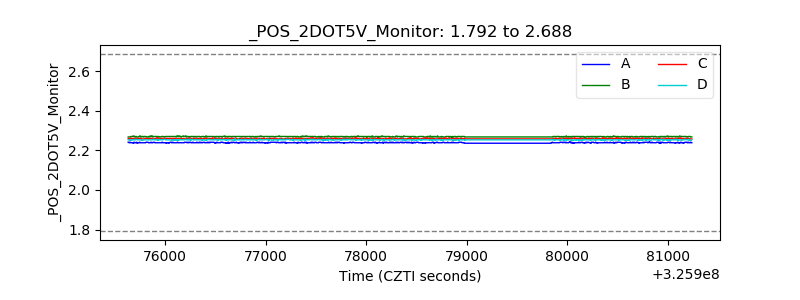 |
| +5 Volts monitor |  |
| _ROLL_ROT | 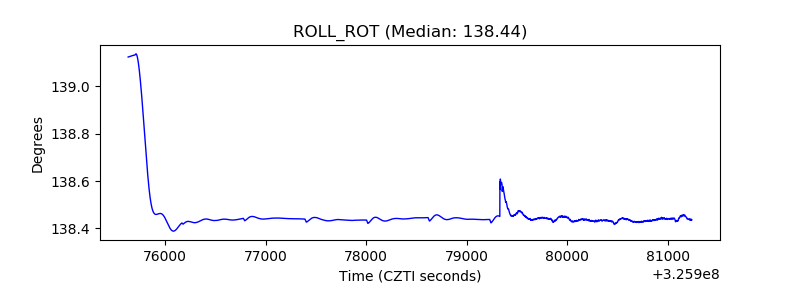 |
| _Roll_DEC | 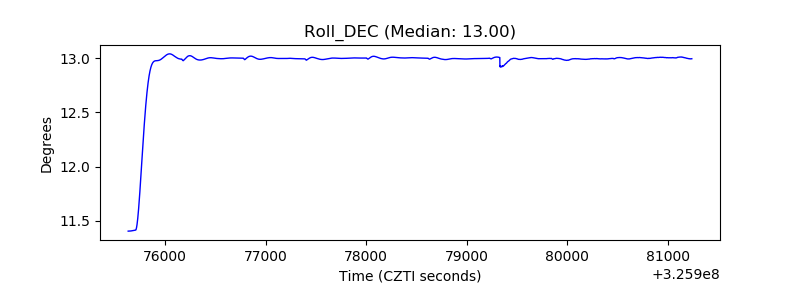 |
| _Roll_RA | 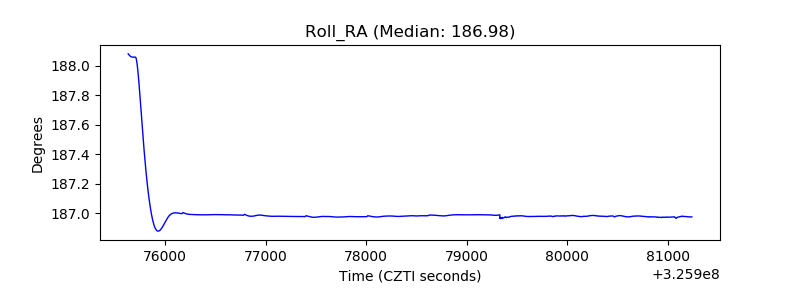 |
| Veto Counter | 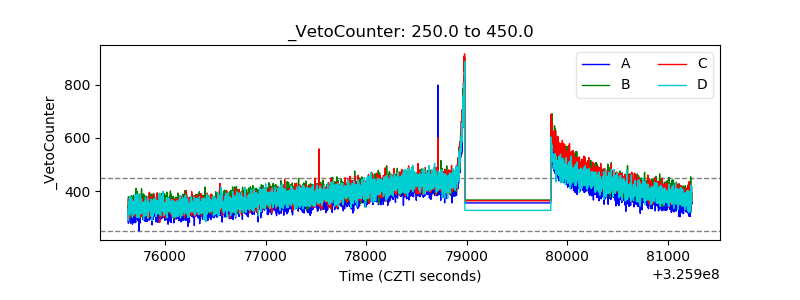 |