| Param | Original file | Final file |
|---|---|---|
| Filename | modeM0/AS1A07_045T01_9000003628_24822cztM0_level2.evt | modeM0/AS1A07_045T01_9000003628_24822cztM0_level2_quad_clean.evt |
| Size (bytes) | 468,334,080 | 83,998,080 |
| Size | 446.6 MB | 80.1 MB |
| Events in quadrant A | 3,185,456 | 545,400 |
| Events in quadrant B | 3,613,506 | 549,219 |
| Events in quadrant C | 3,525,927 | 514,933 |
| Events in quadrant D | 3,433,585 | 497,114 |
| Mode M9 | |||
|---|---|---|---|
| Quadrant | BADHDUFLAG | Total packets | Discarded packets |
| A | 0 | 16 | 0 |
| B | 0 | 17 | 0 |
| C | 0 | 17 | 0 |
| D | 0 | 17 | 0 |
| Mode M0 | |||
|---|---|---|---|
| Quadrant | BADHDUFLAG | Total packets | Discarded packets |
| A | 0 | 13170 | 2 |
| B | 0 | 14631 | 2 |
| C | 0 | 14354 | 2 |
| D | 0 | 14086 | 2 |
| Mode SS | |||
|---|---|---|---|
| Quadrant | BADHDUFLAG | Total packets | Discarded packets |
| A | 0 | 126 | 0 |
| B | 0 | 126 | 0 |
| C | 0 | 126 | 0 |
| D | 0 | 126 | 0 |
| Quadrant | Total seconds | Saturated seconds | Saturation percentage |
|---|---|---|---|
| A | 6264 | 24 | 0.383142% |
| B | 6264 | 136 | 2.171137% |
| C | 6264 | 96 | 1.532567% |
| D | 6263 | 88 | 1.405077% |
Noise dominated data is calculated using 1-second bins in cleaned event files. If a bin has >2000 counts, and if more than 50% of those come from <1% of pixels, then it is considered to be noise-dominated and hence unusable.
| Quadrant | # 1 sec bins | Bins with >0 counts | Bins with >2000 counts | High rate bins dominated by noise | Noise dominated (total time) | Noise dominated (detector-on time) | Marked lightcurve |
|---|---|---|---|---|---|---|---|
| A | 7484 | 6265 | 0 | 0 | 0.00% | 0.00% | 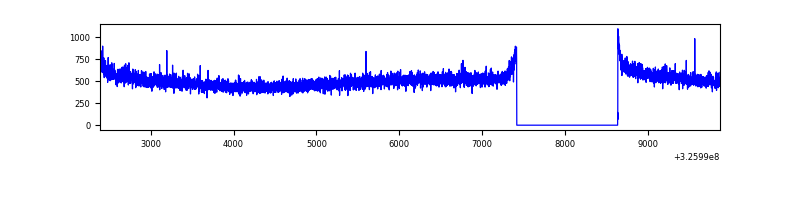 |
| B | 7484 | 6265 | 59 | 59 | 0.79% | 0.94% | 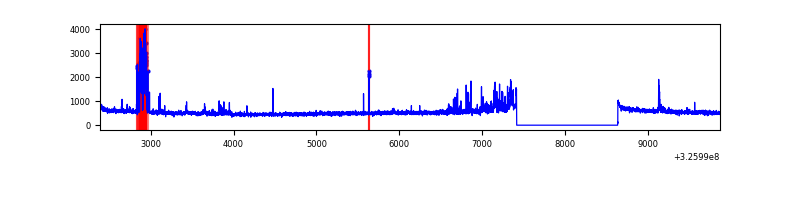 |
| C | 7484 | 6265 | 1 | 1 | 0.01% | 0.02% | 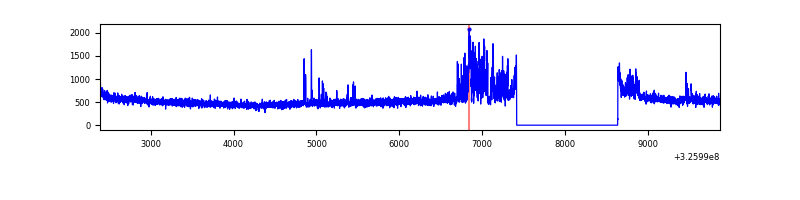 |
| D | 7483 | 6264 | 72 | 72 | 0.96% | 1.15% | 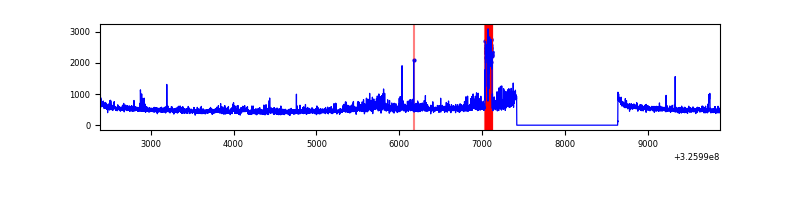 |
Top three noisy pixels from each quadrant. If the there are fewer than three noisy pixels in the level2.evt file, extra rows are filled as -1
| Pixel properties | Quadrant properties | ||||||
|---|---|---|---|---|---|---|---|
| Quadrant | DetID | PixID | Counts | Sigma | Mean | Median | Sigma |
| A | 13 | 254 | 9084 | 50.14 | 826 | 811 | 165.0 |
| A | 3 | 137 | 7289 | 39.26 | 826 | 811 | 165.0 |
| A | 0 | 226 | 7068 | 37.92 | 826 | 811 | 165.0 |
| B | 3 | 64 | 312836 | 2015.58 | 817 | 797 | 154.8 |
| B | 15 | 32 | 87931 | 562.83 | 817 | 797 | 154.8 |
| B | 12 | 111 | 18479 | 114.21 | 817 | 797 | 154.8 |
| C | 7 | 247 | 342009 | 1872.27 | 782 | 788 | 182.2 |
| C | 14 | 238 | 126727 | 691.02 | 782 | 788 | 182.2 |
| C | 10 | 218 | 6168 | 29.52 | 782 | 788 | 182.2 |
| D | 8 | 195 | 258424 | 1353.58 | 782 | 761 | 190.4 |
| D | 9 | 35 | 164946 | 862.52 | 782 | 761 | 190.4 |
| D | 1 | 52 | 49787 | 257.55 | 782 | 761 | 190.4 |
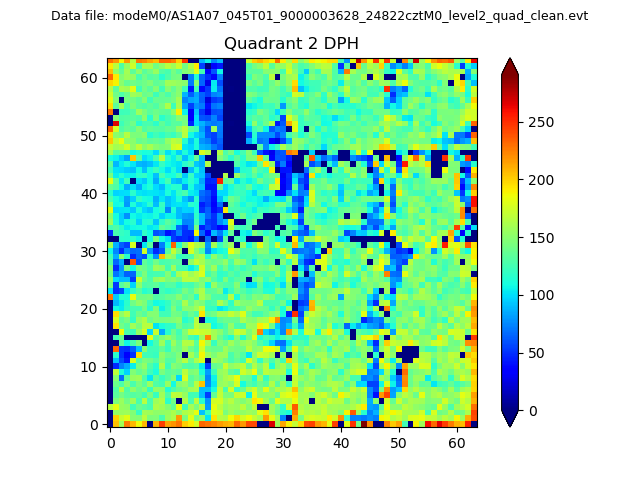
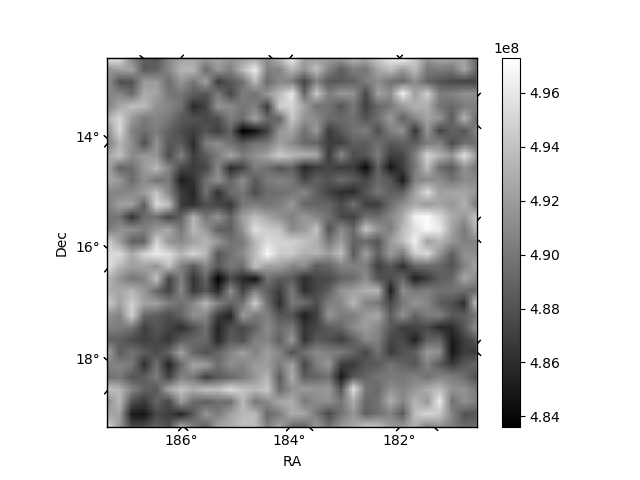
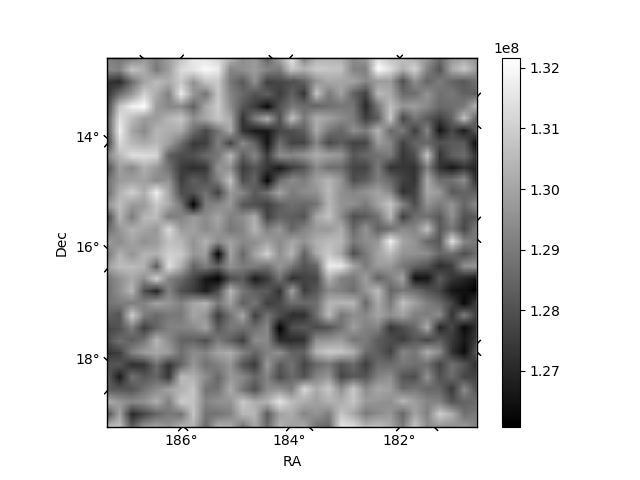
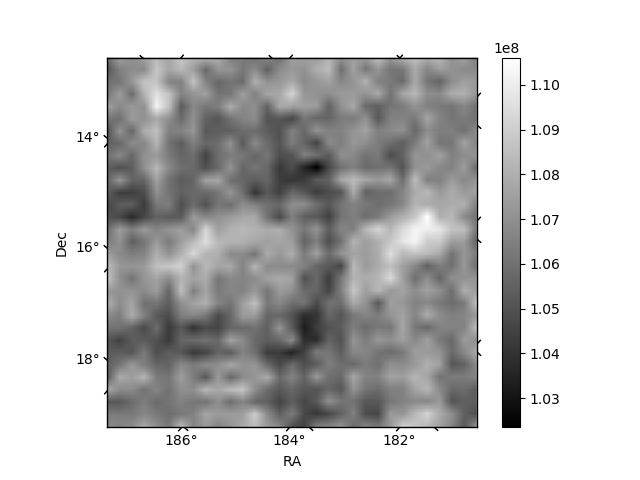
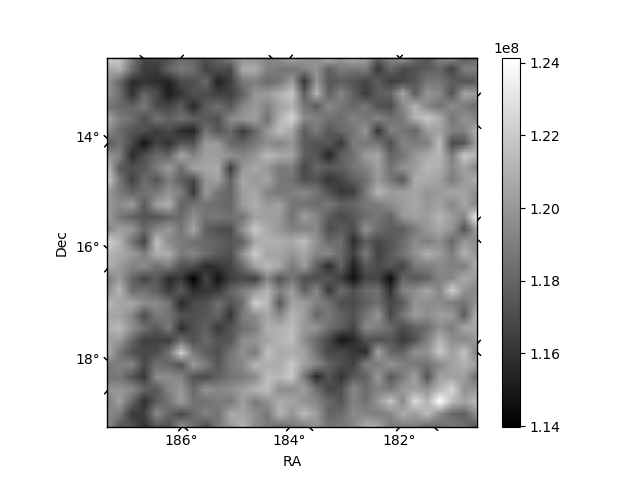
Histogram calculated using DETX and DETY for each event in the final _common_clean file
| Quadrant A | 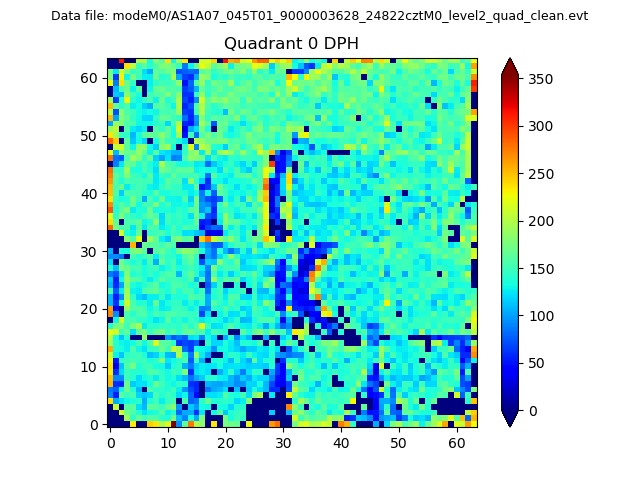 |
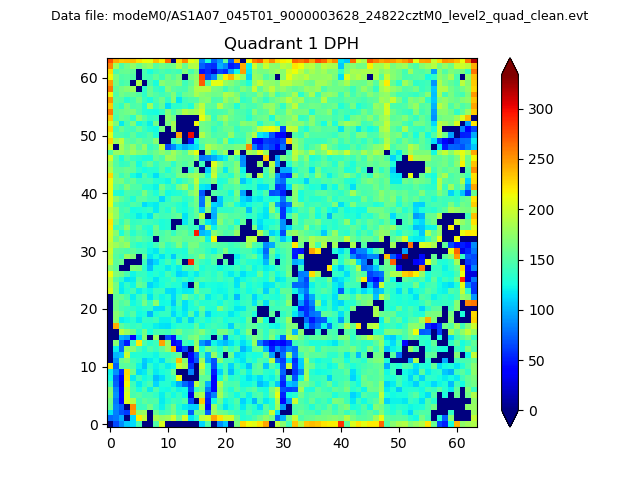 |
Quadrant B |
|---|---|---|---|
| Quadrant D | 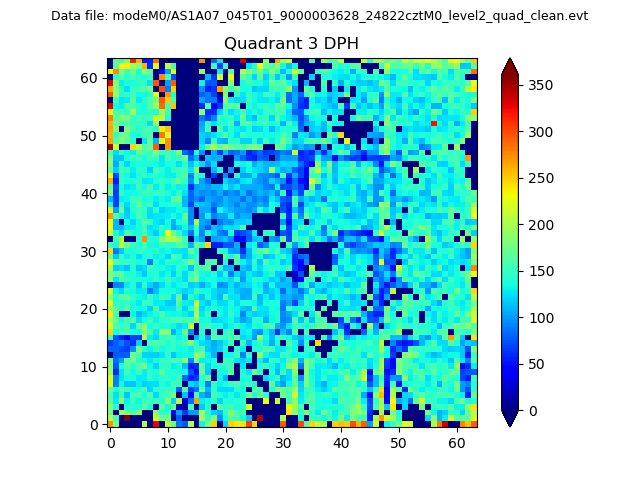 |
 |
Quadrant C |
| Plot type | Count rate plots | Images |
|---|---|---|
| Comparison with Poisson distribution Blue bars denote a histogram of data divided into 1 sec bins. Red curve is a Poisson curve with rate = median count rate of data. |
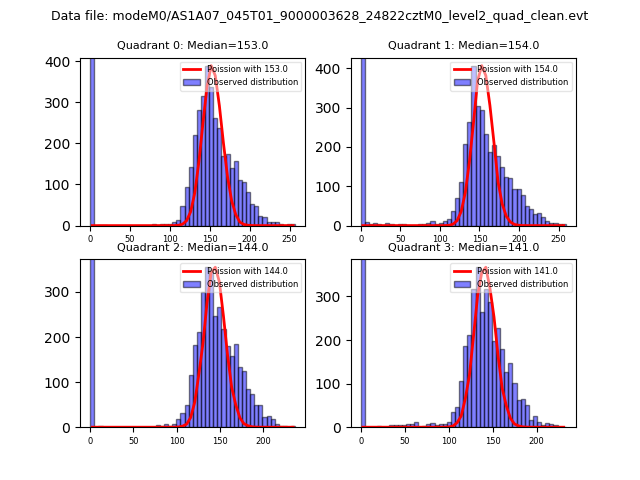 |
 |
| Quadrant-wise count rates Data is divided into 100 sec bins |
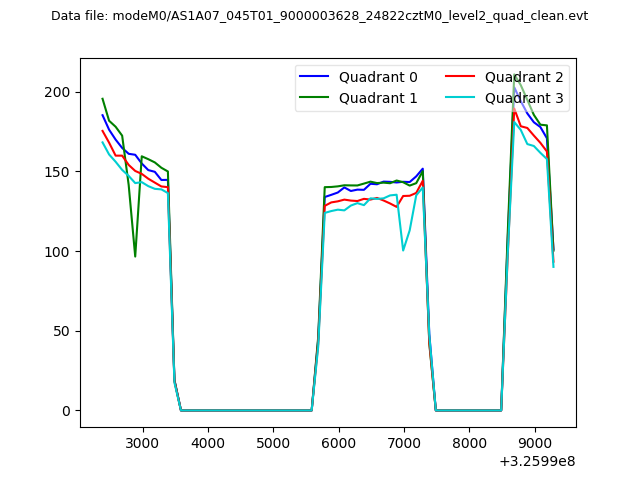 |
|
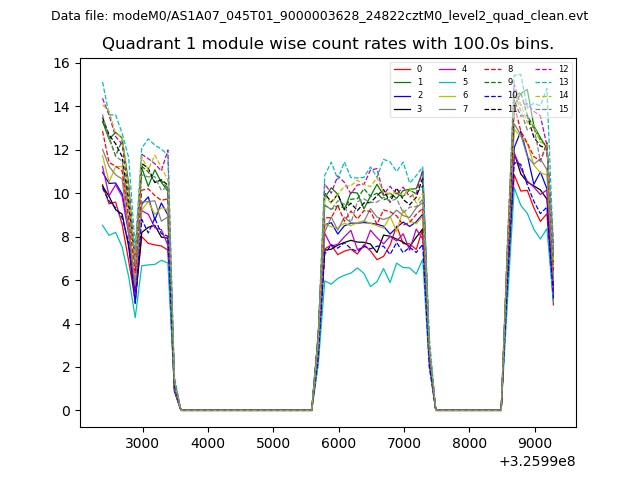
| Module-wise count rates for Quadrant A Data is divided into 100 sec bins |
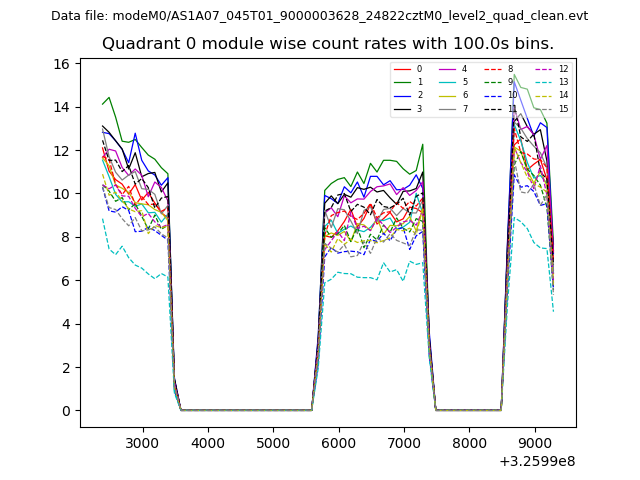 |
 |
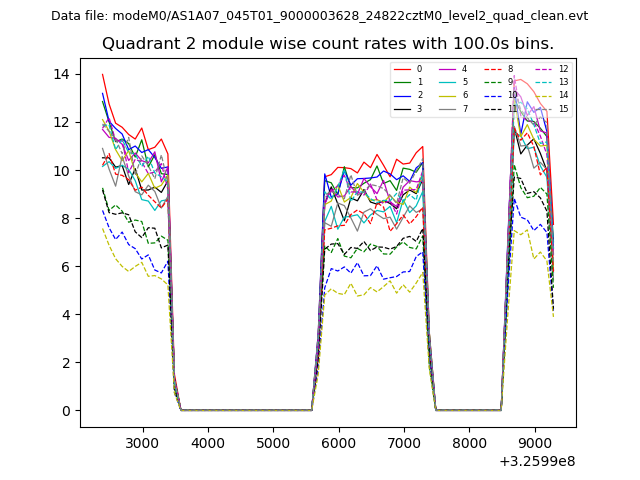
| Module-wise count rates for Quadrant B Data is divided into 100 sec bins |
 |
 |
| Module-wise count rates for Quadrant C Data is divided into 100 sec bins |
 |
 |
| Module-wise count rates for Quadrant D Data is divided into 100 sec bins |
 |
 |
| Parameter | Plot |
|---|---|
| CZT HV Monitor | 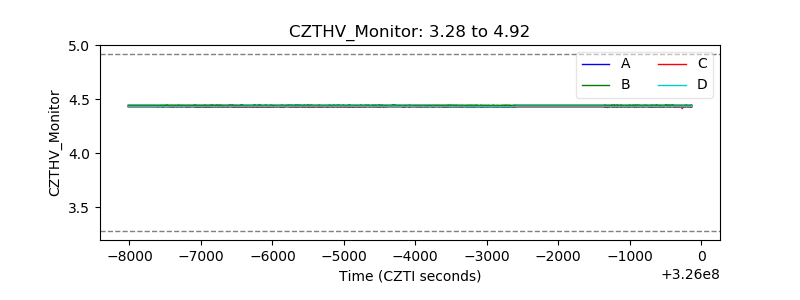 |
| D_VDD | 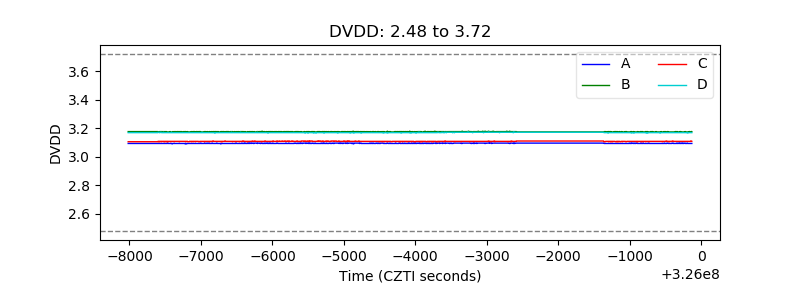 |
| Temperature 1 | 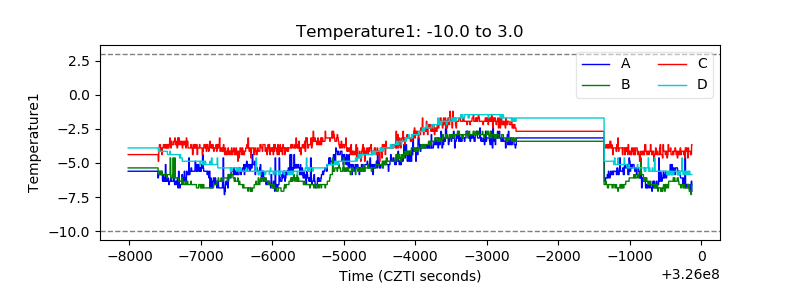 |
| Veto HV Monitor | 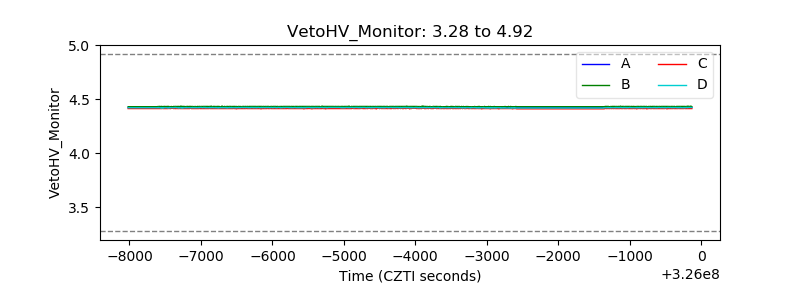 |
| Veto LLD | 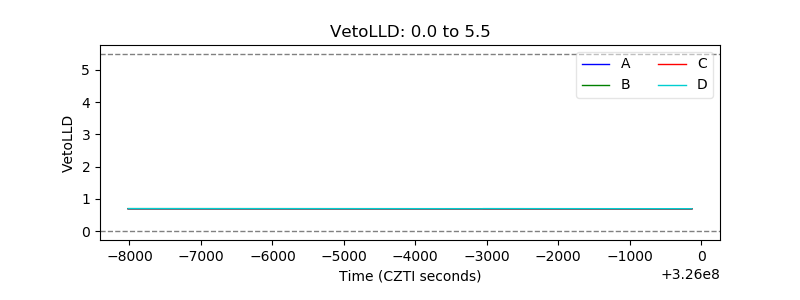 |
| Alpha Counter | 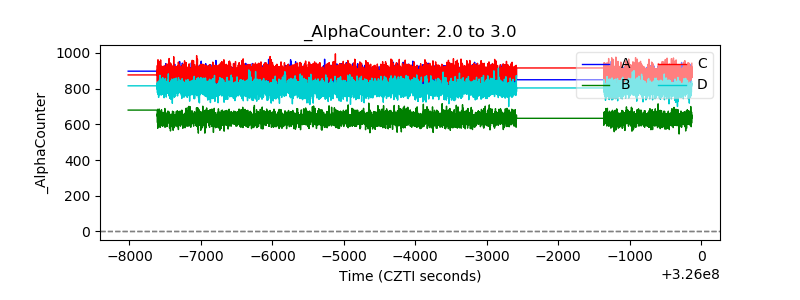 |
| _CPM_Rate | 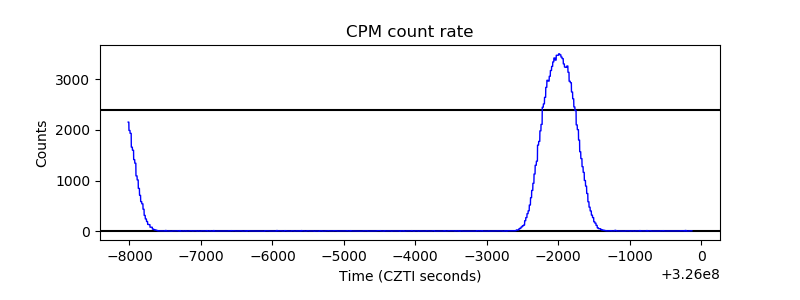 |
| CZT Counter | 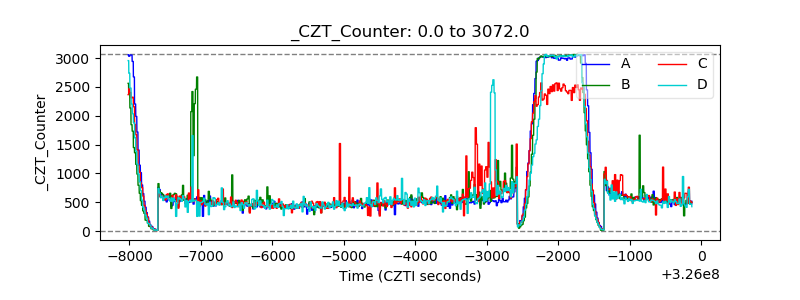 |
| +2.5 Volts monitor |  |
| +5 Volts monitor | 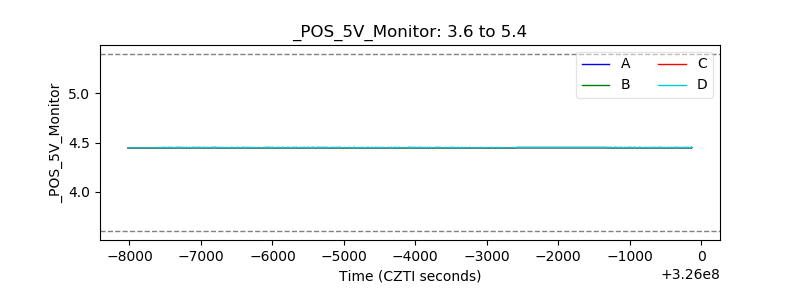 |
| _ROLL_ROT | 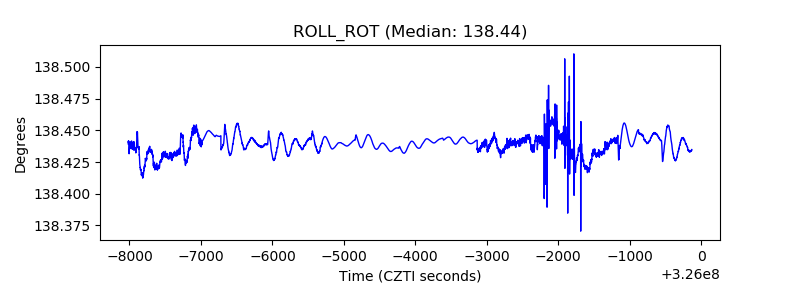 |
| _Roll_DEC | 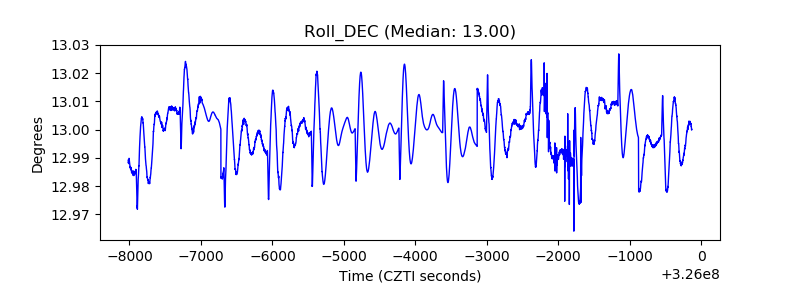 |
| _Roll_RA | 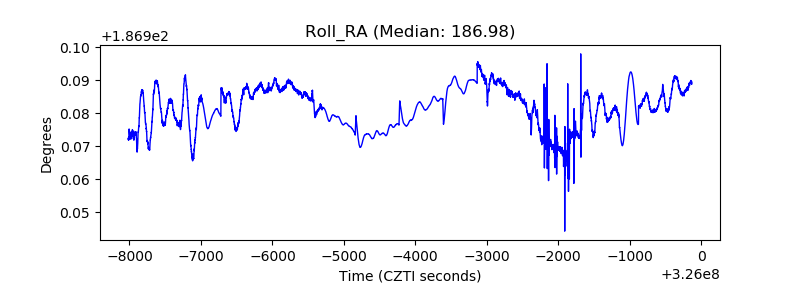 |
| Veto Counter | 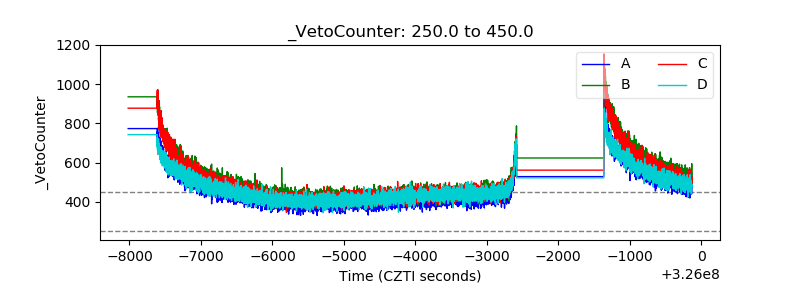 |