| Param | Original file | Final file |
|---|---|---|
| Filename | modeM0/AS1A07_045T01_9000003628_24823cztM0_level2.evt | modeM0/AS1A07_045T01_9000003628_24823cztM0_level2_quad_clean.evt |
| Size (bytes) | 472,956,480 | 77,019,840 |
| Size | 451.0 MB | 73.5 MB |
| Events in quadrant A | 3,320,796 | 487,946 |
| Events in quadrant B | 3,913,122 | 500,712 |
| Events in quadrant C | 3,450,152 | 461,913 |
| Events in quadrant D | 3,219,586 | 449,781 |
| Mode M9 | |||
|---|---|---|---|
| Quadrant | BADHDUFLAG | Total packets | Discarded packets |
| A | 0 | 17 | 0 |
| B | 0 | 18 | 0 |
| C | 0 | 18 | 0 |
| D | 0 | 18 | 0 |
| Mode M0 | |||
|---|---|---|---|
| Quadrant | BADHDUFLAG | Total packets | Discarded packets |
| A | 0 | 13410 | 2 |
| B | 0 | 15369 | 4 |
| C | 0 | 13864 | 2 |
| D | 0 | 13271 | 2 |
| Mode SS | |||
|---|---|---|---|
| Quadrant | BADHDUFLAG | Total packets | Discarded packets |
| A | 0 | 126 | 0 |
| B | 0 | 126 | 0 |
| C | 0 | 126 | 0 |
| D | 0 | 126 | 0 |
| Quadrant | Total seconds | Saturated seconds | Saturation percentage |
|---|---|---|---|
| A | 6186 | 40 | 0.646621% |
| B | 6185 | 269 | 4.349232% |
| C | 6185 | 74 | 1.196443% |
| D | 6185 | 13 | 0.210186% |
Noise dominated data is calculated using 1-second bins in cleaned event files. If a bin has >2000 counts, and if more than 50% of those come from <1% of pixels, then it is considered to be noise-dominated and hence unusable.
| Quadrant | # 1 sec bins | Bins with >0 counts | Bins with >2000 counts | High rate bins dominated by noise | Noise dominated (total time) | Noise dominated (detector-on time) | Marked lightcurve |
|---|---|---|---|---|---|---|---|
| A | 7481 | 6187 | 0 | 0 | 0.00% | 0.00% | 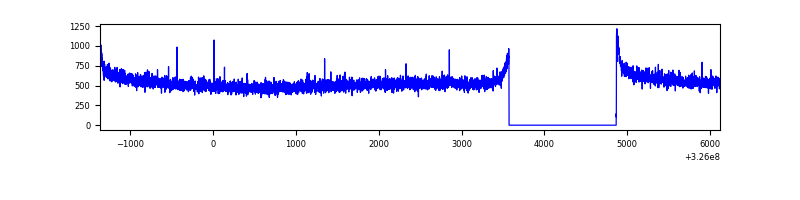 |
| B | 7480 | 6186 | 205 | 205 | 2.74% | 3.31% | 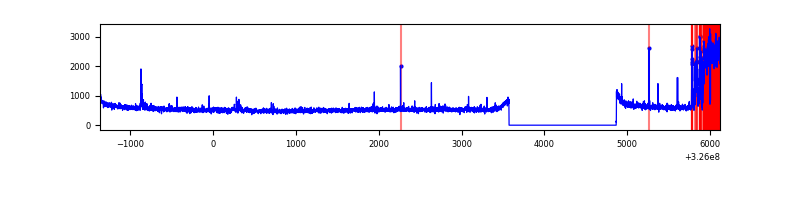 |
| C | 7480 | 6186 | 0 | 0 | 0.00% | 0.00% | 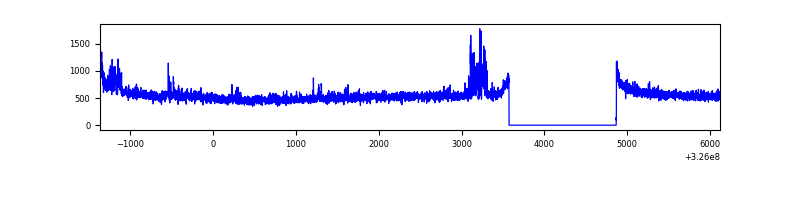 |
| D | 7480 | 6186 | 2 | 2 | 0.03% | 0.03% | 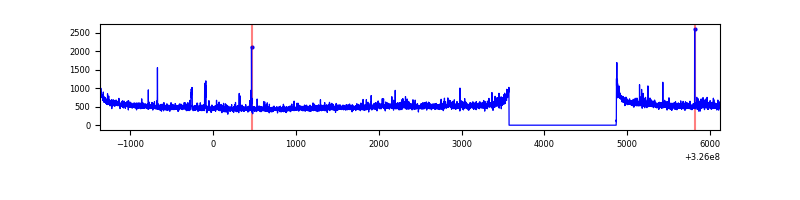 |
Top three noisy pixels from each quadrant. If the there are fewer than three noisy pixels in the level2.evt file, extra rows are filled as -1
| Pixel properties | Quadrant properties | ||||||
|---|---|---|---|---|---|---|---|
| Quadrant | DetID | PixID | Counts | Sigma | Mean | Median | Sigma |
| A | 13 | 254 | 8577 | 45.5 | 861 | 848 | 169.9 |
| A | 3 | 137 | 7434 | 38.77 | 861 | 848 | 169.9 |
| A | 0 | 226 | 7350 | 38.28 | 861 | 848 | 169.9 |
| B | 3 | 64 | 589124 | 3698.48 | 846 | 828 | 159.1 |
| B | 12 | 111 | 18802 | 113.0 | 846 | 828 | 159.1 |
| B | 11 | 111 | 17170 | 102.74 | 846 | 828 | 159.1 |
| C | 14 | 238 | 133798 | 710.72 | 811 | 821 | 187.1 |
| C | 7 | 247 | 84528 | 447.39 | 811 | 821 | 187.1 |
| C | 2 | 16 | 73756 | 389.81 | 811 | 821 | 187.1 |
| D | 8 | 195 | 97256 | 488.34 | 817 | 797 | 197.5 |
| D | 1 | 52 | 40217 | 199.57 | 817 | 797 | 197.5 |
| D | 2 | 234 | 22647 | 110.62 | 817 | 797 | 197.5 |
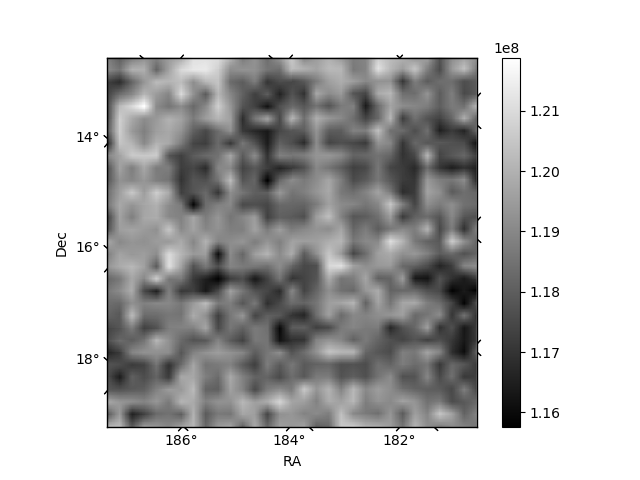
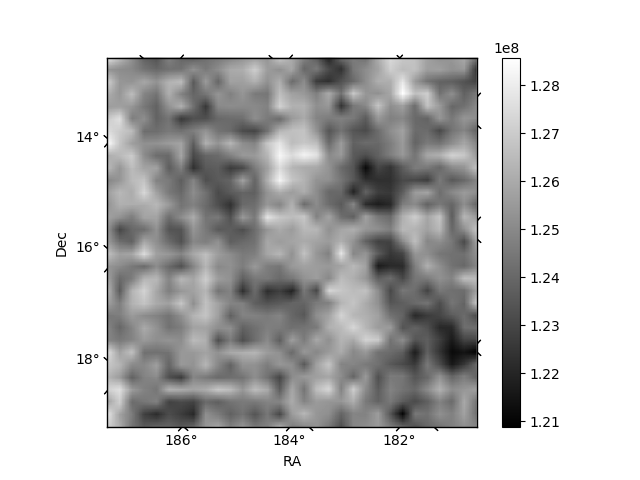
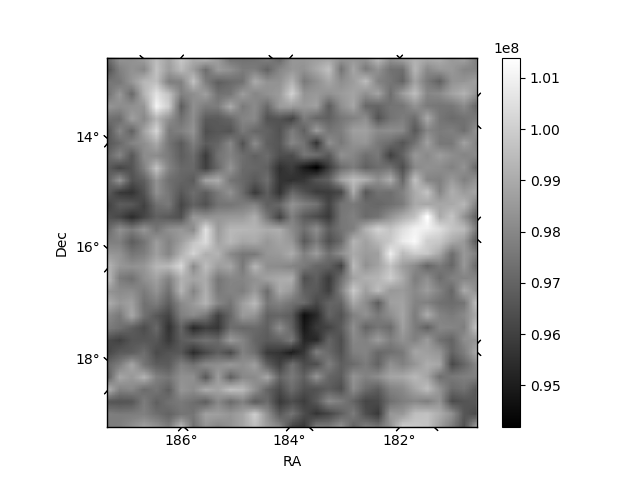
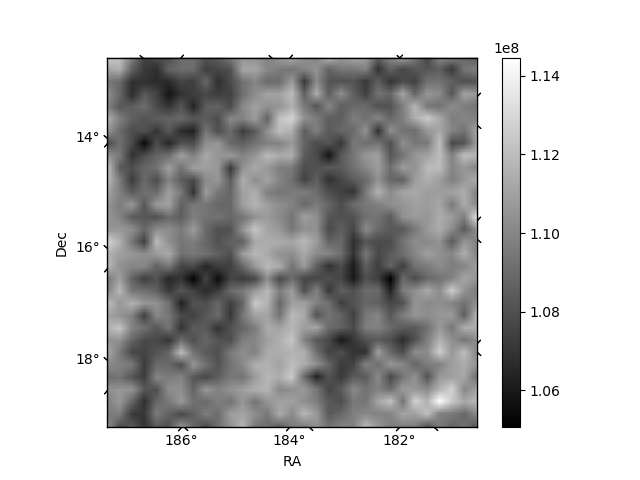
Histogram calculated using DETX and DETY for each event in the final _common_clean file
| Quadrant A | 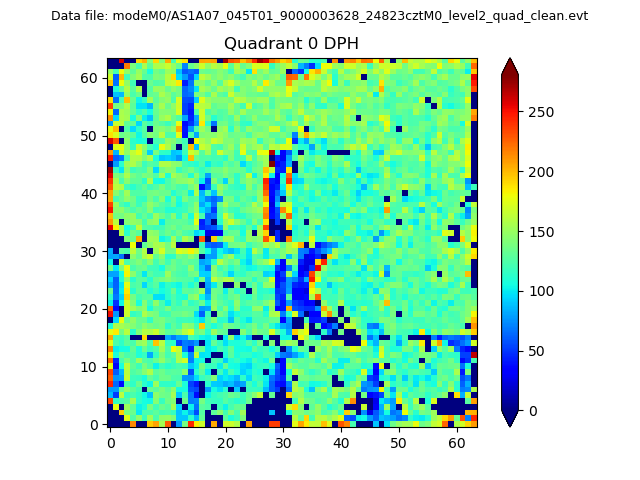 |
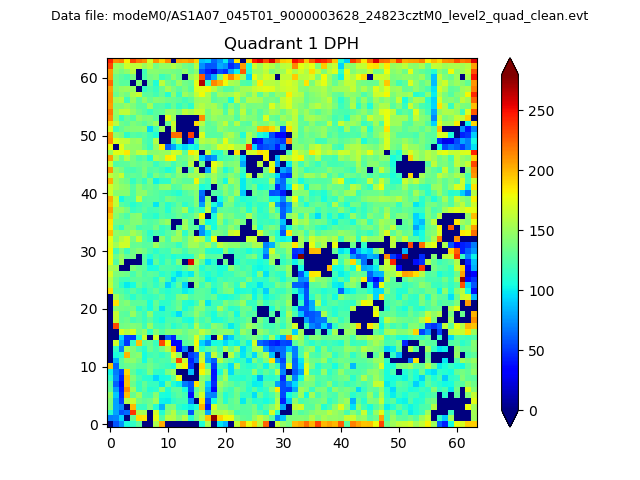 |
Quadrant B |
|---|---|---|---|
| Quadrant D | 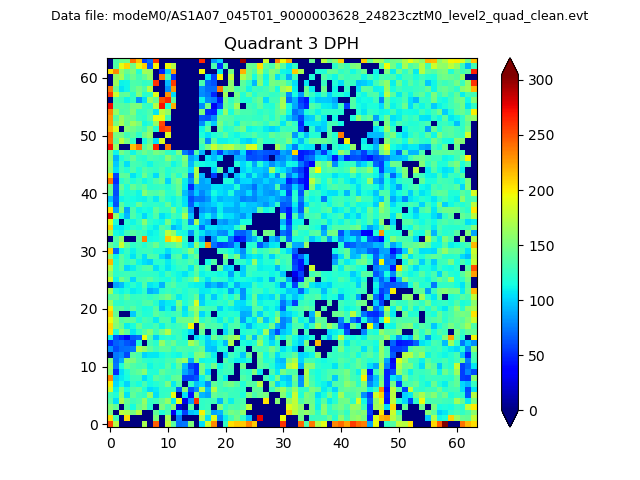 |
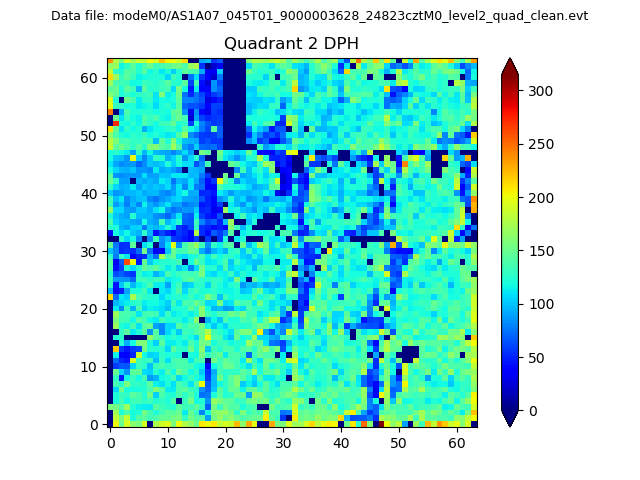 |
Quadrant C |
| Plot type | Count rate plots | Images |
|---|---|---|
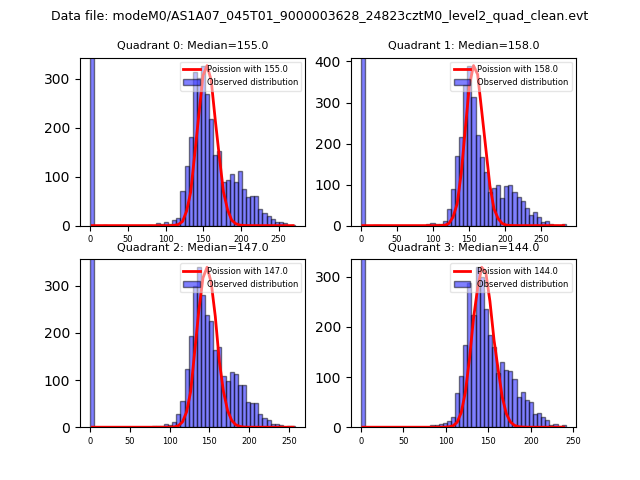
| Comparison with Poisson distribution Blue bars denote a histogram of data divided into 1 sec bins. Red curve is a Poisson curve with rate = median count rate of data. |
 |
 |
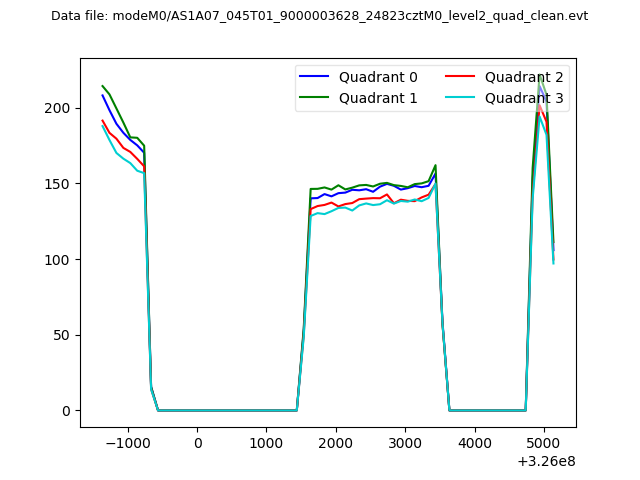
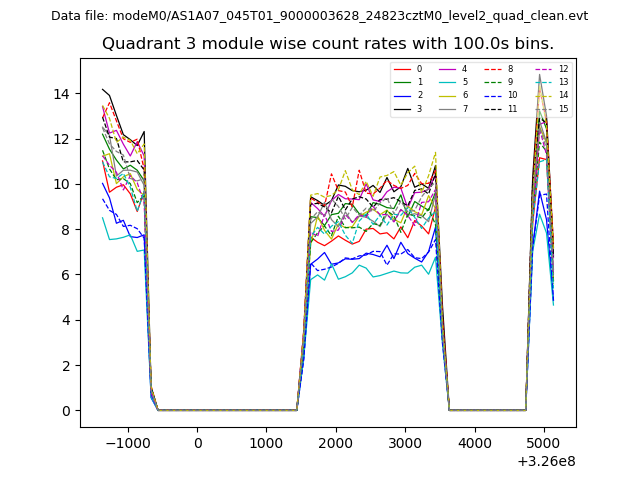
| Quadrant-wise count rates Data is divided into 100 sec bins |
 |
|
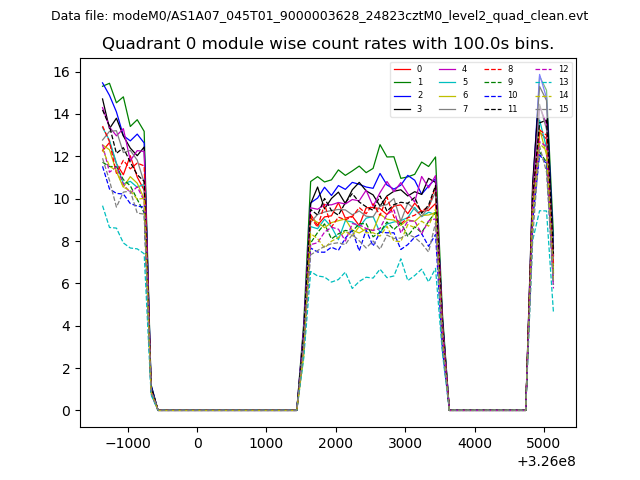
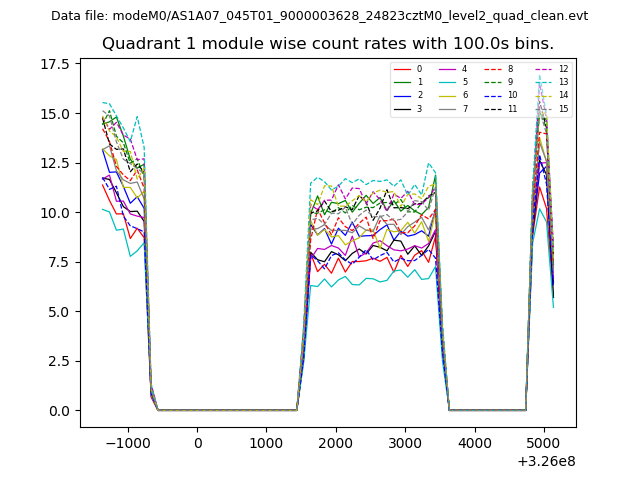
| Module-wise count rates for Quadrant A Data is divided into 100 sec bins |
 |
 |
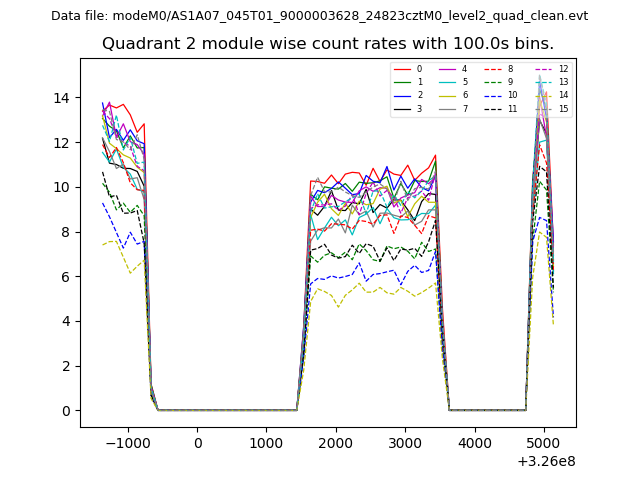
| Module-wise count rates for Quadrant B Data is divided into 100 sec bins |
 |
 |
| Module-wise count rates for Quadrant C Data is divided into 100 sec bins |
 |
 |
| Module-wise count rates for Quadrant D Data is divided into 100 sec bins |
 |
 |
| Parameter | Plot |
|---|---|
| CZT HV Monitor | 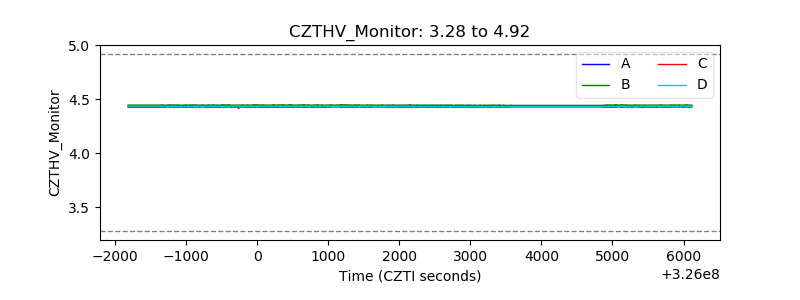 |
| D_VDD | 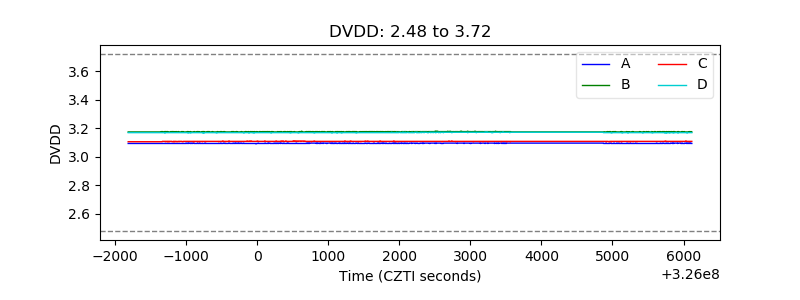 |
| Temperature 1 | 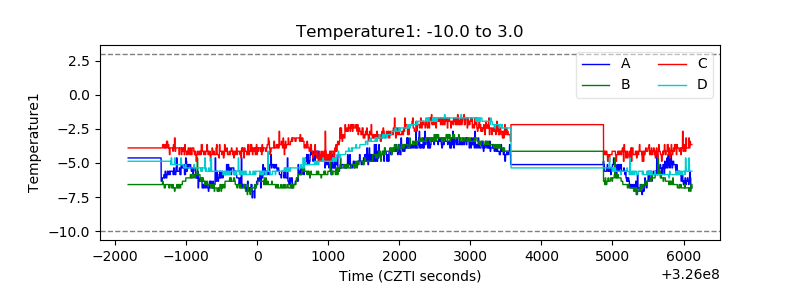 |
| Veto HV Monitor | 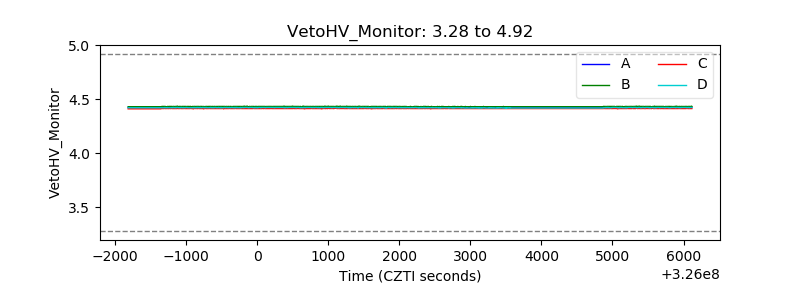 |
| Veto LLD | 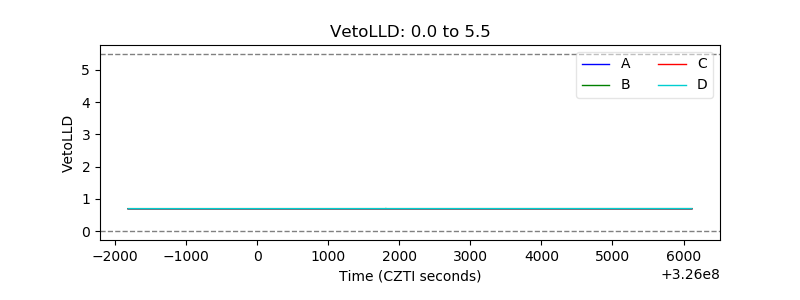 |
| Alpha Counter | 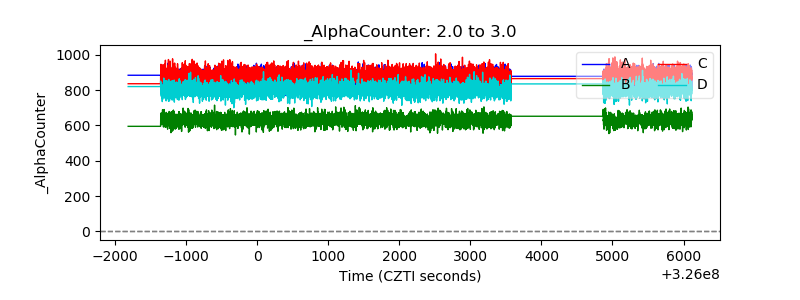 |
| _CPM_Rate | 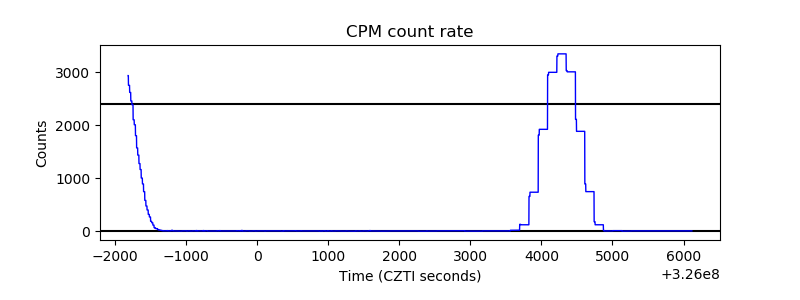 |
| CZT Counter | 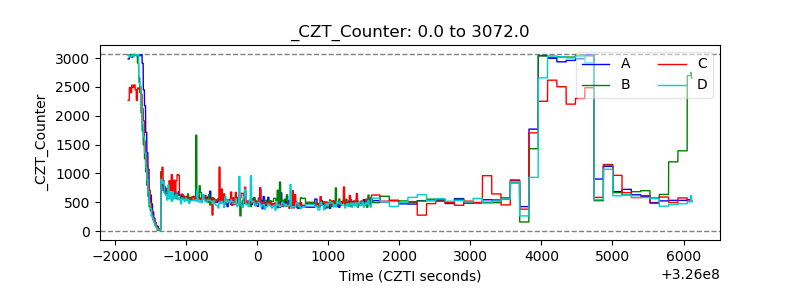 |
| +2.5 Volts monitor |  |
| +5 Volts monitor |  |
| _ROLL_ROT | 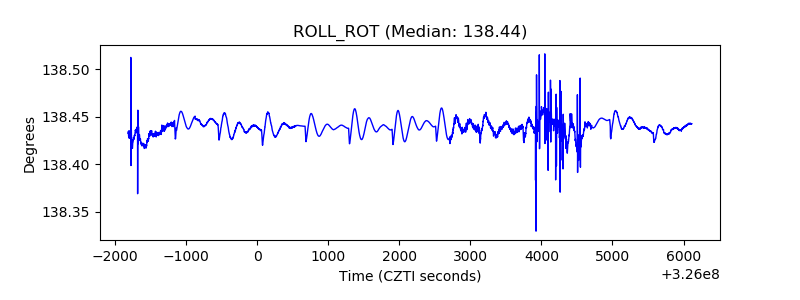 |
| _Roll_DEC | 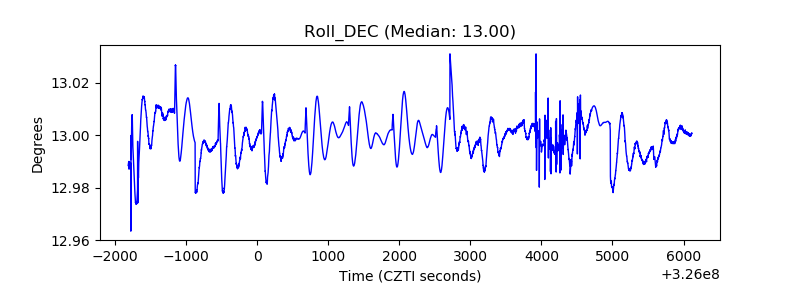 |
| _Roll_RA | 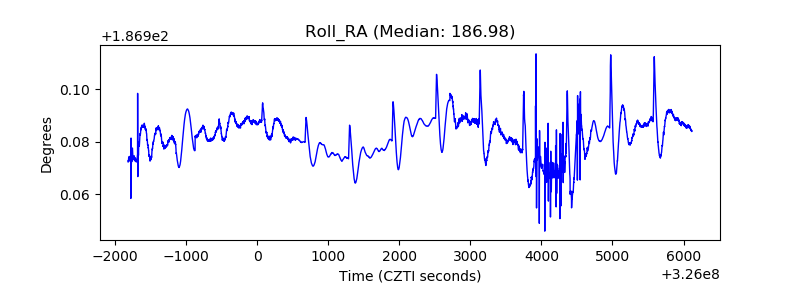 |
| Veto Counter | 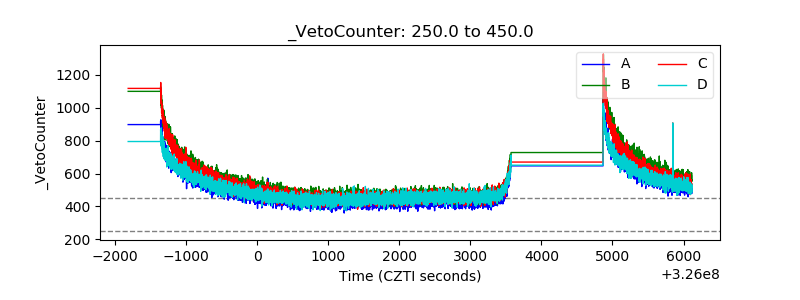 |