| Param | Original file | Final file |
|---|---|---|
| Filename | modeM0/AS1A07_045T01_9000003628_24824cztM0_level2.evt | modeM0/AS1A07_045T01_9000003628_24824cztM0_level2_quad_clean.evt |
| Size (bytes) | 506,476,800 | 67,671,360 |
| Size | 483.0 MB | 64.5 MB |
| Events in quadrant A | 3,375,415 | 418,859 |
| Events in quadrant B | 4,445,217 | 424,909 |
| Events in quadrant C | 3,358,030 | 396,168 |
| Events in quadrant D | 3,746,603 | 383,067 |
| Mode M9 | |||
|---|---|---|---|
| Quadrant | BADHDUFLAG | Total packets | Discarded packets |
| A | 0 | 19 | 0 |
| B | 0 | 20 | 0 |
| C | 0 | 20 | 0 |
| D | 0 | 20 | 0 |
| Mode M0 | |||
|---|---|---|---|
| Quadrant | BADHDUFLAG | Total packets | Discarded packets |
| A | 0 | 13458 | 2 |
| B | 0 | 17226 | 2 |
| C | 0 | 13419 | 2 |
| D | 0 | 15059 | 2 |
| Mode SS | |||
|---|---|---|---|
| Quadrant | BADHDUFLAG | Total packets | Discarded packets |
| A | 0 | 124 | 0 |
| B | 0 | 124 | 0 |
| C | 0 | 124 | 0 |
| D | 0 | 124 | 0 |
| Quadrant | Total seconds | Saturated seconds | Saturation percentage |
|---|---|---|---|
| A | 6100 | 54 | 0.885246% |
| B | 6100 | 371 | 6.081967% |
| C | 6100 | 83 | 1.360656% |
| D | 6100 | 53 | 0.868852% |
Noise dominated data is calculated using 1-second bins in cleaned event files. If a bin has >2000 counts, and if more than 50% of those come from <1% of pixels, then it is considered to be noise-dominated and hence unusable.
| Quadrant | # 1 sec bins | Bins with >0 counts | Bins with >2000 counts | High rate bins dominated by noise | Noise dominated (total time) | Noise dominated (detector-on time) | Marked lightcurve |
|---|---|---|---|---|---|---|---|
| A | 7435 | 6101 | 0 | 0 | 0.00% | 0.00% |  |
| B | 7435 | 6101 | 239 | 239 | 3.21% | 3.92% |  |
| C | 7435 | 6101 | 0 | 0 | 0.00% | 0.00% |  |
| D | 7435 | 6101 | 8 | 8 | 0.11% | 0.13% | 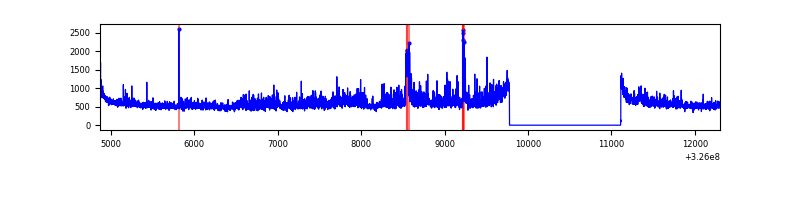 |
Top three noisy pixels from each quadrant. If the there are fewer than three noisy pixels in the level2.evt file, extra rows are filled as -1
| Pixel properties | Quadrant properties | ||||||
|---|---|---|---|---|---|---|---|
| Quadrant | DetID | PixID | Counts | Sigma | Mean | Median | Sigma |
| A | 13 | 254 | 8854 | 46.21 | 876 | 860 | 173.0 |
| A | 0 | 226 | 7568 | 38.78 | 876 | 860 | 173.0 |
| A | 3 | 137 | 7378 | 37.68 | 876 | 860 | 173.0 |
| B | 3 | 64 | 1078582 | 6734.17 | 854 | 838 | 160.0 |
| B | 12 | 111 | 19005 | 113.51 | 854 | 838 | 160.0 |
| B | 11 | 111 | 16963 | 100.76 | 854 | 838 | 160.0 |
| C | 14 | 238 | 133863 | 707.72 | 818 | 825 | 188.0 |
| C | 7 | 247 | 32858 | 170.41 | 818 | 825 | 188.0 |
| C | 13 | 61 | 5474 | 24.73 | 818 | 825 | 188.0 |
| D | 8 | 195 | 513086 | 2562.64 | 825 | 803 | 199.9 |
| D | 9 | 35 | 63663 | 314.45 | 825 | 803 | 199.9 |
| D | 1 | 52 | 62665 | 309.46 | 825 | 803 | 199.9 |
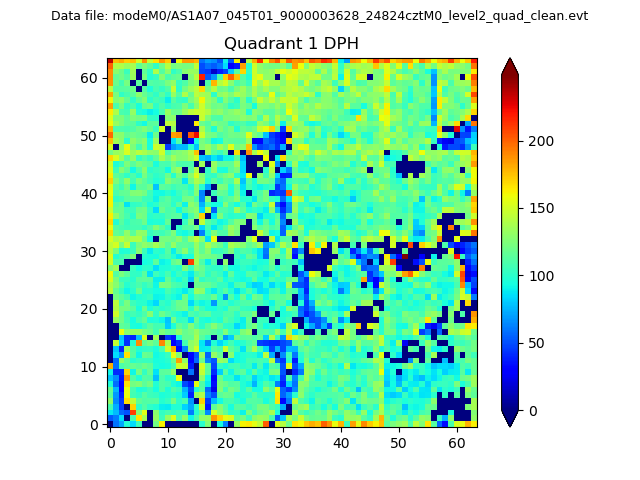
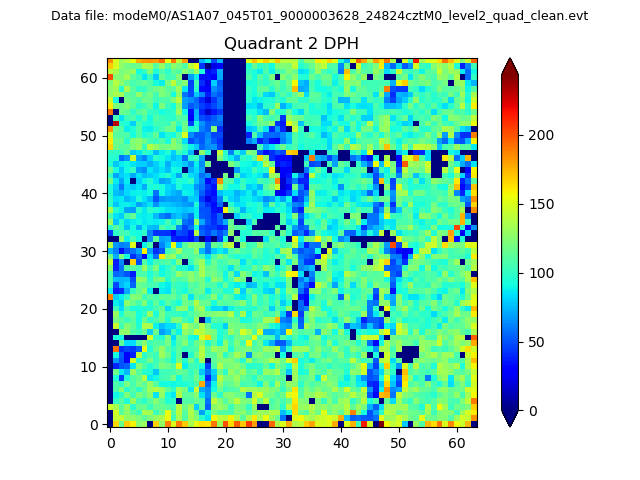
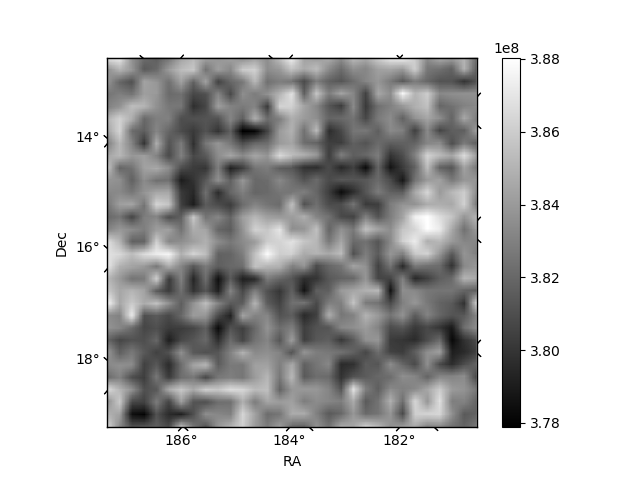
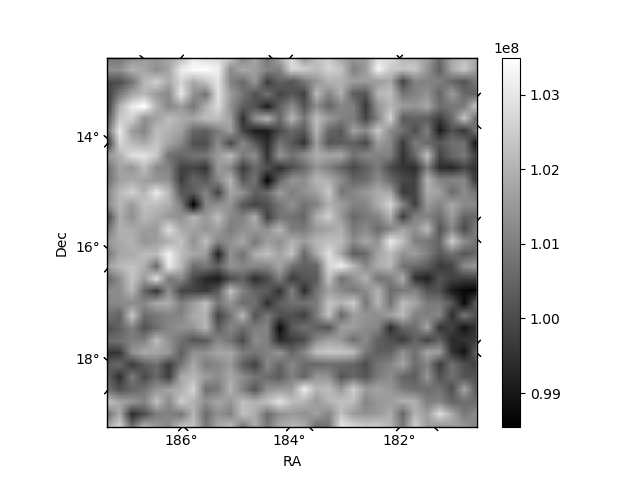
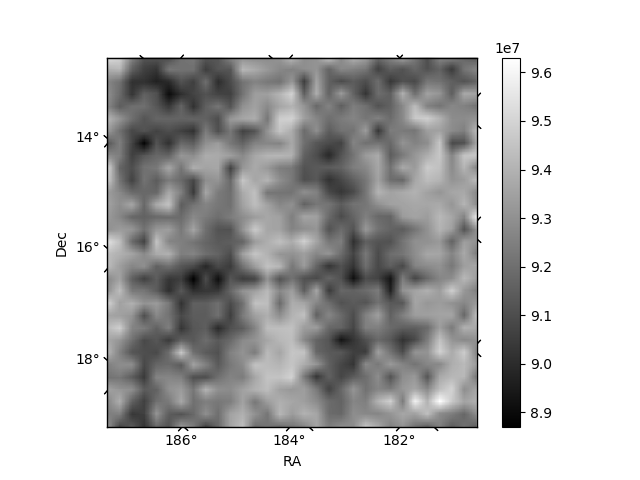
Histogram calculated using DETX and DETY for each event in the final _common_clean file
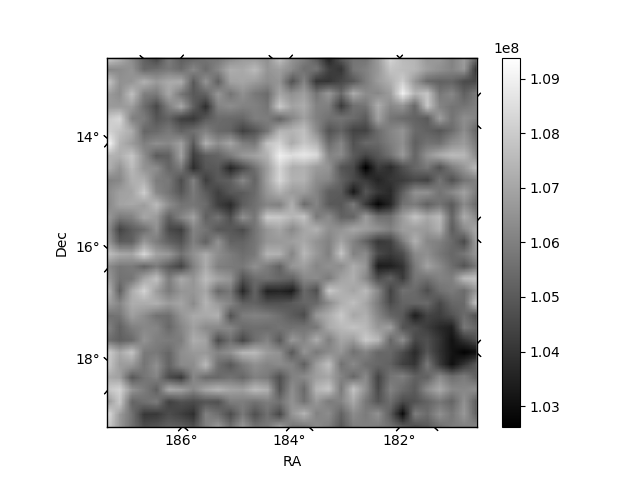
| Quadrant A |  |
 |
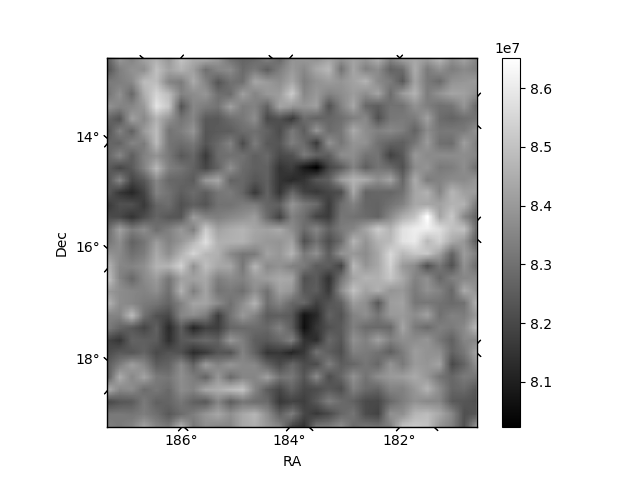
Quadrant B |
|---|---|---|---|
| Quadrant D |  |
 |
Quadrant C |
| Plot type | Count rate plots | Images |
|---|---|---|
| Comparison with Poisson distribution Blue bars denote a histogram of data divided into 1 sec bins. Red curve is a Poisson curve with rate = median count rate of data. |
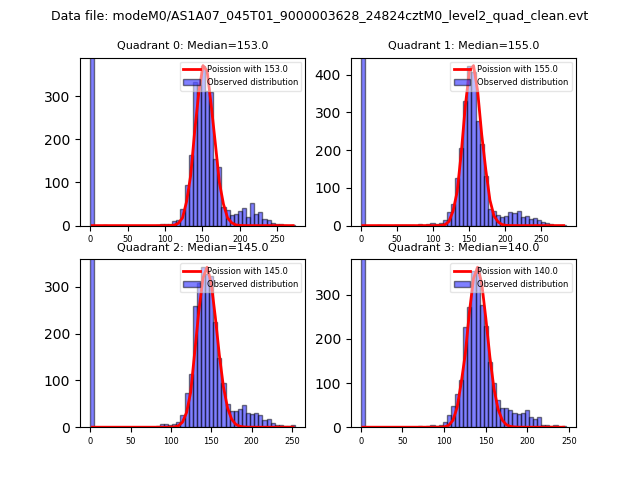 |
 |
| Quadrant-wise count rates Data is divided into 100 sec bins |
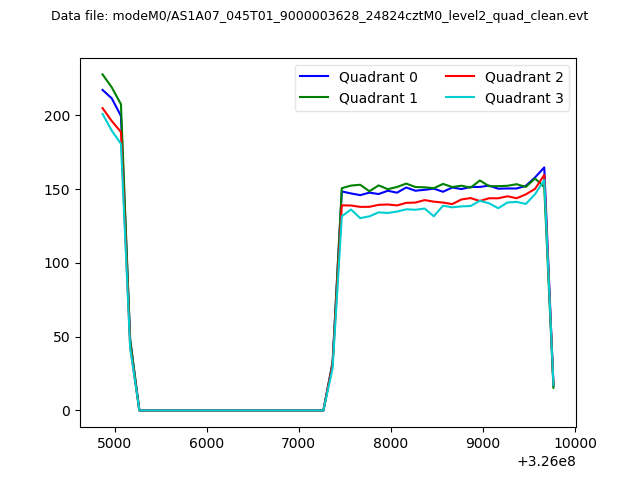 |
|
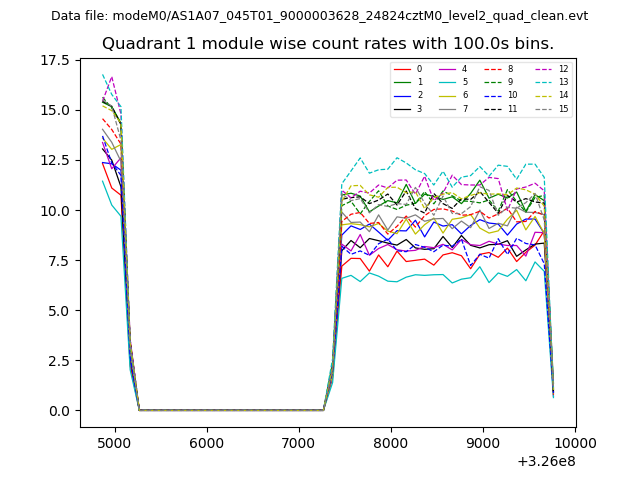
| Module-wise count rates for Quadrant A Data is divided into 100 sec bins |
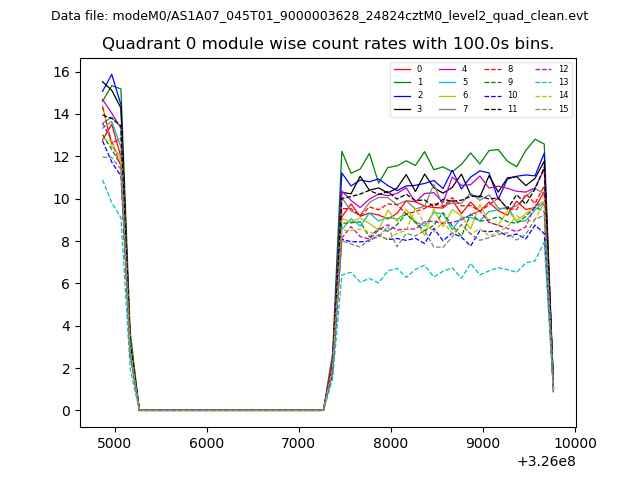 |
 |
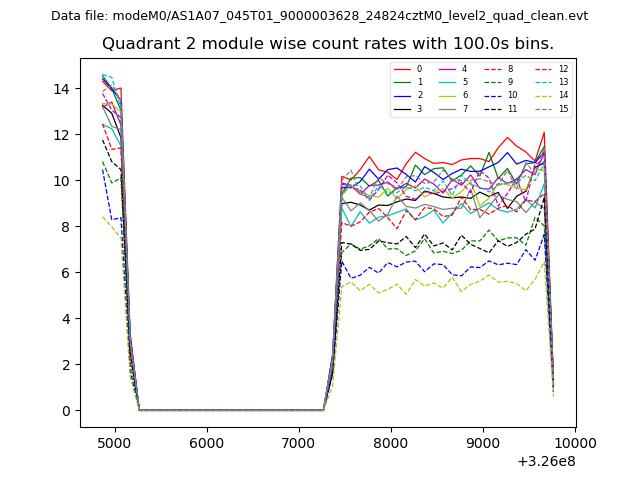
| Module-wise count rates for Quadrant B Data is divided into 100 sec bins |
 |
 |
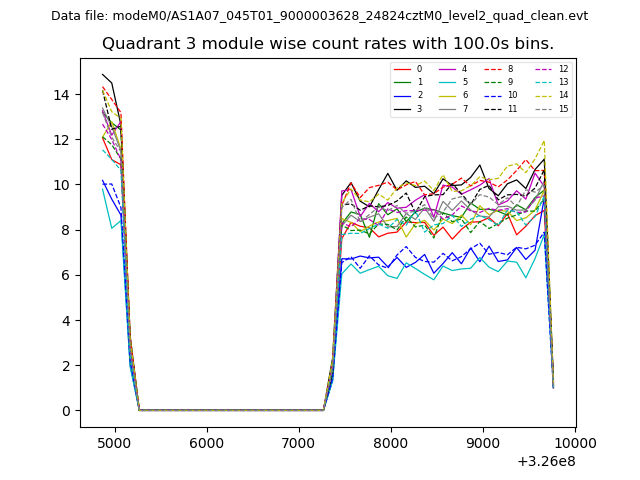
| Module-wise count rates for Quadrant C Data is divided into 100 sec bins |
 |
 |
| Module-wise count rates for Quadrant D Data is divided into 100 sec bins |
 |
 |
| Parameter | Plot |
|---|---|
| CZT HV Monitor | 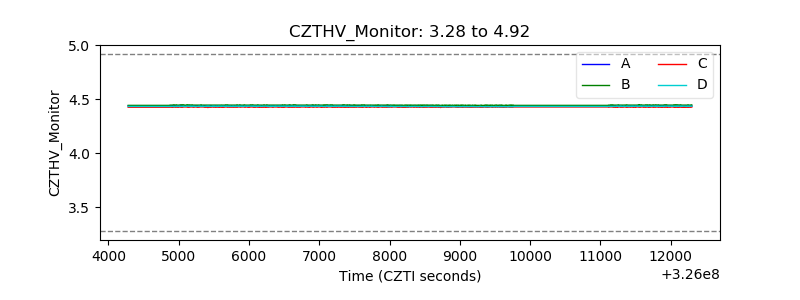 |
| D_VDD | 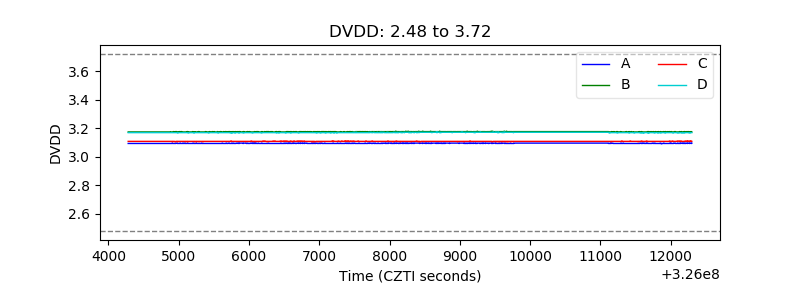 |
| Temperature 1 | 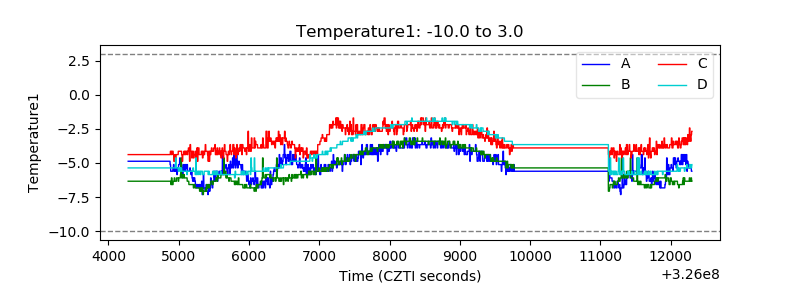 |
| Veto HV Monitor | 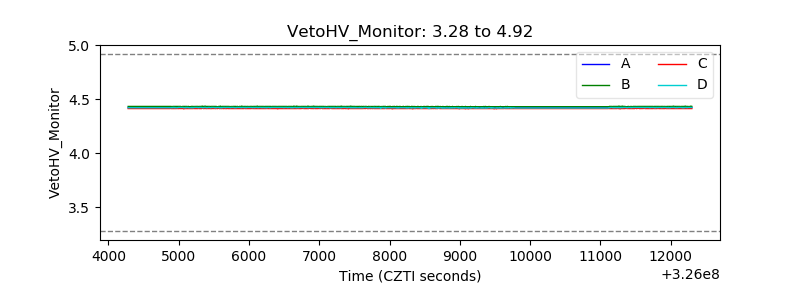 |
| Veto LLD | 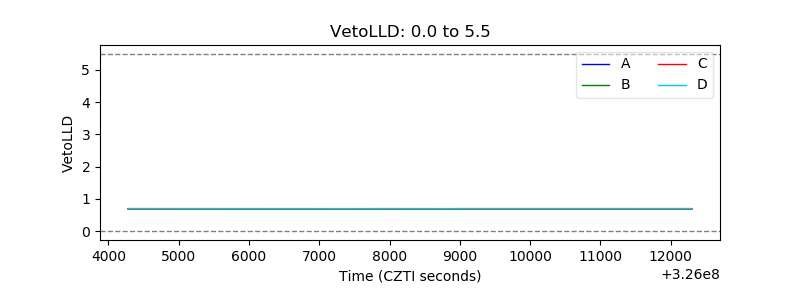 |
| Alpha Counter | 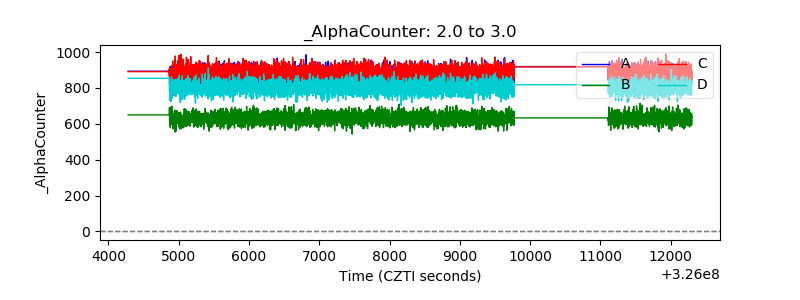 |
| _CPM_Rate | 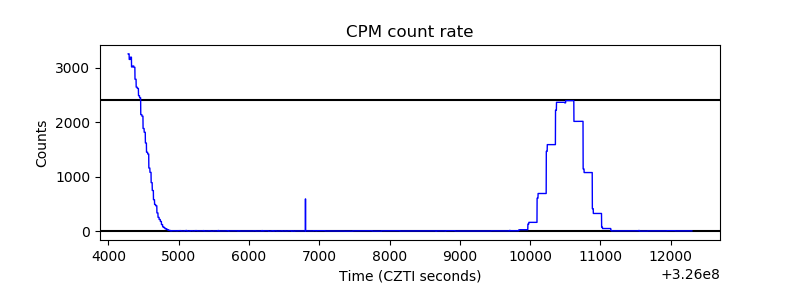 |
| CZT Counter | 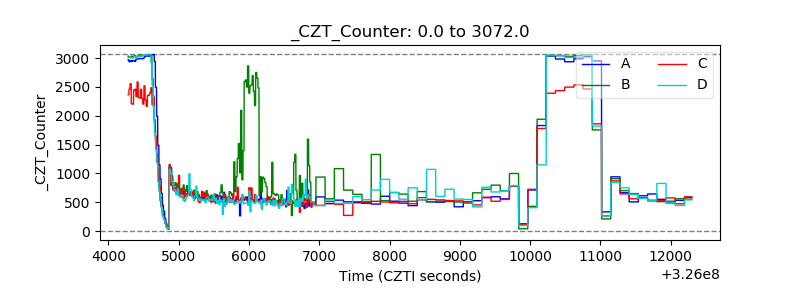 |
| +2.5 Volts monitor |  |
| +5 Volts monitor |  |
| _ROLL_ROT | 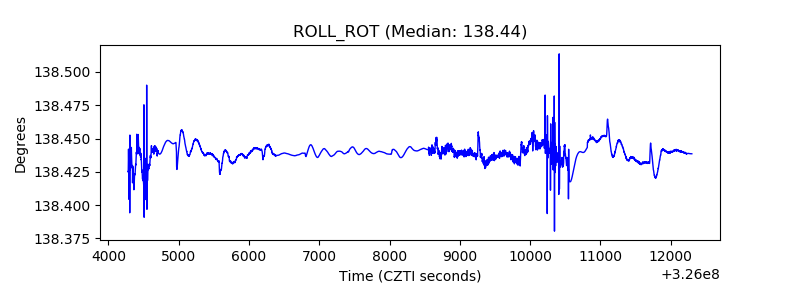 |
| _Roll_DEC | 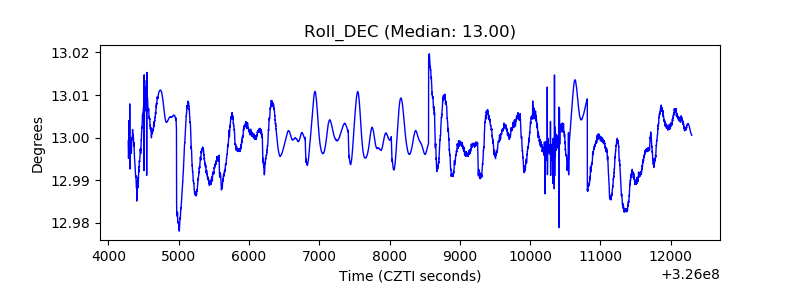 |
| _Roll_RA | 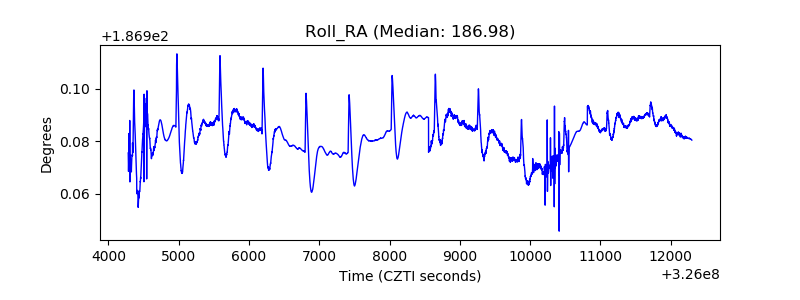 |
| Veto Counter | 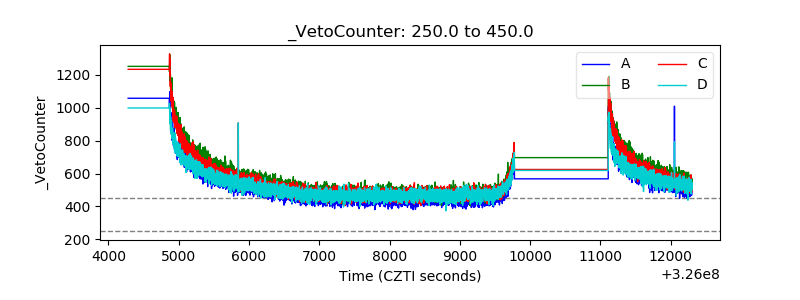 |