| Param | Original file | Final file |
|---|---|---|
| Filename | modeM0/AS1A07_045T01_9000003628_24825cztM0_level2.evt | modeM0/AS1A07_045T01_9000003628_24825cztM0_level2_quad_clean.evt |
| Size (bytes) | 538,660,800 | 67,991,040 |
| Size | 513.7 MB | 64.8 MB |
| Events in quadrant A | 3,520,185 | 417,713 |
| Events in quadrant B | 4,048,376 | 416,317 |
| Events in quadrant C | 4,138,412 | 389,799 |
| Events in quadrant D | 4,167,850 | 383,114 |
| Mode M9 | |||
|---|---|---|---|
| Quadrant | BADHDUFLAG | Total packets | Discarded packets |
| A | 0 | 18 | 0 |
| B | 0 | 19 | 0 |
| C | 0 | 19 | 0 |
| D | 0 | 19 | 0 |
| Mode M0 | |||
|---|---|---|---|
| Quadrant | BADHDUFLAG | Total packets | Discarded packets |
| A | 0 | 14017 | 2 |
| B | 0 | 15847 | 2 |
| C | 0 | 16720 | 3 |
| D | 0 | 16631 | 2 |
| Mode SS | |||
|---|---|---|---|
| Quadrant | BADHDUFLAG | Total packets | Discarded packets |
| A | 0 | 132 | 0 |
| B | 0 | 132 | 0 |
| C | 0 | 132 | 0 |
| D | 0 | 132 | 0 |
| Quadrant | Total seconds | Saturated seconds | Saturation percentage |
|---|---|---|---|
| A | 6473 | 51 | 0.787888% |
| B | 6473 | 173 | 2.672640% |
| C | 6472 | 131 | 2.024104% |
| D | 6472 | 28 | 0.432633% |
Noise dominated data is calculated using 1-second bins in cleaned event files. If a bin has >2000 counts, and if more than 50% of those come from <1% of pixels, then it is considered to be noise-dominated and hence unusable.
| Quadrant | # 1 sec bins | Bins with >0 counts | Bins with >2000 counts | High rate bins dominated by noise | Noise dominated (total time) | Noise dominated (detector-on time) | Marked lightcurve |
|---|---|---|---|---|---|---|---|
| A | 7773 | 6474 | 0 | 0 | 0.00% | 0.00% | 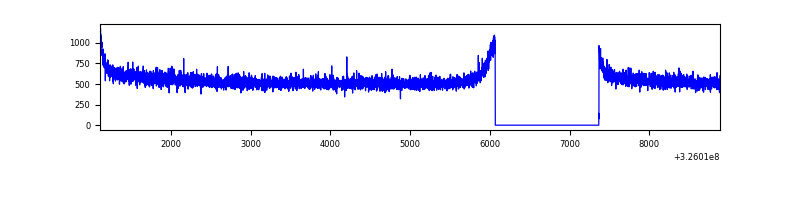 |
| B | 7773 | 6474 | 61 | 61 | 0.78% | 0.94% | 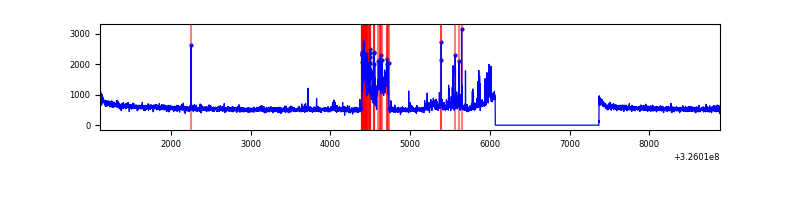 |
| C | 7772 | 6473 | 0 | 0 | 0.00% | 0.00% | 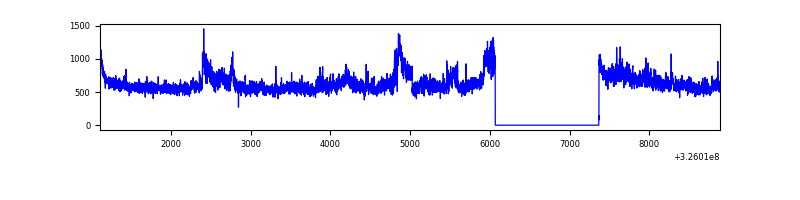 |
| D | 7772 | 6473 | 3 | 3 | 0.04% | 0.05% | 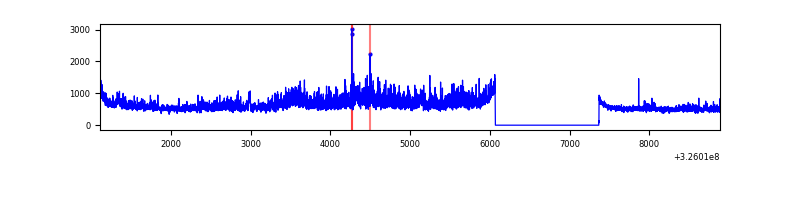 |
Top three noisy pixels from each quadrant. If the there are fewer than three noisy pixels in the level2.evt file, extra rows are filled as -1
| Pixel properties | Quadrant properties | ||||||
|---|---|---|---|---|---|---|---|
| Quadrant | DetID | PixID | Counts | Sigma | Mean | Median | Sigma |
| A | 13 | 254 | 8639 | 42.39 | 914 | 898 | 182.6 |
| A | 3 | 137 | 7900 | 38.34 | 914 | 898 | 182.6 |
| A | 0 | 226 | 7621 | 36.81 | 914 | 898 | 182.6 |
| B | 3 | 64 | 512702 | 3006.42 | 900 | 880 | 170.2 |
| B | 12 | 111 | 20260 | 113.83 | 900 | 880 | 170.2 |
| B | 11 | 111 | 18369 | 102.73 | 900 | 880 | 170.2 |
| C | 7 | 247 | 684728 | 3507.06 | 848 | 856 | 195.0 |
| C | 14 | 238 | 137499 | 700.74 | 848 | 856 | 195.0 |
| C | 13 | 61 | 5872 | 25.72 | 848 | 856 | 195.0 |
| D | 8 | 195 | 825516 | 4001.8 | 861 | 838 | 206.1 |
| D | 1 | 52 | 87419 | 420.14 | 861 | 838 | 206.1 |
| D | 2 | 234 | 21978 | 102.58 | 861 | 838 | 206.1 |
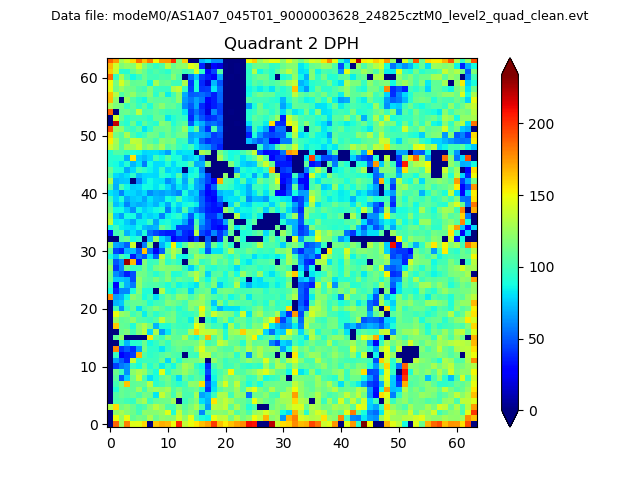
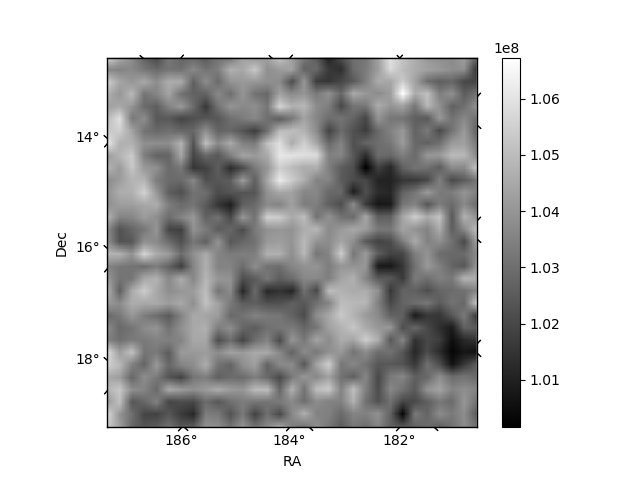
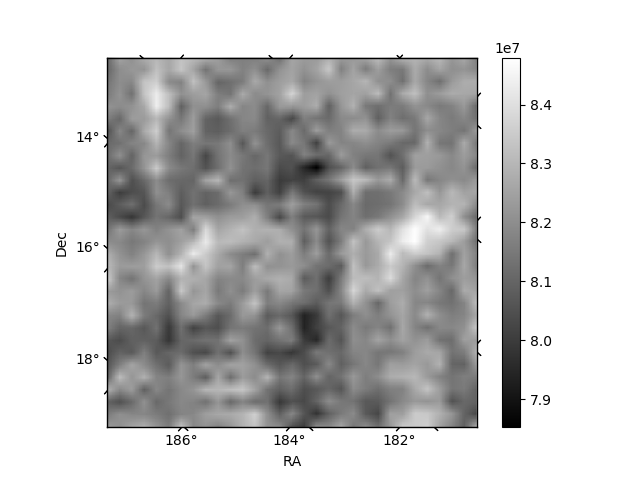
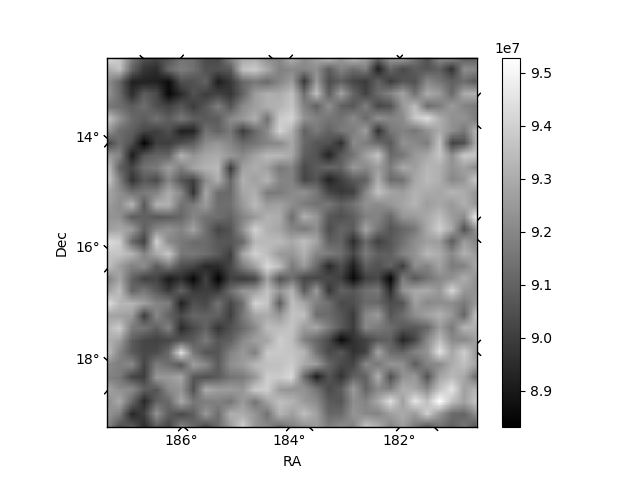
Histogram calculated using DETX and DETY for each event in the final _common_clean file
| Quadrant A | 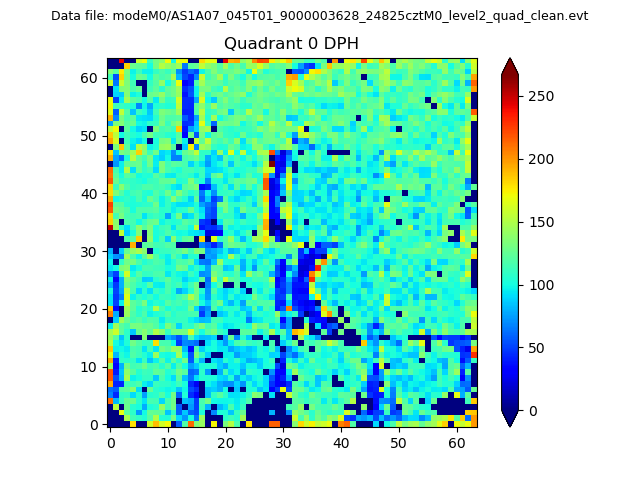 |
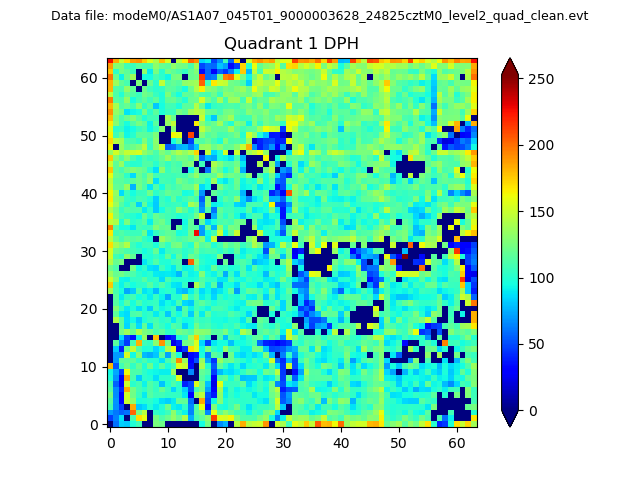 |
Quadrant B |
|---|---|---|---|
| Quadrant D | 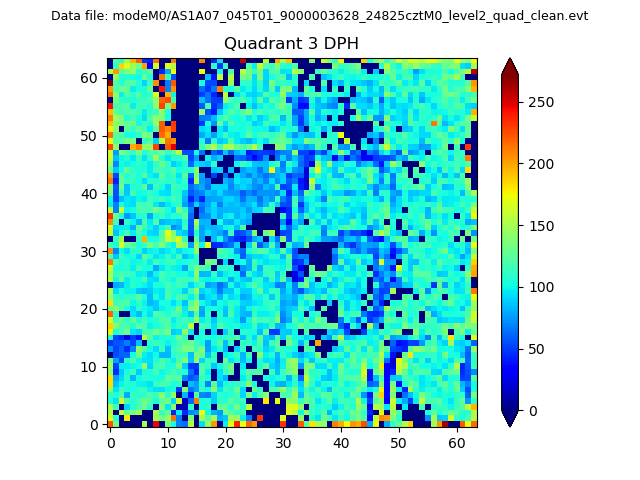 |
 |
Quadrant C |
| Plot type | Count rate plots | Images |
|---|---|---|
| Comparison with Poisson distribution Blue bars denote a histogram of data divided into 1 sec bins. Red curve is a Poisson curve with rate = median count rate of data. |
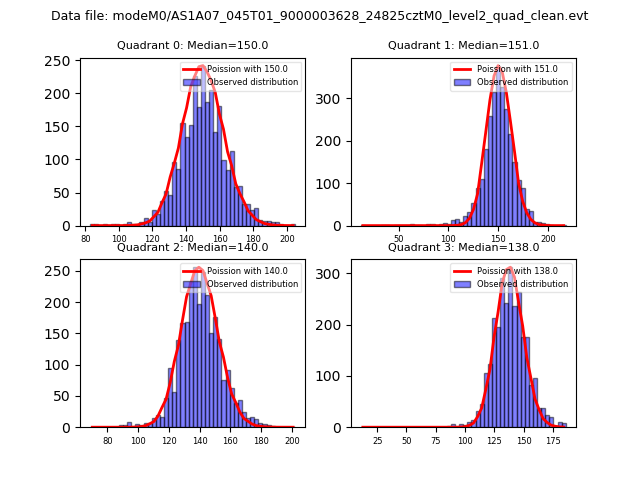 |
 |
| Quadrant-wise count rates Data is divided into 100 sec bins |
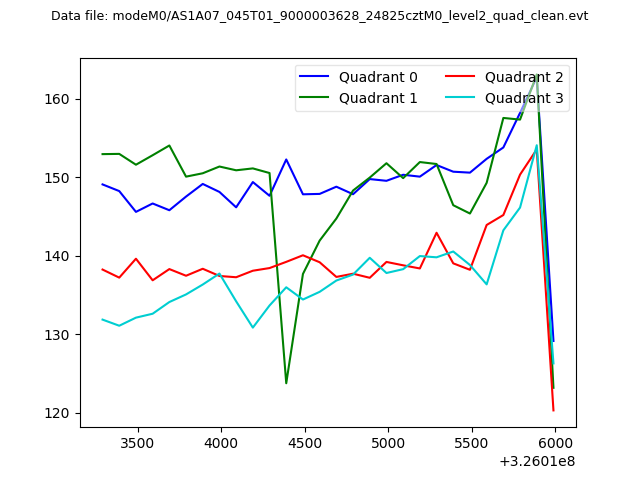 |
|
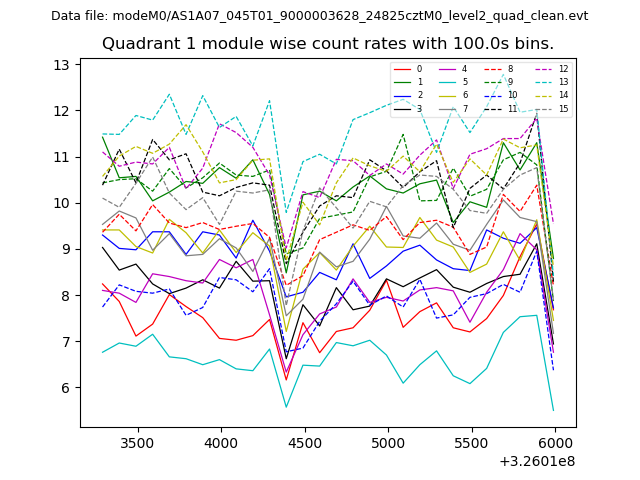
| Module-wise count rates for Quadrant A Data is divided into 100 sec bins |
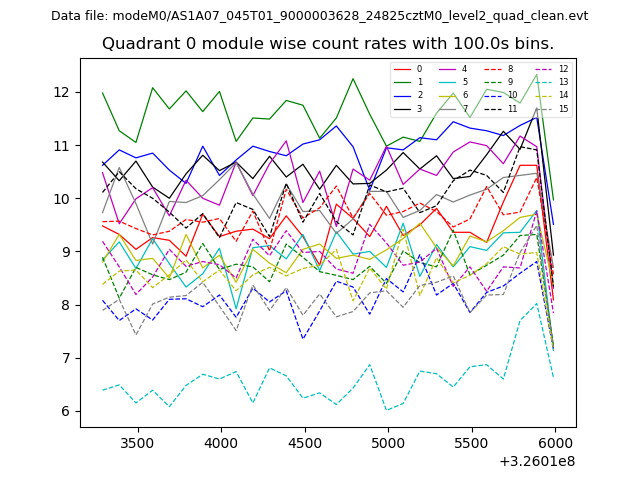 |
 |
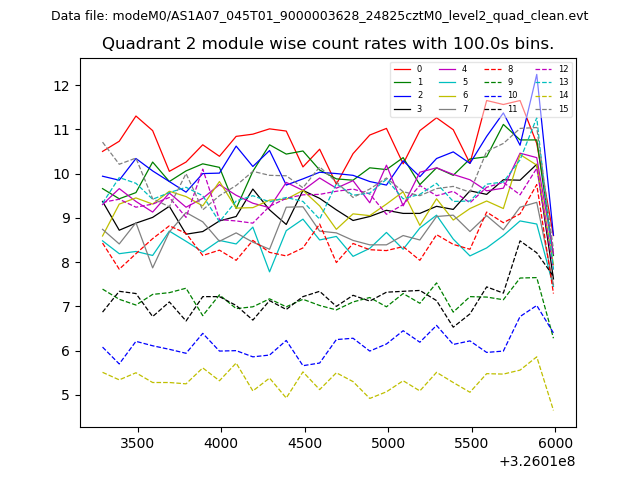
| Module-wise count rates for Quadrant B Data is divided into 100 sec bins |
 |
 |
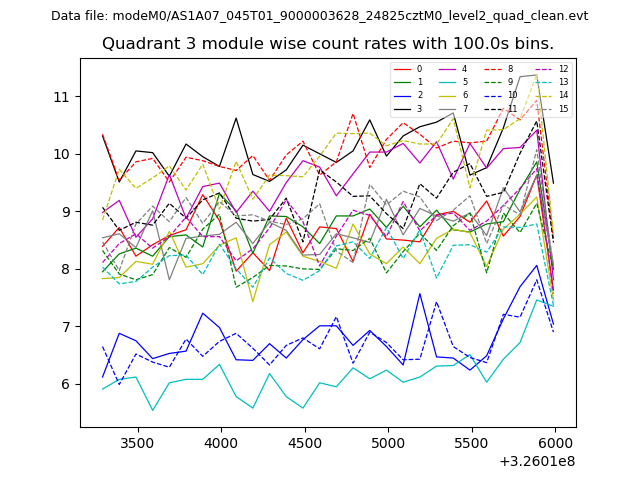
| Module-wise count rates for Quadrant C Data is divided into 100 sec bins |
 |
 |
| Module-wise count rates for Quadrant D Data is divided into 100 sec bins |
 |
 |
| Parameter | Plot |
|---|---|
| CZT HV Monitor | 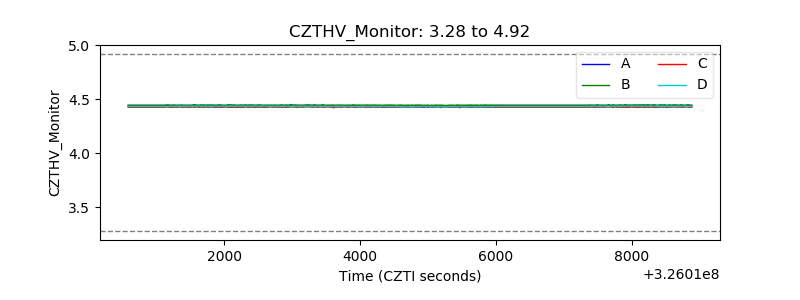 |
| D_VDD |  |
| Temperature 1 | 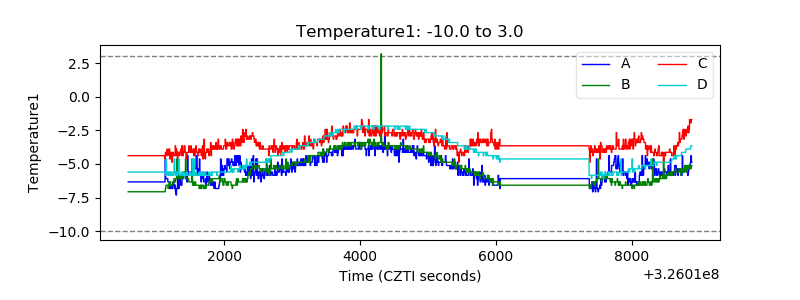 |
| Veto HV Monitor | 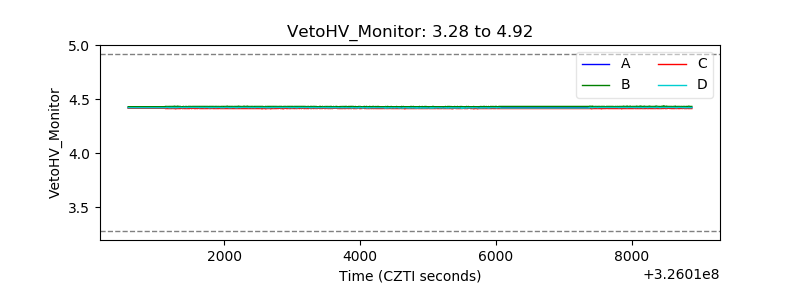 |
| Veto LLD | 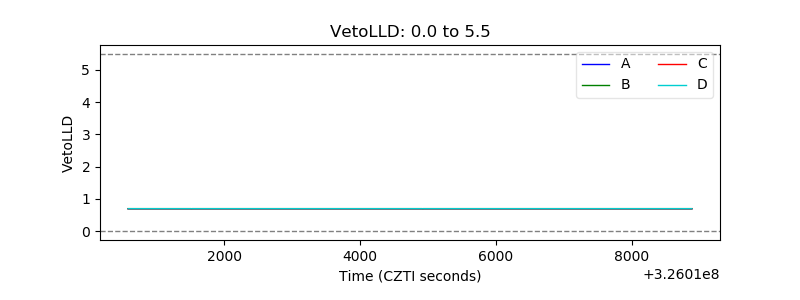 |
| Alpha Counter | 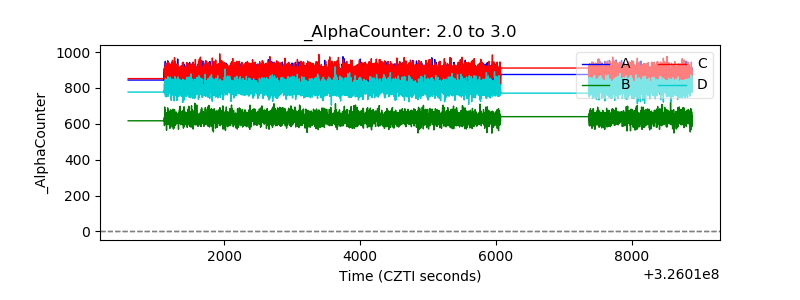 |
| _CPM_Rate | 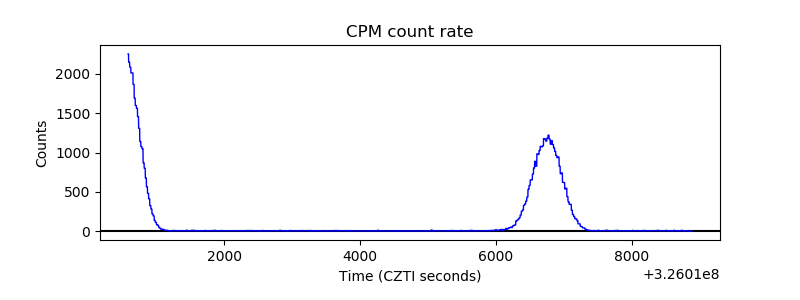 |
| CZT Counter | 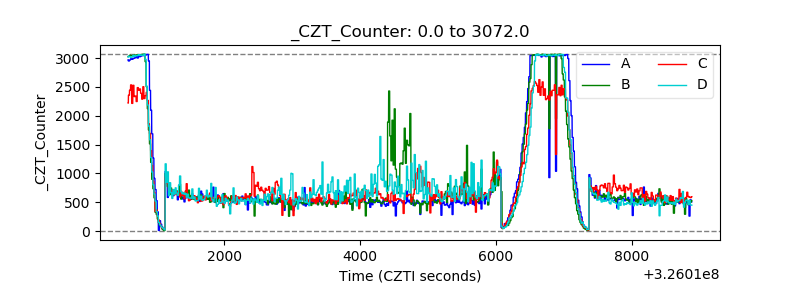 |
| +2.5 Volts monitor |  |
| +5 Volts monitor |  |
| _ROLL_ROT | 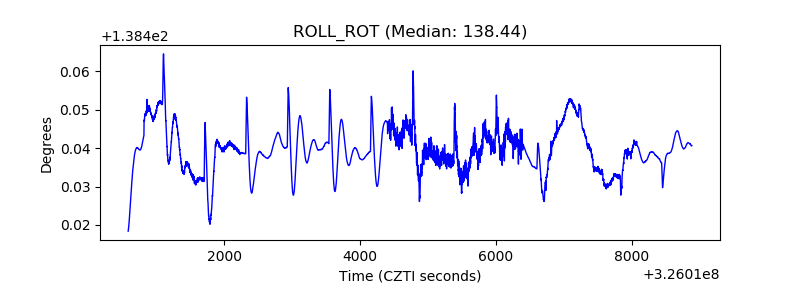 |
| _Roll_DEC | 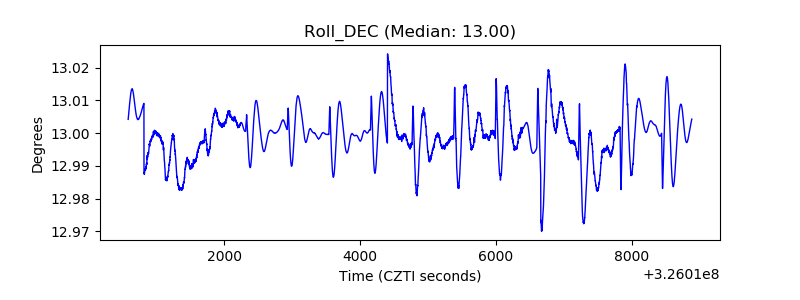 |
| _Roll_RA |  |
| Veto Counter | 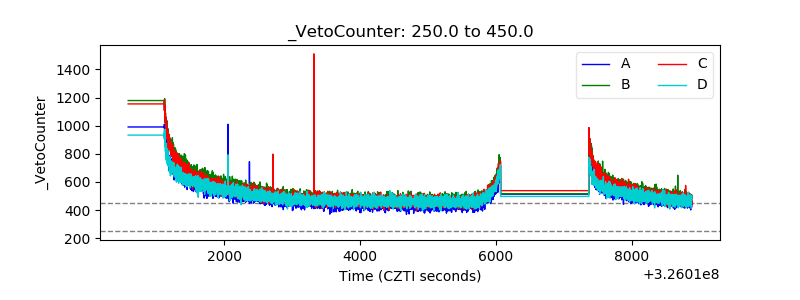 |