| Param | Original file | Final file |
|---|---|---|
| Filename | modeM0/AS1A07_045T01_9000003628_24828cztM0_level2.evt | modeM0/AS1A07_045T01_9000003628_24828cztM0_level2_quad_clean.evt |
| Size (bytes) | 458,709,120 | 90,679,680 |
| Size | 437.5 MB | 86.5 MB |
| Events in quadrant A | 3,182,024 | 586,079 |
| Events in quadrant B | 3,584,613 | 590,042 |
| Events in quadrant C | 3,249,501 | 557,864 |
| Events in quadrant D | 3,427,374 | 552,020 |
| Mode M9 | |||
|---|---|---|---|
| Quadrant | BADHDUFLAG | Total packets | Discarded packets |
| A | 0 | 3 | 0 |
| B | 0 | 3 | 0 |
| C | 0 | 3 | 0 |
| D | 0 | 3 | 0 |
| Mode M0 | |||
|---|---|---|---|
| Quadrant | BADHDUFLAG | Total packets | Discarded packets |
| A | 0 | 13567 | 2 |
| B | 0 | 14815 | 1 |
| C | 0 | 13662 | 1 |
| D | 0 | 14354 | 1 |
| Mode SS | |||
|---|---|---|---|
| Quadrant | BADHDUFLAG | Total packets | Discarded packets |
| A | 0 | 134 | 0 |
| B | 0 | 134 | 0 |
| C | 0 | 134 | 0 |
| D | 0 | 134 | 0 |
| Quadrant | Total seconds | Saturated seconds | Saturation percentage |
|---|---|---|---|
| A | 6597 | 129 | 1.955434% |
| B | 6598 | 190 | 2.879661% |
| C | 6598 | 170 | 2.576538% |
| D | 6598 | 92 | 1.394362% |
Noise dominated data is calculated using 1-second bins in cleaned event files. If a bin has >2000 counts, and if more than 50% of those come from <1% of pixels, then it is considered to be noise-dominated and hence unusable.
| Quadrant | # 1 sec bins | Bins with >0 counts | Bins with >2000 counts | High rate bins dominated by noise | Noise dominated (total time) | Noise dominated (detector-on time) | Marked lightcurve |
|---|---|---|---|---|---|---|---|
| A | 6897 | 6598 | 0 | 0 | 0.00% | 0.00% | 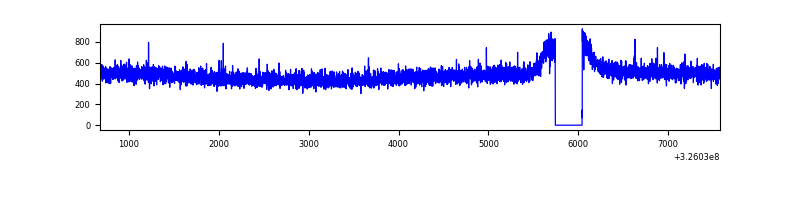 |
| B | 6898 | 6599 | 31 | 31 | 0.45% | 0.47% | 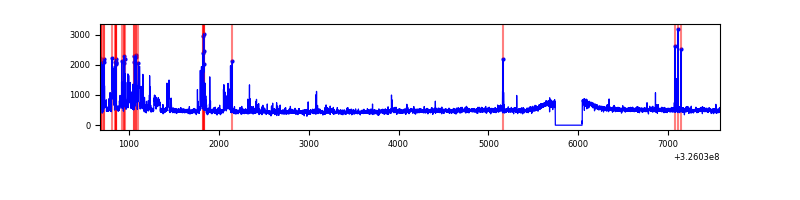 |
| C | 6898 | 6599 | 0 | 0 | 0.00% | 0.00% | 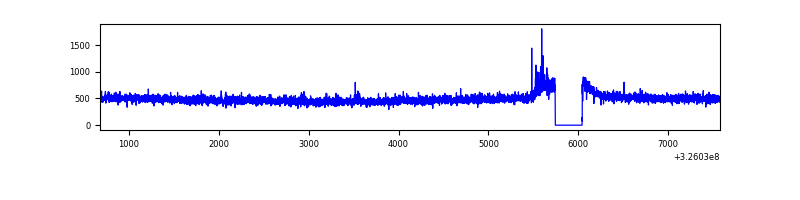 |
| D | 6898 | 6599 | 3 | 3 | 0.04% | 0.05% | 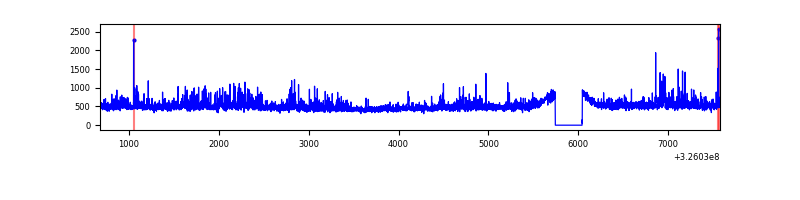 |
Top three noisy pixels from each quadrant. If the there are fewer than three noisy pixels in the level2.evt file, extra rows are filled as -1
| Pixel properties | Quadrant properties | ||||||
|---|---|---|---|---|---|---|---|
| Quadrant | DetID | PixID | Counts | Sigma | Mean | Median | Sigma |
| A | 13 | 254 | 9616 | 52.51 | 825 | 807 | 167.7 |
| A | 3 | 137 | 7834 | 41.89 | 825 | 807 | 167.7 |
| A | 0 | 226 | 6950 | 36.62 | 825 | 807 | 167.7 |
| B | 3 | 64 | 359605 | 2263.05 | 813 | 789 | 158.6 |
| B | 12 | 111 | 19681 | 119.15 | 813 | 789 | 158.6 |
| B | 11 | 111 | 18134 | 109.39 | 813 | 789 | 158.6 |
| C | 14 | 238 | 125343 | 671.24 | 786 | 790 | 185.6 |
| C | 7 | 247 | 32681 | 171.87 | 786 | 790 | 185.6 |
| C | 5 | 112 | 22709 | 118.12 | 786 | 790 | 185.6 |
| D | 8 | 195 | 340687 | 1735.99 | 801 | 778 | 195.8 |
| D | 1 | 52 | 49076 | 246.67 | 801 | 778 | 195.8 |
| D | 2 | 234 | 25967 | 128.65 | 801 | 778 | 195.8 |
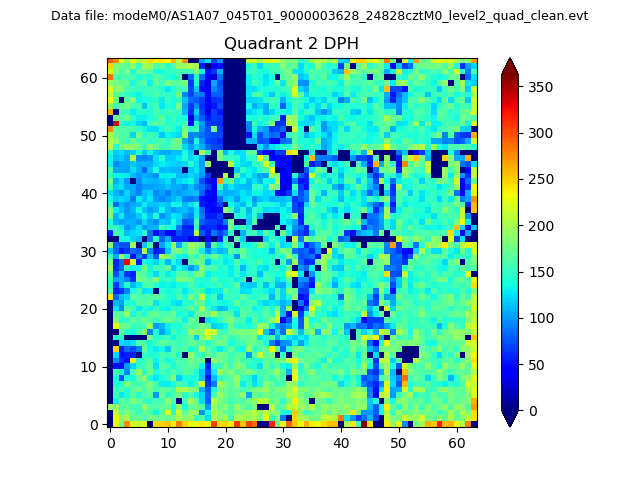
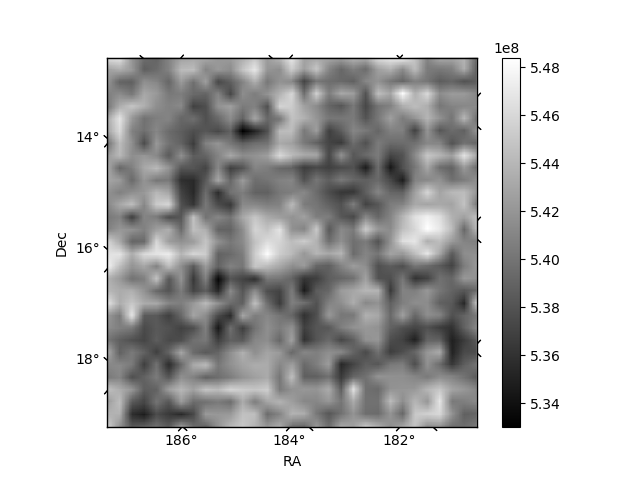
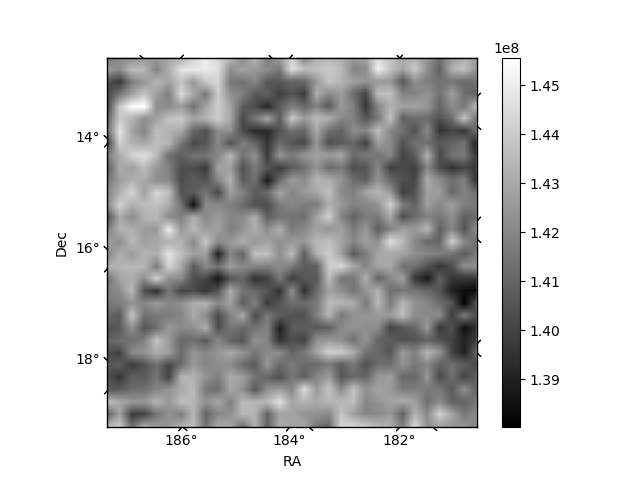
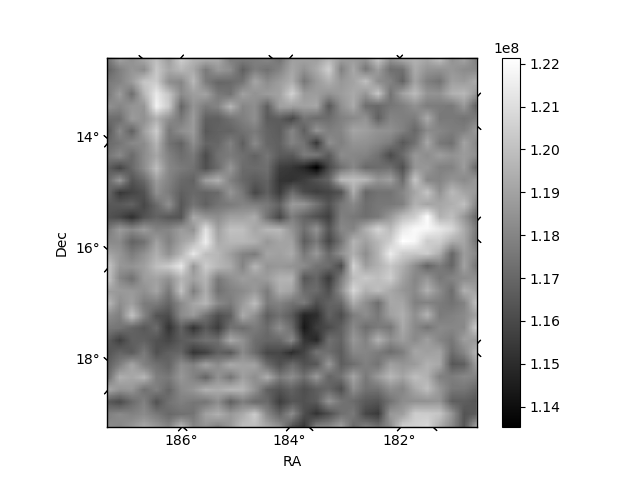
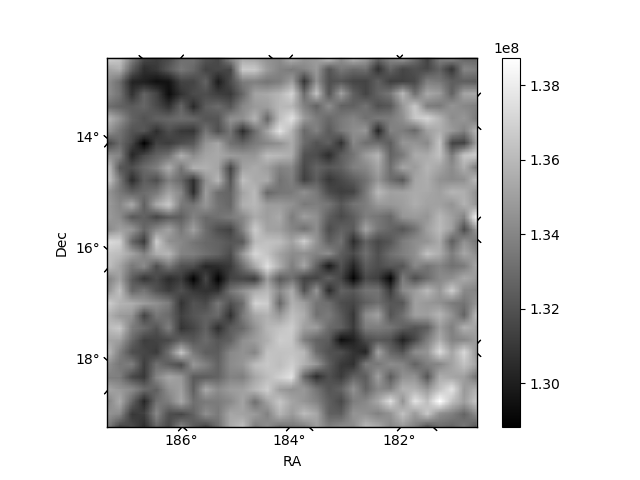
Histogram calculated using DETX and DETY for each event in the final _common_clean file
| Quadrant A | 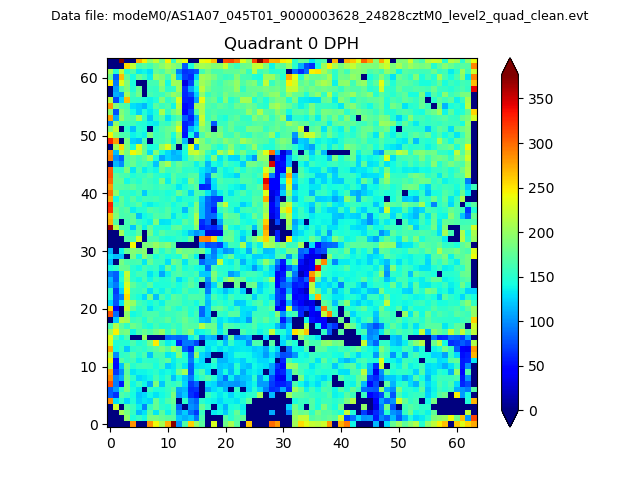 |
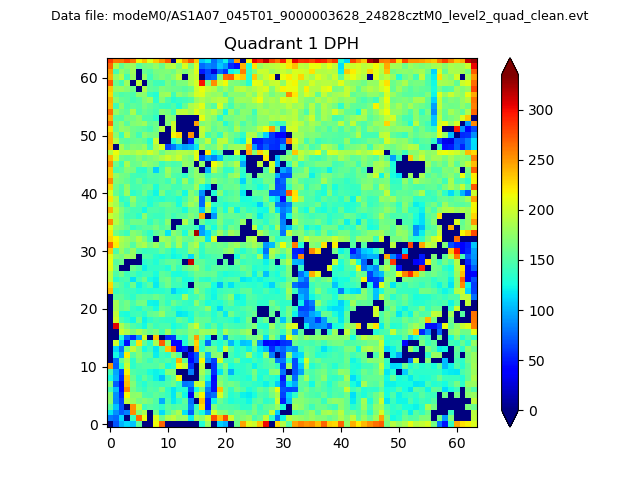 |
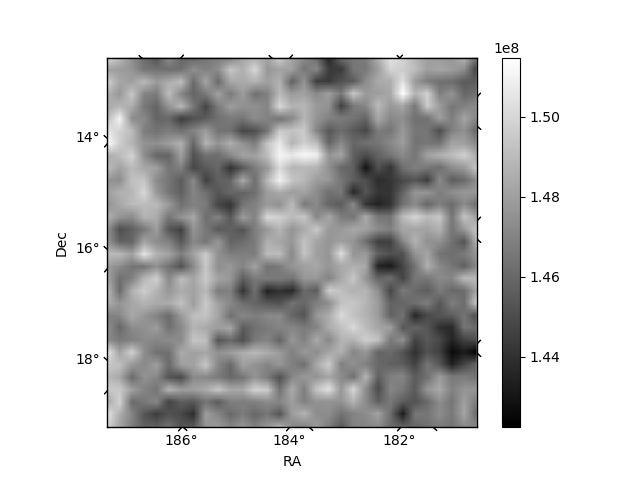
Quadrant B |
|---|---|---|---|
| Quadrant D | 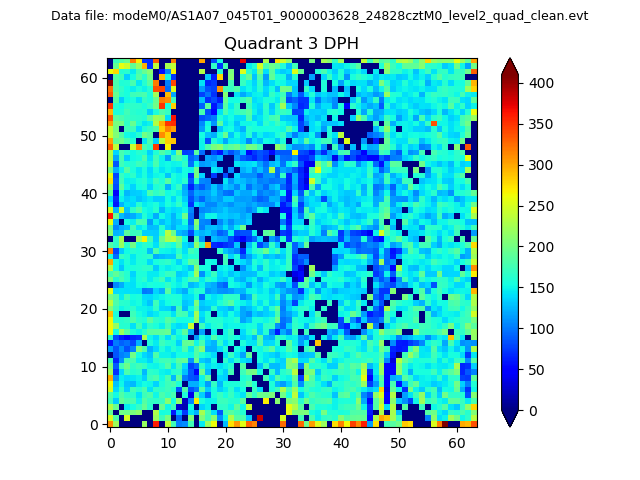 |
 |
Quadrant C |
| Plot type | Count rate plots | Images |
|---|---|---|
| Comparison with Poisson distribution Blue bars denote a histogram of data divided into 1 sec bins. Red curve is a Poisson curve with rate = median count rate of data. |
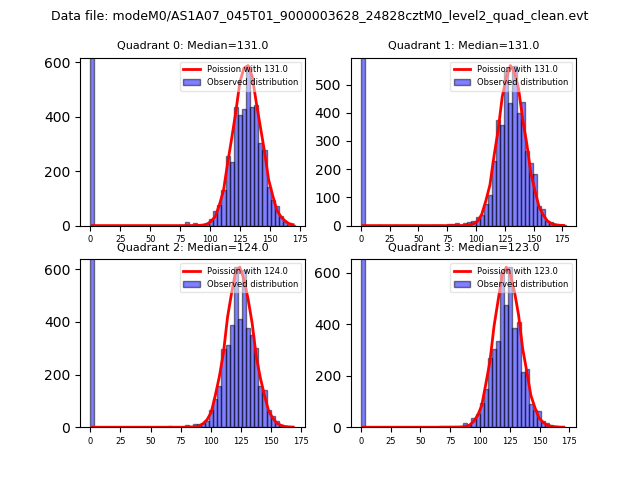 |
 |
| Quadrant-wise count rates Data is divided into 100 sec bins |
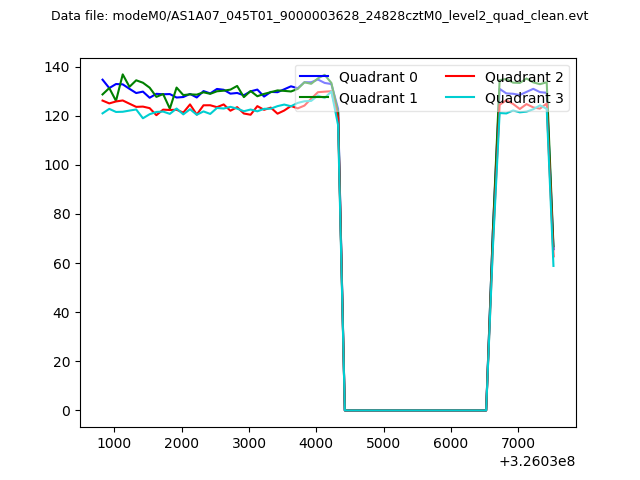 |
|
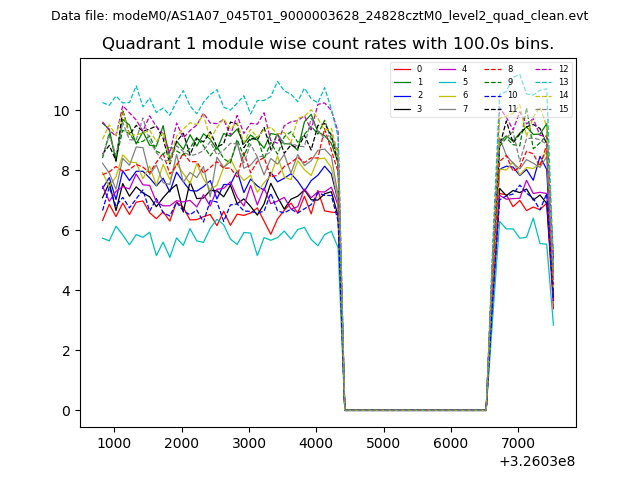
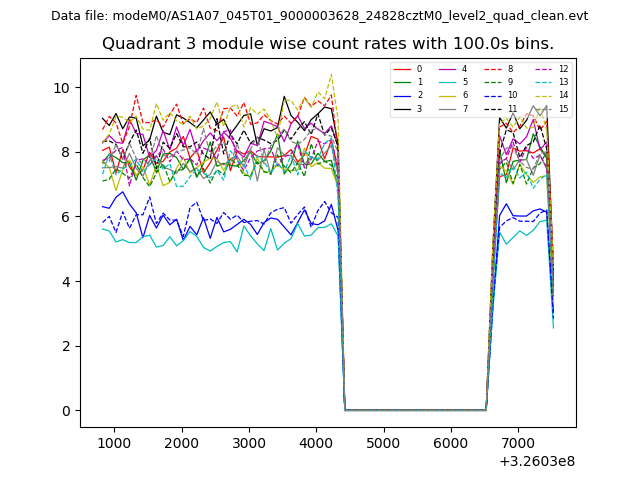
| Module-wise count rates for Quadrant A Data is divided into 100 sec bins |
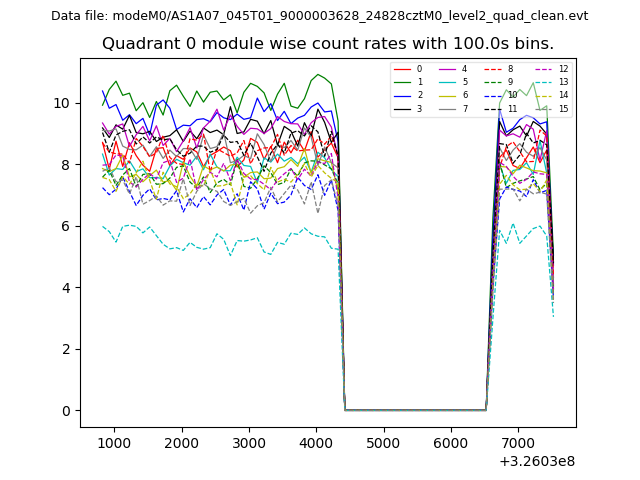 |
 |
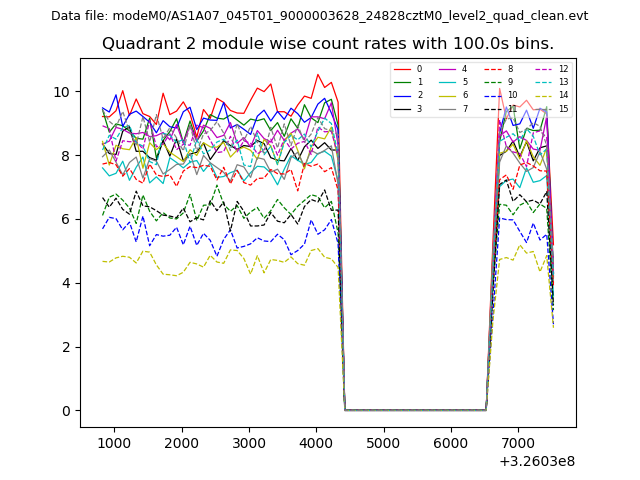
| Module-wise count rates for Quadrant B Data is divided into 100 sec bins |
 |
 |
| Module-wise count rates for Quadrant C Data is divided into 100 sec bins |
 |
 |
| Module-wise count rates for Quadrant D Data is divided into 100 sec bins |
 |
 |
| Parameter | Plot |
|---|---|
| CZT HV Monitor | 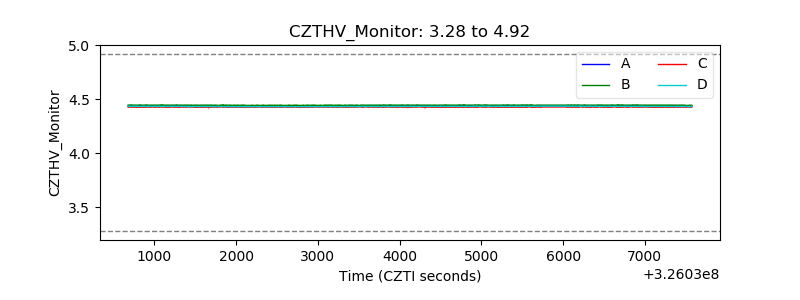 |
| D_VDD | 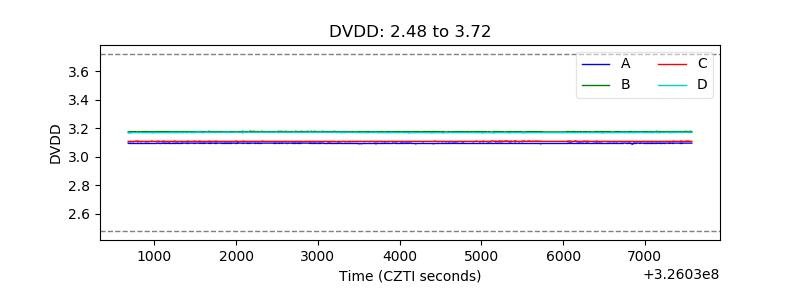 |
| Temperature 1 | 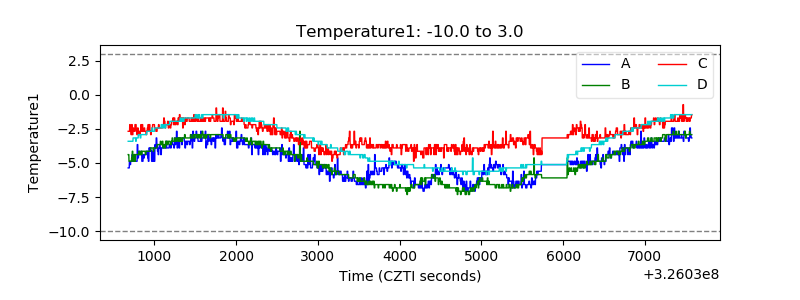 |
| Veto HV Monitor | 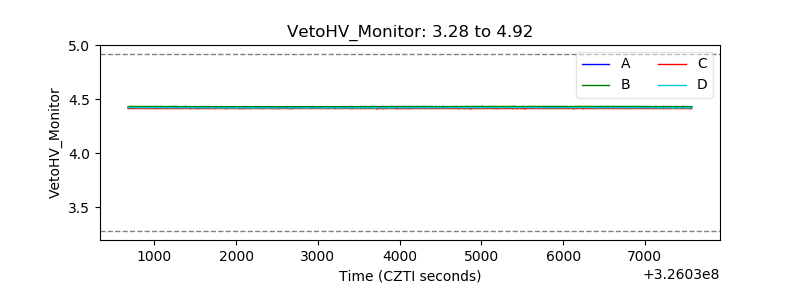 |
| Veto LLD | 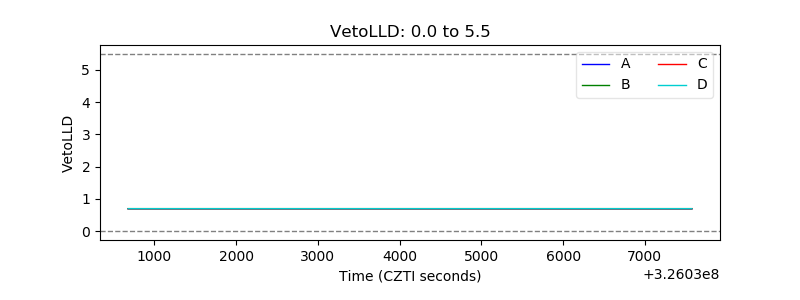 |
| Alpha Counter | 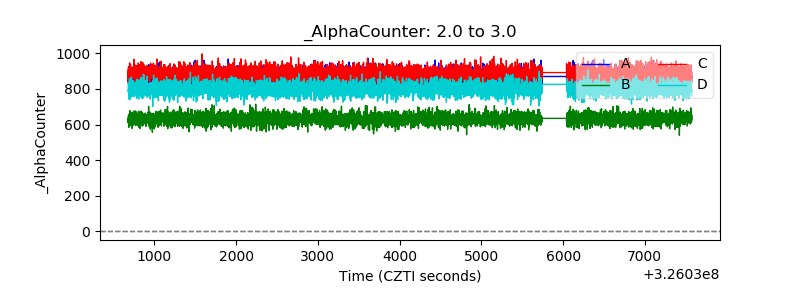 |
| _CPM_Rate | 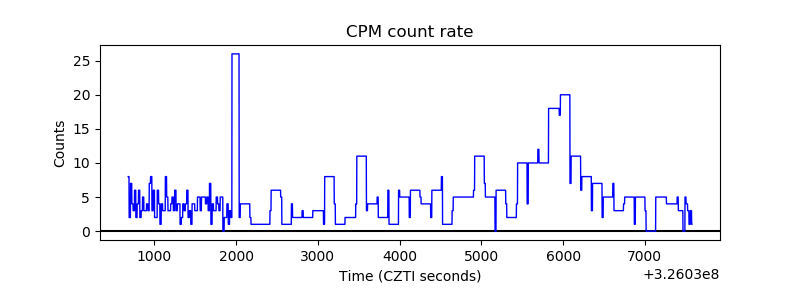 |
| CZT Counter | 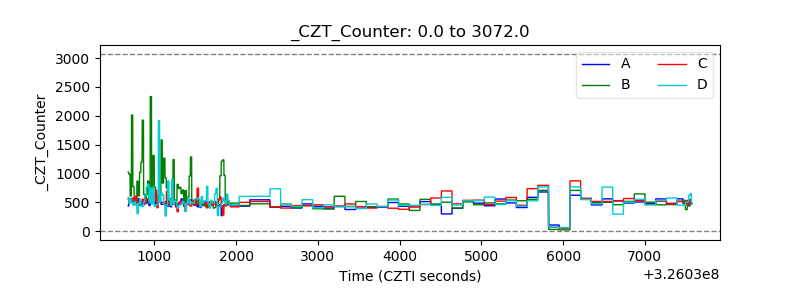 |
| +2.5 Volts monitor |  |
| +5 Volts monitor |  |
| _ROLL_ROT | 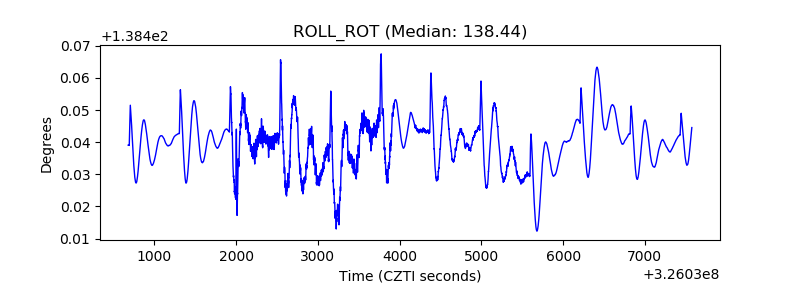 |
| _Roll_DEC | 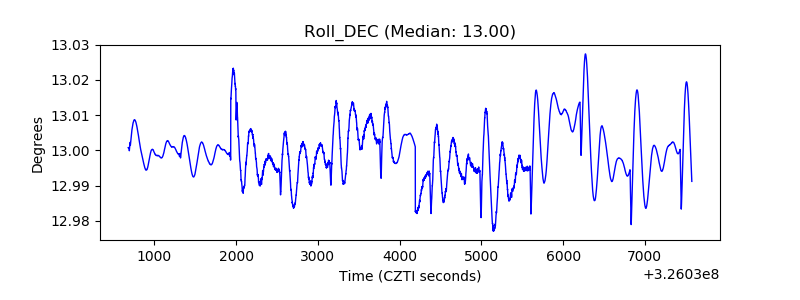 |
| _Roll_RA | 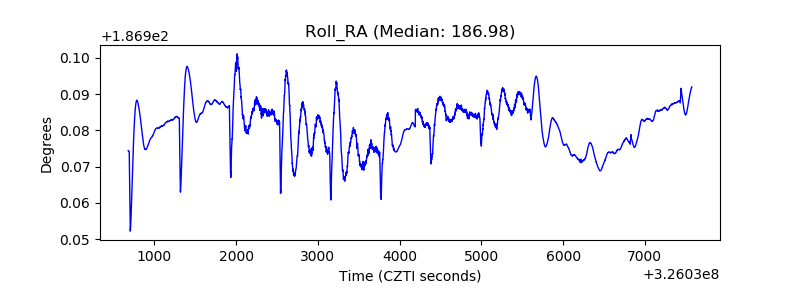 |
| Veto Counter | 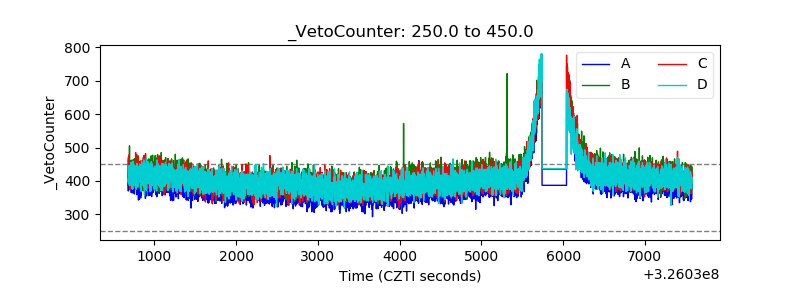 |