| Param | Original file | Final file |
|---|---|---|
| Filename | modeM0/AS1A07_045T01_9000003628_24829cztM0_level2.evt | modeM0/AS1A07_045T01_9000003628_24829cztM0_level2_quad_clean.evt |
| Size (bytes) | 183,432,960 | 40,147,200 |
| Size | 174.9 MB | 38.3 MB |
| Events in quadrant A | 1,313,264 | 261,941 |
| Events in quadrant B | 1,332,385 | 265,663 |
| Events in quadrant C | 1,313,254 | 249,862 |
| Events in quadrant D | 1,412,374 | 246,215 |
| Mode M9 | |||
|---|---|---|---|
| Quadrant | BADHDUFLAG | Total packets | Discarded packets |
| A | 0 | 2 | 0 |
| B | 0 | 3 | 0 |
| C | 0 | 3 | 0 |
| D | 0 | 3 | 0 |
| Mode M0 | |||
|---|---|---|---|
| Quadrant | BADHDUFLAG | Total packets | Discarded packets |
| A | 0 | 5532 | 1 |
| B | 0 | 5606 | 1 |
| C | 0 | 5541 | 1 |
| D | 0 | 5862 | 1 |
| Mode SS | |||
|---|---|---|---|
| Quadrant | BADHDUFLAG | Total packets | Discarded packets |
| A | 0 | 56 | 0 |
| B | 0 | 56 | 0 |
| C | 0 | 56 | 0 |
| D | 0 | 56 | 0 |
| Quadrant | Total seconds | Saturated seconds | Saturation percentage |
|---|---|---|---|
| A | 2673 | 30 | 1.122334% |
| B | 2673 | 47 | 1.758324% |
| C | 2673 | 51 | 1.907969% |
| D | 2673 | 9 | 0.336700% |
Noise dominated data is calculated using 1-second bins in cleaned event files. If a bin has >2000 counts, and if more than 50% of those come from <1% of pixels, then it is considered to be noise-dominated and hence unusable.
| Quadrant | # 1 sec bins | Bins with >0 counts | Bins with >2000 counts | High rate bins dominated by noise | Noise dominated (total time) | Noise dominated (detector-on time) | Marked lightcurve |
|---|---|---|---|---|---|---|---|
| A | 2673 | 2673 | 0 | 0 | 0.00% | 0.00% | 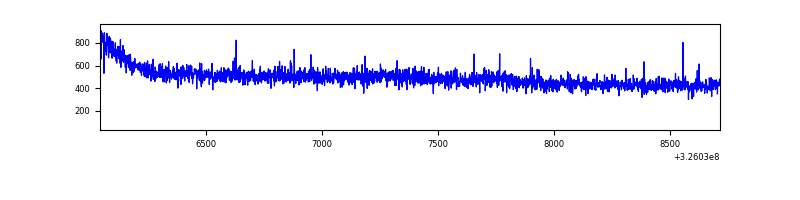 |
| B | 2673 | 2673 | 3 | 3 | 0.11% | 0.11% | 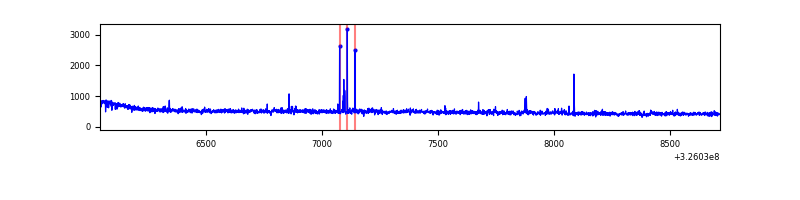 |
| C | 2673 | 2673 | 0 | 0 | 0.00% | 0.00% | 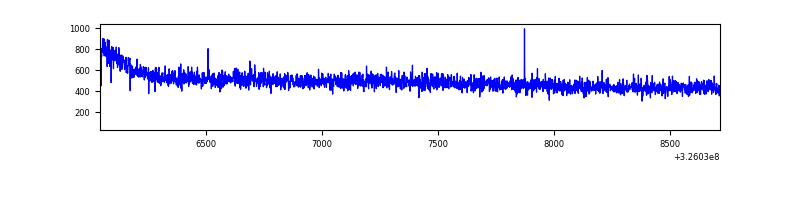 |
| D | 2673 | 2673 | 2 | 2 | 0.07% | 0.07% | 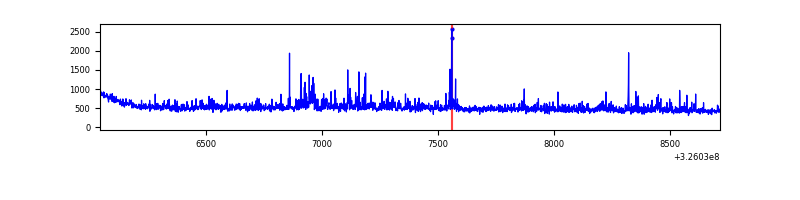 |
Top three noisy pixels from each quadrant. If the there are fewer than three noisy pixels in the level2.evt file, extra rows are filled as -1
| Pixel properties | Quadrant properties | ||||||
|---|---|---|---|---|---|---|---|
| Quadrant | DetID | PixID | Counts | Sigma | Mean | Median | Sigma |
| A | 13 | 254 | 3369 | 43.26 | 339 | 331 | 70.2 |
| A | 3 | 137 | 3209 | 40.98 | 339 | 331 | 70.2 |
| A | 0 | 226 | 2991 | 37.88 | 339 | 331 | 70.2 |
| B | 4 | 80 | 10965 | 160.91 | 333 | 324 | 66.1 |
| B | 0 | 190 | 8944 | 130.35 | 333 | 324 | 66.1 |
| B | 12 | 111 | 8180 | 118.8 | 333 | 324 | 66.1 |
| C | 14 | 238 | 52464 | 667.4 | 323 | 325 | 78.1 |
| C | 13 | 61 | 2209 | 24.12 | 323 | 325 | 78.1 |
| C | 7 | 247 | 1763 | 18.41 | 323 | 325 | 78.1 |
| D | 8 | 195 | 112381 | 1372.52 | 331 | 321 | 81.6 |
| D | 1 | 52 | 34015 | 412.69 | 331 | 321 | 81.6 |
| D | 2 | 234 | 10720 | 127.37 | 331 | 321 | 81.6 |
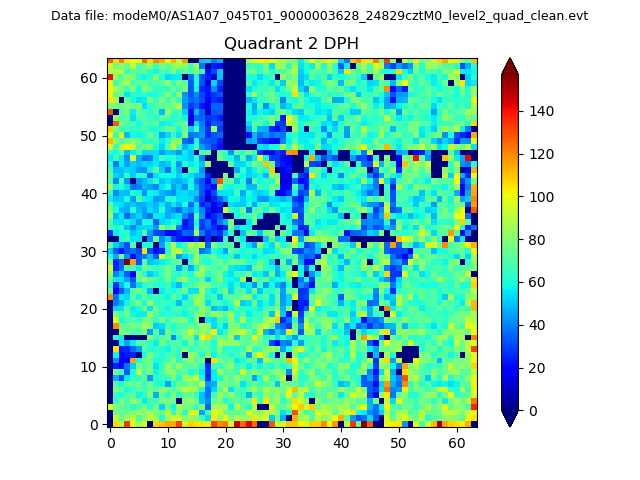
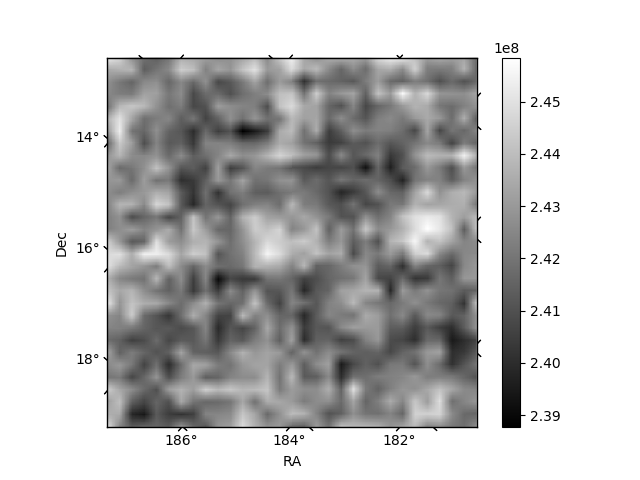
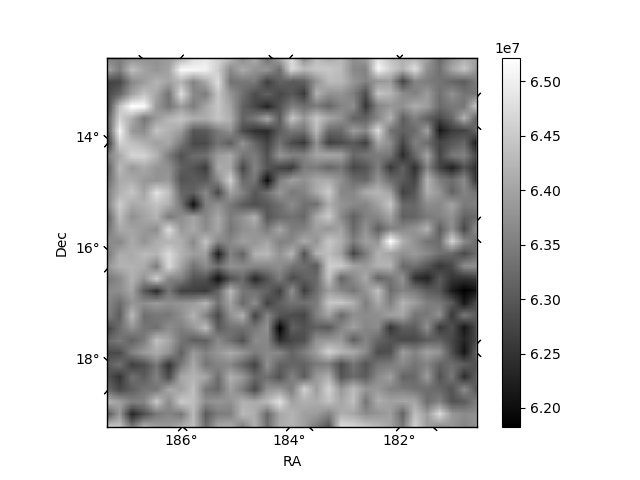
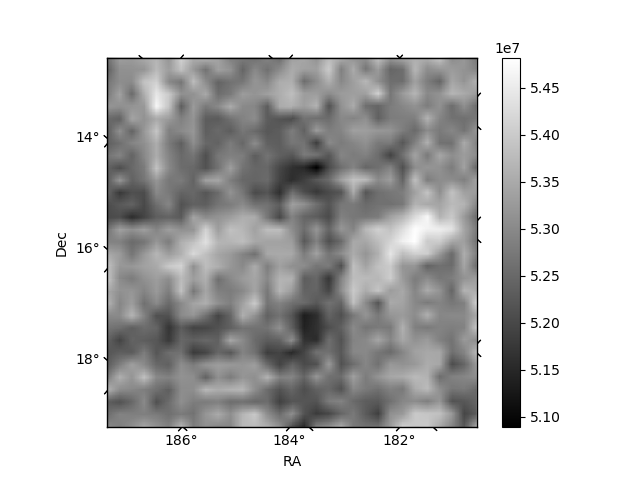
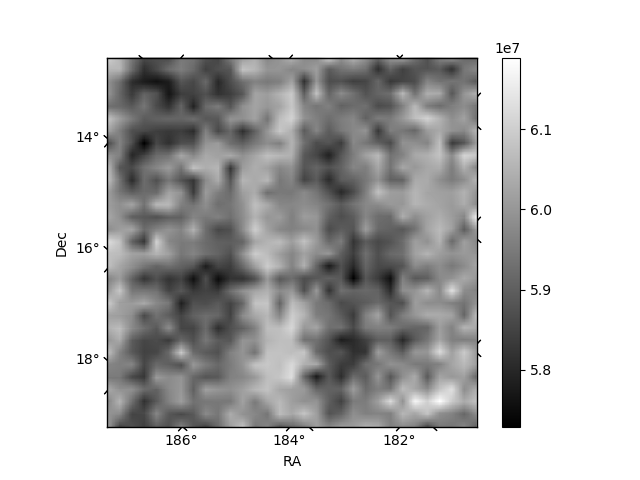
Histogram calculated using DETX and DETY for each event in the final _common_clean file
| Quadrant A | 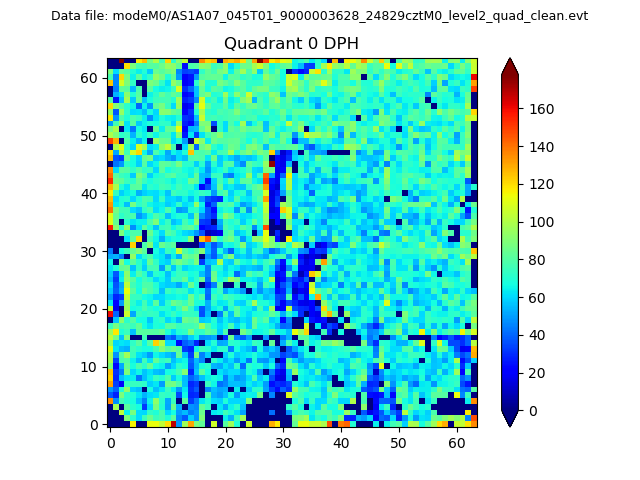 |
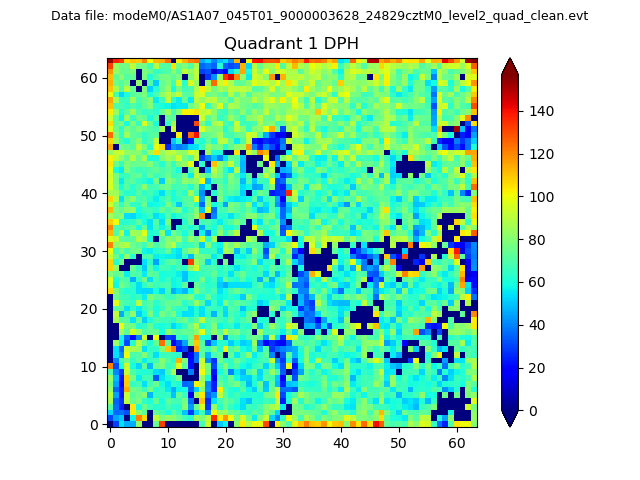 |
Quadrant B |
|---|---|---|---|
| Quadrant D | 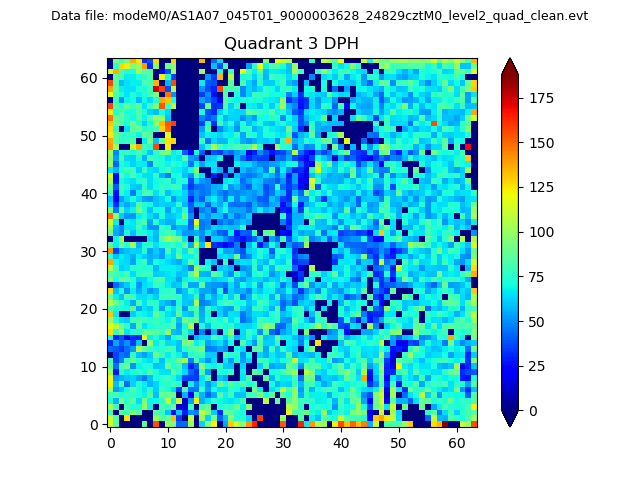 |
 |
Quadrant C |
| Plot type | Count rate plots | Images |
|---|---|---|
| Comparison with Poisson distribution Blue bars denote a histogram of data divided into 1 sec bins. Red curve is a Poisson curve with rate = median count rate of data. |
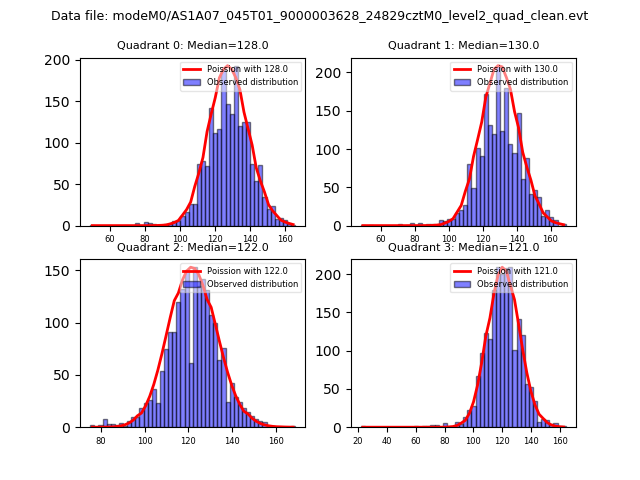 |
 |
| Quadrant-wise count rates Data is divided into 100 sec bins |
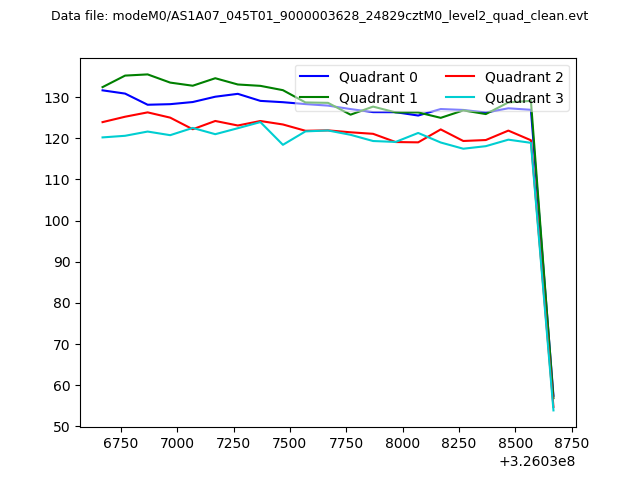 |
|
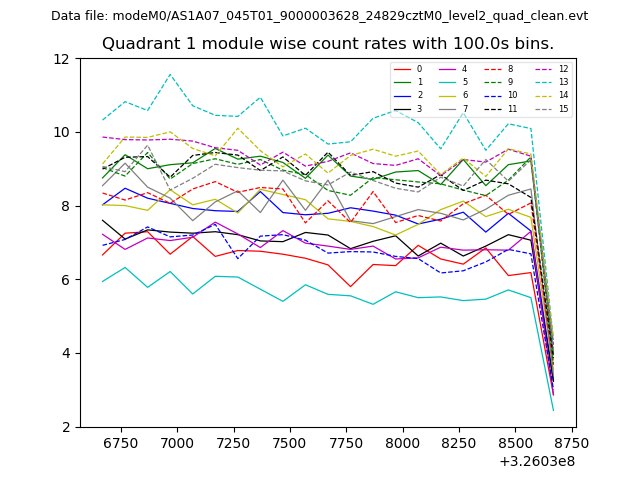
| Module-wise count rates for Quadrant A Data is divided into 100 sec bins |
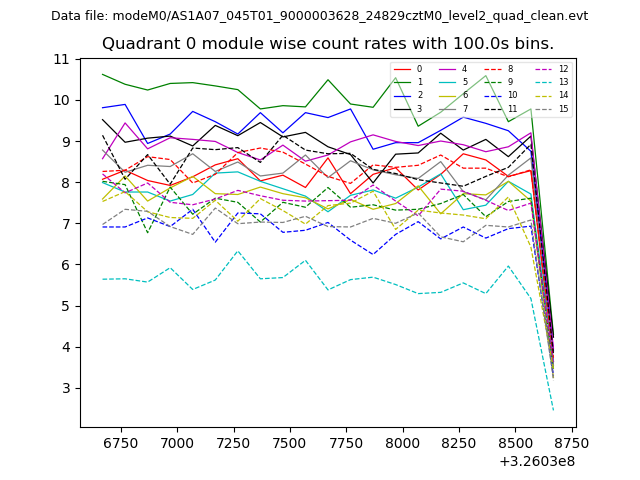 |
 |
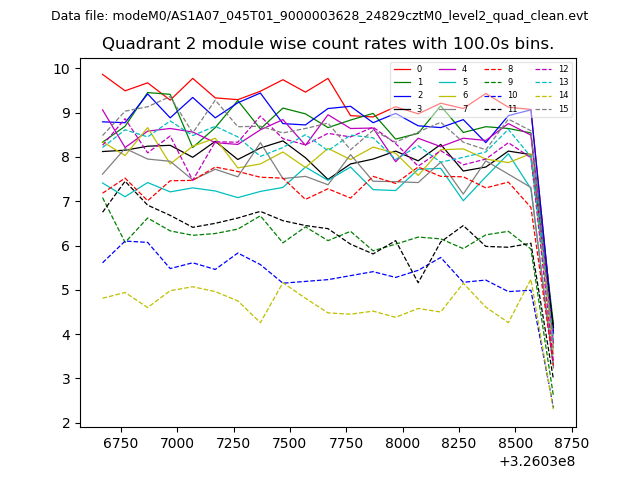
| Module-wise count rates for Quadrant B Data is divided into 100 sec bins |
 |
 |
| Module-wise count rates for Quadrant C Data is divided into 100 sec bins |
 |
 |
| Module-wise count rates for Quadrant D Data is divided into 100 sec bins |
 |
 |
| Parameter | Plot |
|---|---|
| CZT HV Monitor | 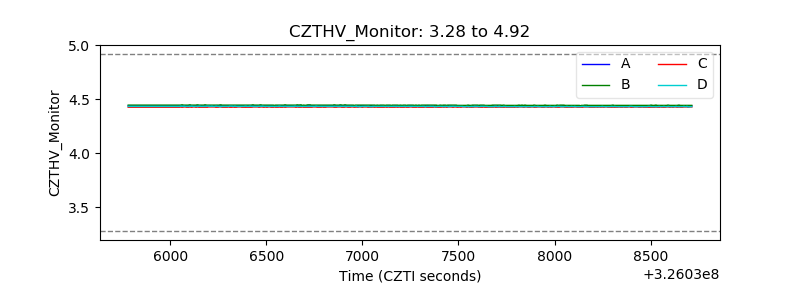 |
| D_VDD | 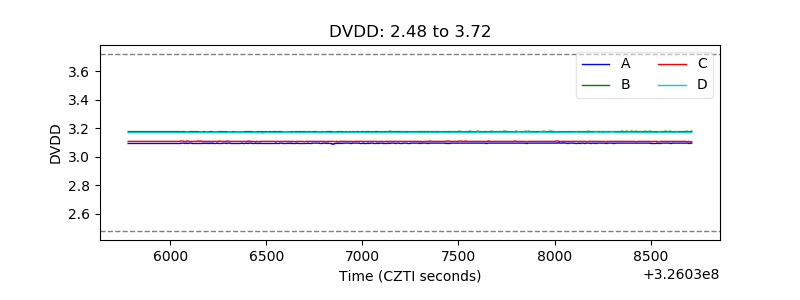 |
| Temperature 1 | 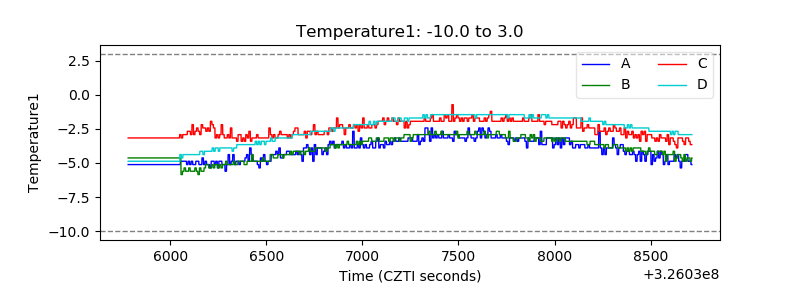 |
| Veto HV Monitor | 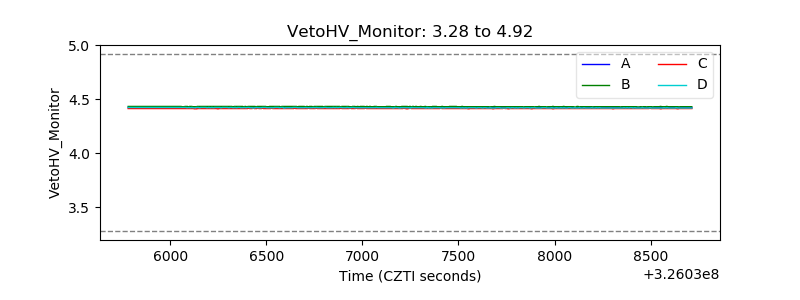 |
| Veto LLD | 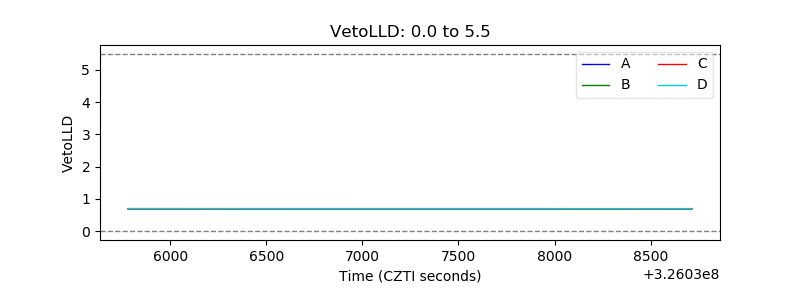 |
| Alpha Counter | 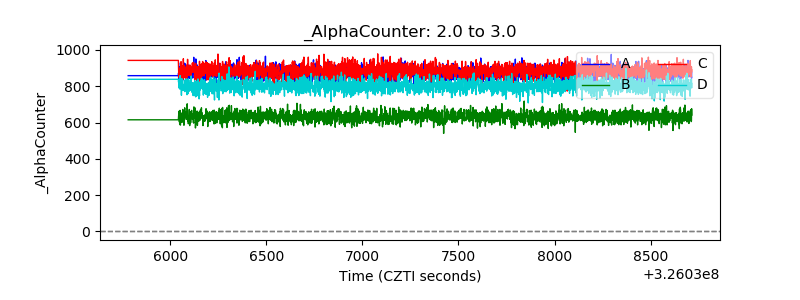 |
| _CPM_Rate | 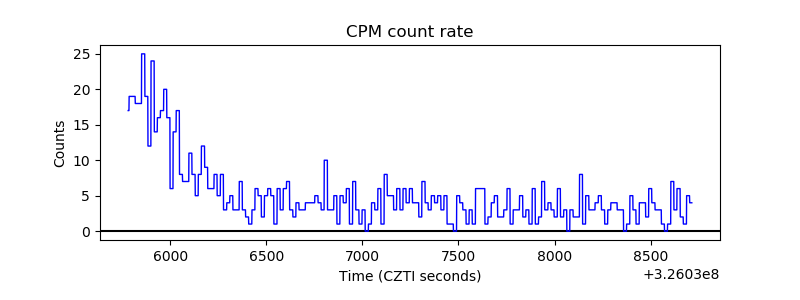 |
| CZT Counter | 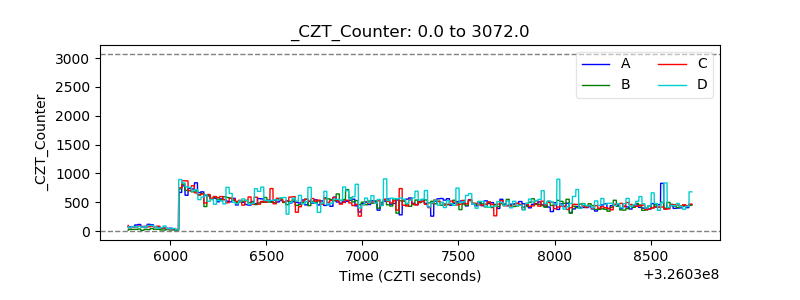 |
| +2.5 Volts monitor |  |
| +5 Volts monitor | 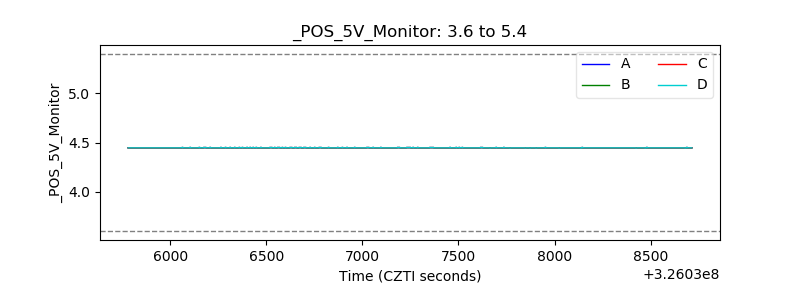 |
| _ROLL_ROT | 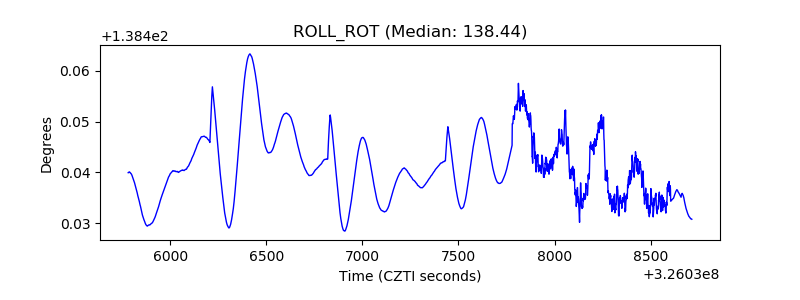 |
| _Roll_DEC | 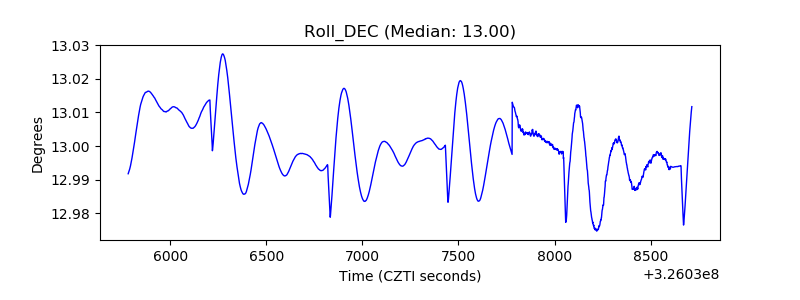 |
| _Roll_RA | 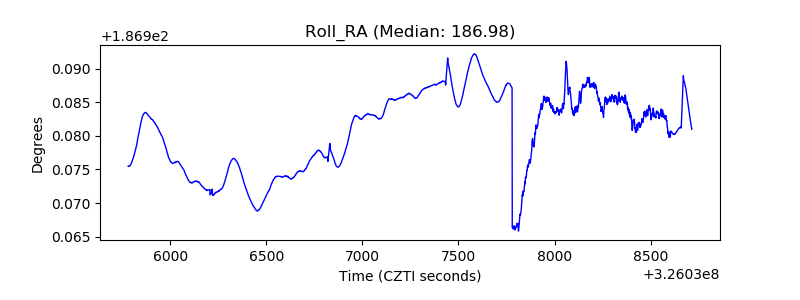 |
| Veto Counter | 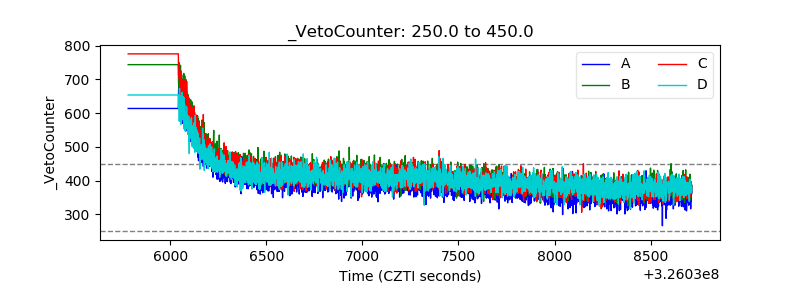 |