| Param | Original file | Final file |
|---|---|---|
| Filename | modeM0/AS1A08_003T02_9000003630cztM0_level2.fits | modeM0/AS1A08_003T02_9000003630cztM0_level2_quad_clean.evt |
| Size (bytes) | 256,976,640 | 224,781,120 |
| Size | 245.1 MB | 214.4 MB |
| Events in quadrant A | 1,572,590 | 1,307,762 |
| Events in quadrant B | 1,509,102 | 1,306,300 |
| Events in quadrant C | 1,521,644 | 1,223,936 |
| Events in quadrant D | 1,328,350 | 1,117,980 |
| Mode M0 | |||
|---|---|---|---|
| Quadrant | BADHDUFLAG | Total packets | Discarded packets |
| A | 0 | 55572 | 0 |
| B | 0 | 56686 | 0 |
| C | 0 | 55943 | 0 |
| D | 0 | 68017 | 0 |
| Mode M9 | |||
|---|---|---|---|
| Quadrant | BADHDUFLAG | Total packets | Discarded packets |
| A | 0 | 29 | 0 |
| B | 0 | 29 | 0 |
| C | 0 | 29 | 0 |
| D | 0 | 29 | 0 |
| Mode SS | |||
|---|---|---|---|
| Quadrant | BADHDUFLAG | Total packets | Discarded packets |
| A | 0 | 548 | 0 |
| B | 0 | 548 | 0 |
| C | 0 | 548 | 0 |
| D | 0 | 548 | 0 |
| Quadrant | Total seconds | Saturated seconds | Saturation percentage |
|---|---|---|---|
| A | 26912 | 357 | 1.326546% |
| B | 26912 | 458 | 1.701843% |
| C | 26912 | 581 | 2.158888% |
| D | 26912 | 942 | 3.500297% |
Noise dominated data is calculated using 1-second bins in cleaned event files. If a bin has >2000 counts, and if more than 50% of those come from <1% of pixels, then it is considered to be noise-dominated and hence unusable.
| Quadrant | # 1 sec bins | Bins with >0 counts | Bins with >2000 counts | High rate bins dominated by noise | Noise dominated (total time) | Noise dominated (detector-on time) | Marked lightcurve |
|---|---|---|---|---|---|---|---|
| A | 29737 | 26912 | 0 | 0 | 0.00% | 0.00% | 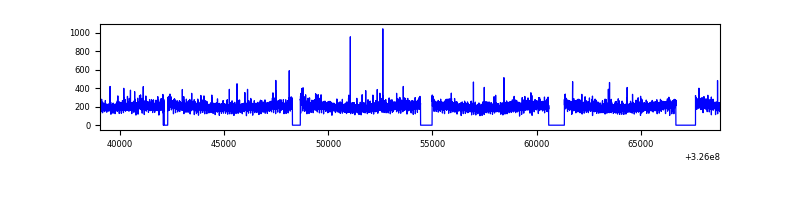 |
| B | 29737 | 26911 | 0 | 0 | 0.00% | 0.00% | 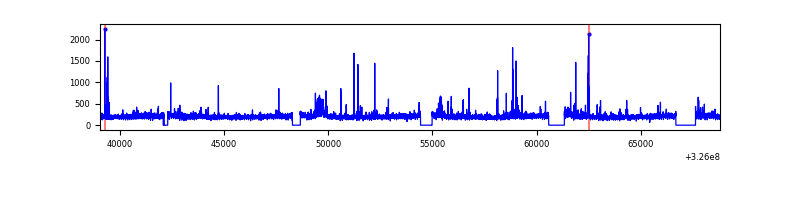 |
| C | 29737 | 26911 | 0 | 0 | 0.00% | 0.00% | 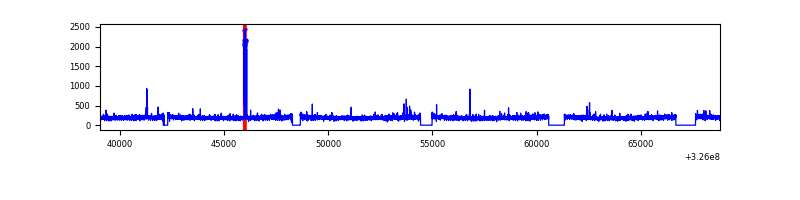 |
| D | 29737 | 26911 | 0 | 0 | 0.00% | 0.00% | 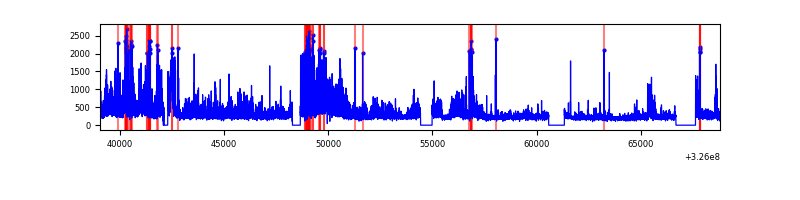 |
Top three noisy pixels from each quadrant. If the there are fewer than three noisy pixels in the level2.evt file, extra rows are filled as -1
| Pixel properties | Quadrant properties | ||||||
|---|---|---|---|---|---|---|---|
| Quadrant | DetID | PixID | Counts | Sigma | Mean | Median | Sigma |
| A | 0 | 29 | 1545 | 11.35 | 409 | 383 | 102.4 |
| A | 7 | 110 | 1255 | 8.52 | 409 | 383 | 102.4 |
| A | 0 | 30 | 1172 | 7.71 | 409 | 383 | 102.4 |
| B | 2 | 9 | 1161 | 9.78 | 397 | 377 | 80.2 |
| B | 2 | 8 | 1045 | 8.33 | 397 | 377 | 80.2 |
| B | 3 | 17 | 1012 | 7.92 | 397 | 377 | 80.2 |
| C | 1 | 81 | 1107 | 7.01 | 401 | 373 | 104.7 |
| C | 1 | 80 | 1099 | 6.93 | 401 | 373 | 104.7 |
| C | 3 | 234 | 1068 | 6.64 | 401 | 373 | 104.7 |
| D | 4 | 246 | 1007 | 6.49 | 378 | 342 | 102.5 |
| D | 3 | 14 | 984 | 6.26 | 378 | 342 | 102.5 |
| D | 7 | 5 | 967 | 6.1 | 378 | 342 | 102.5 |
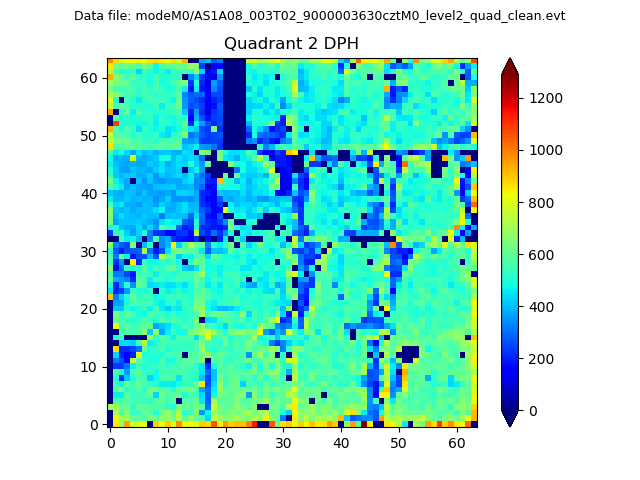
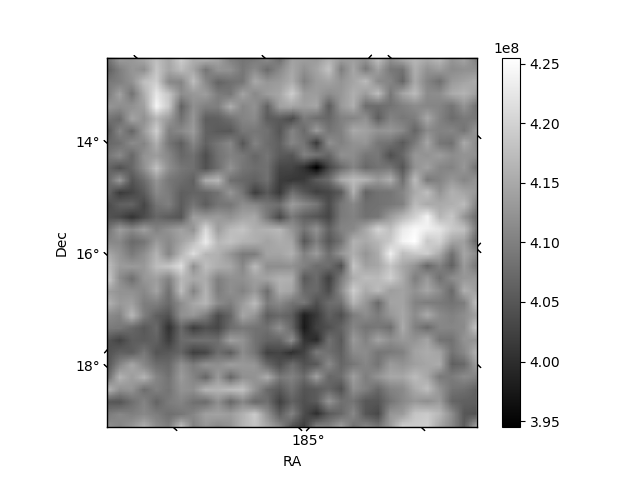
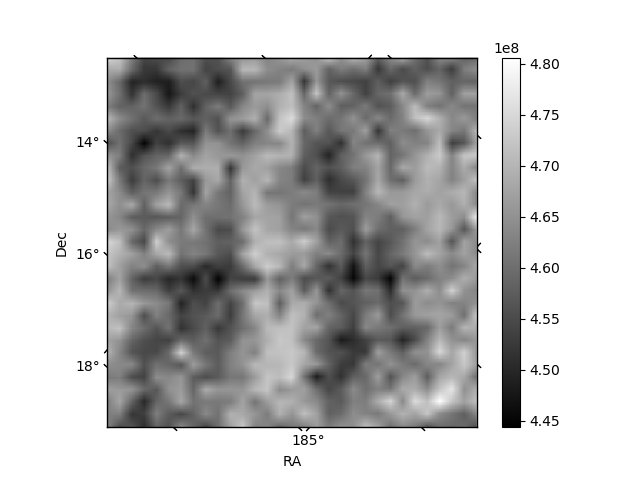
Histogram calculated using DETX and DETY for each event in the final _common_clean file
| Quadrant A | 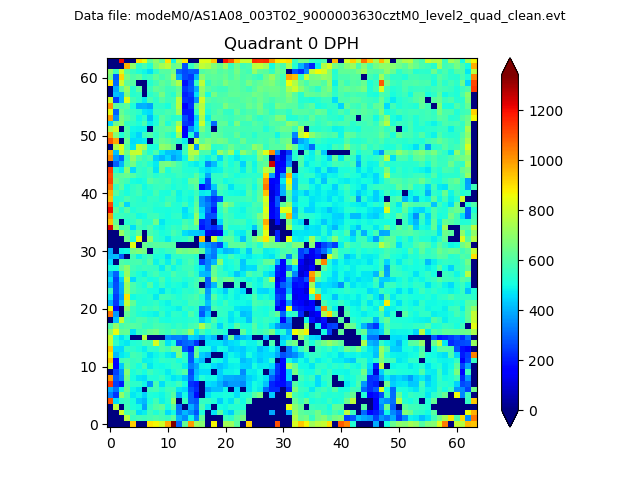 |
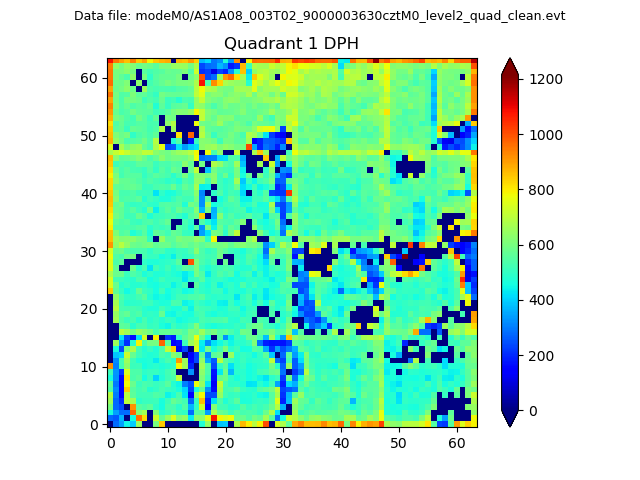 |
Quadrant B |
|---|---|---|---|
| Quadrant D | 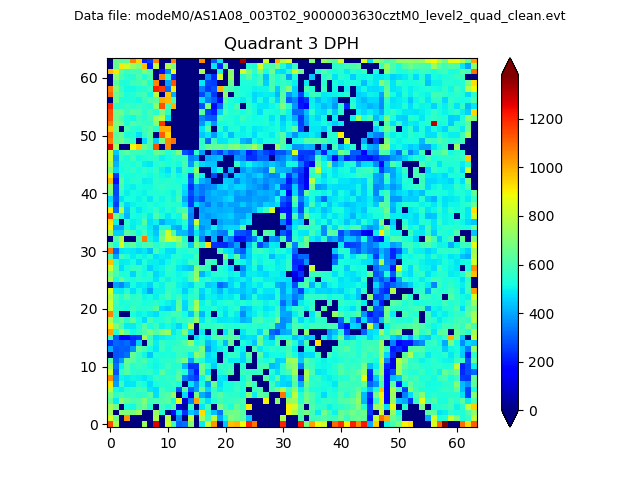 |
 |
Quadrant C |
| Plot type | Count rate plots | Images |
|---|---|---|
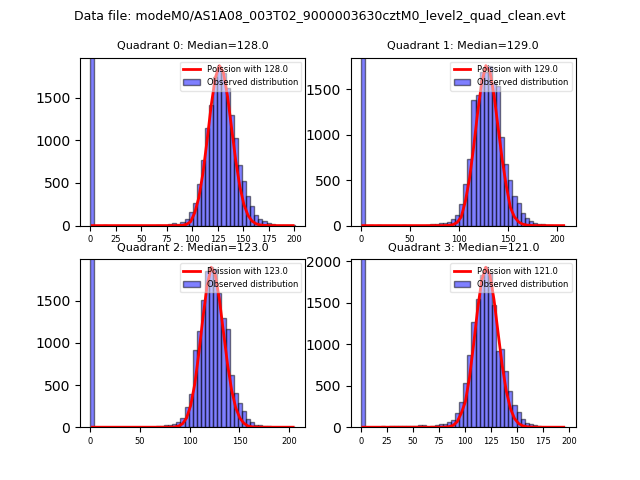
| Comparison with Poisson distribution Blue bars denote a histogram of data divided into 1 sec bins. Red curve is a Poisson curve with rate = median count rate of data. |
 |
 |
| Quadrant-wise count rates Data is divided into 100 sec bins |
 |
|
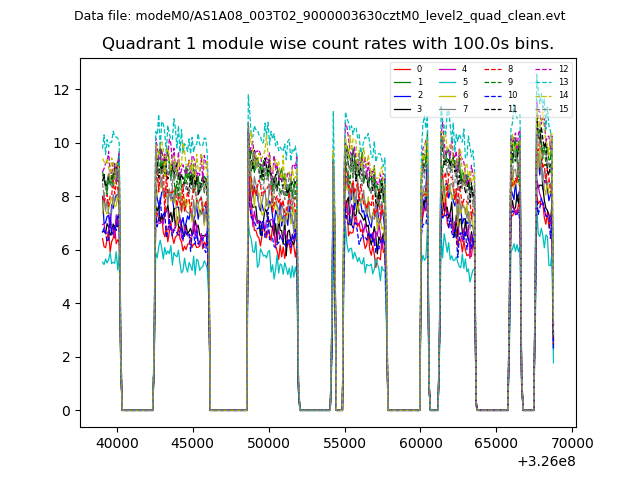
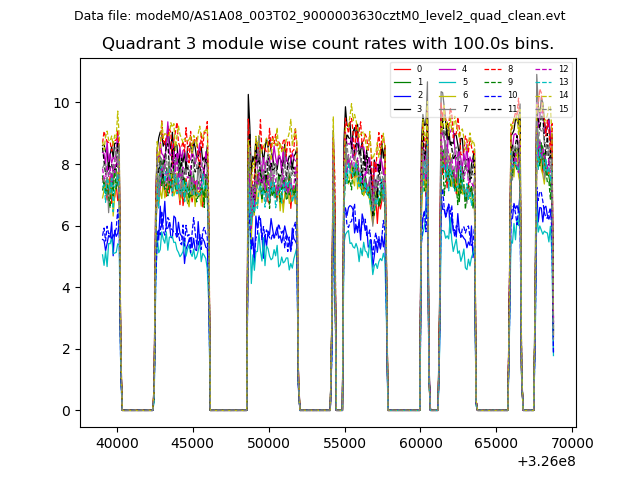
| Module-wise count rates for Quadrant A Data is divided into 100 sec bins |
 |
 |
| Module-wise count rates for Quadrant B Data is divided into 100 sec bins |
 |
 |
| Module-wise count rates for Quadrant C Data is divided into 100 sec bins |
 |
 |
| Module-wise count rates for Quadrant D Data is divided into 100 sec bins |
 |
 |
| Parameter | Plot |
|---|---|
| CZT HV Monitor |  |
| D_VDD | 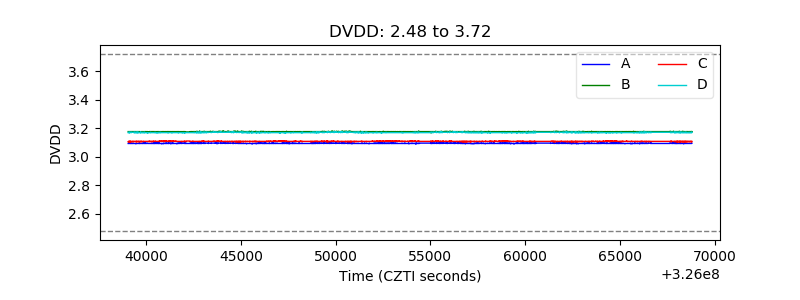 |
| Temperature 1 | 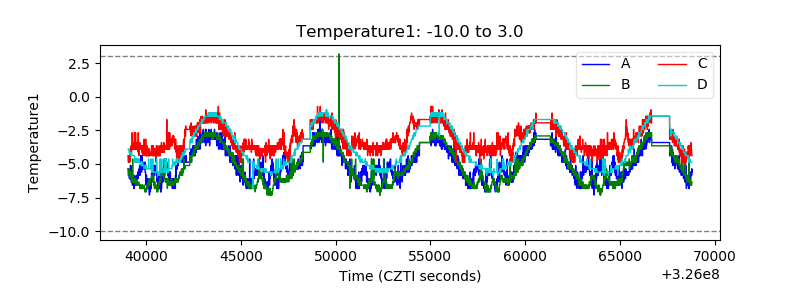 |
| Veto HV Monitor |  |
| Veto LLD | 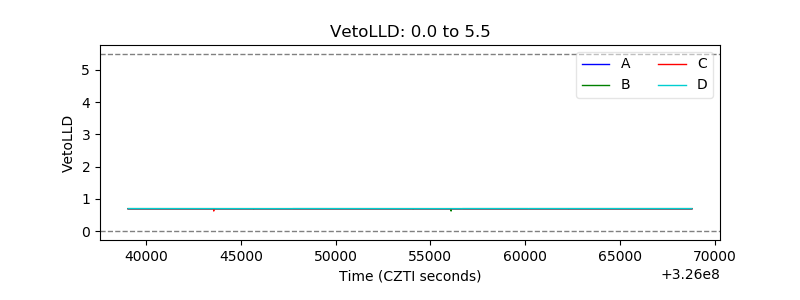 |
| Alpha Counter |  |
| _CPM_Rate | 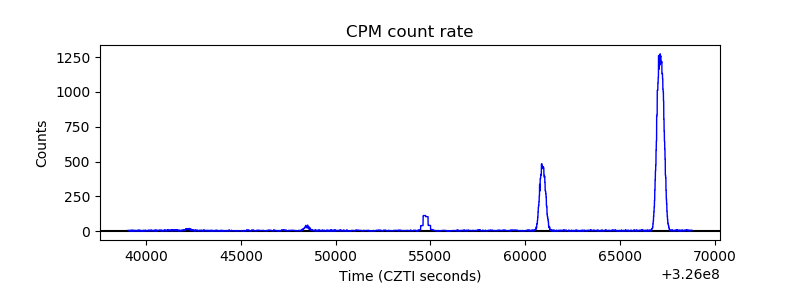 |
| CZT Counter | 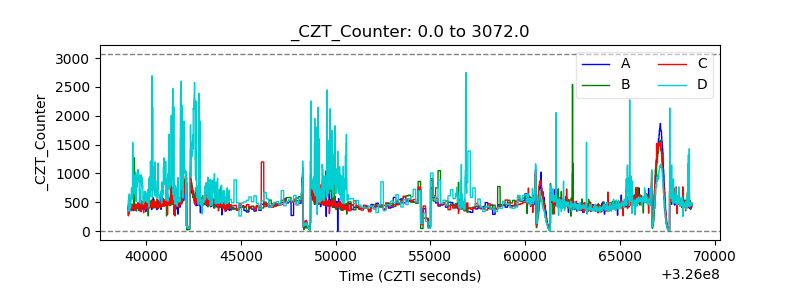 |
| +2.5 Volts monitor | 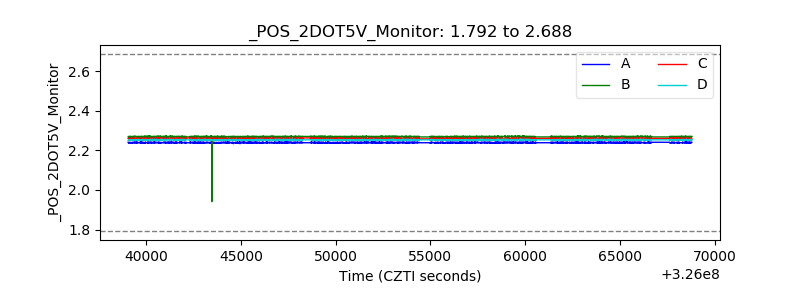 |
| +5 Volts monitor |  |
| _ROLL_ROT |  |
| _Roll_DEC | 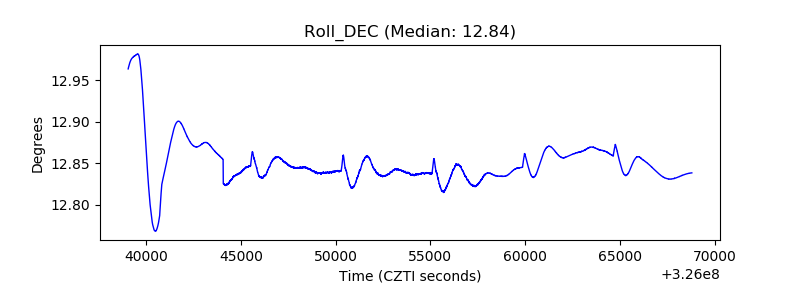 |
| _Roll_RA |  |
| Veto Counter | 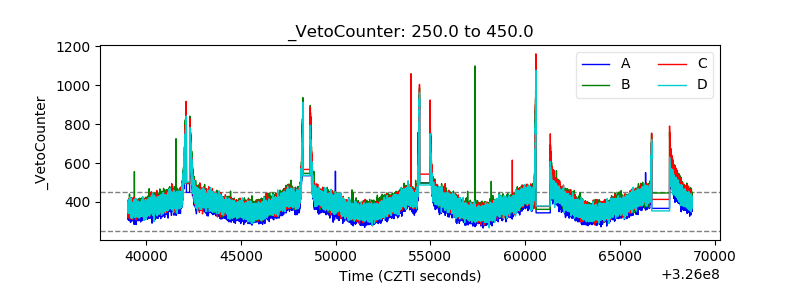 |