| Param | Original file | Final file |
|---|---|---|
| Filename | modeM0/AS1A08_003T02_9000003630_24829cztM0_level2.evt | modeM0/AS1A08_003T02_9000003630_24829cztM0_level2_quad_clean.evt |
| Size (bytes) | 379,275,840 | 54,521,280 |
| Size | 361.7 MB | 52.0 MB |
| Events in quadrant A | 2,338,524 | 339,841 |
| Events in quadrant B | 2,388,919 | 344,767 |
| Events in quadrant C | 2,358,406 | 323,656 |
| Events in quadrant D | 4,079,503 | 311,411 |
| Mode M0 | |||
|---|---|---|---|
| Quadrant | BADHDUFLAG | Total packets | Discarded packets |
| A | 0 | 9911 | 1 |
| B | 0 | 9984 | 1 |
| C | 0 | 9925 | 1 |
| D | 0 | 15392 | 1 |
| Mode M9 | |||
|---|---|---|---|
| Quadrant | BADHDUFLAG | Total packets | Discarded packets |
| A | 0 | 2 | 0 |
| B | 0 | 2 | 0 |
| C | 0 | 2 | 0 |
| D | 0 | 2 | 0 |
| Mode SS | |||
|---|---|---|---|
| Quadrant | BADHDUFLAG | Total packets | Discarded packets |
| A | 0 | 96 | 0 |
| B | 0 | 96 | 0 |
| C | 0 | 96 | 0 |
| D | 0 | 96 | 0 |
| Quadrant | Total seconds | Saturated seconds | Saturation percentage |
|---|---|---|---|
| A | 4711 | 144 | 3.056676% |
| B | 4711 | 170 | 3.608576% |
| C | 4711 | 169 | 3.587349% |
| D | 4711 | 532 | 11.292719% |
Noise dominated data is calculated using 1-second bins in cleaned event files. If a bin has >2000 counts, and if more than 50% of those come from <1% of pixels, then it is considered to be noise-dominated and hence unusable.
| Quadrant | # 1 sec bins | Bins with >0 counts | Bins with >2000 counts | High rate bins dominated by noise | Noise dominated (total time) | Noise dominated (detector-on time) | Marked lightcurve |
|---|---|---|---|---|---|---|---|
| A | 4901 | 4713 | 0 | 0 | 0.00% | 0.00% | 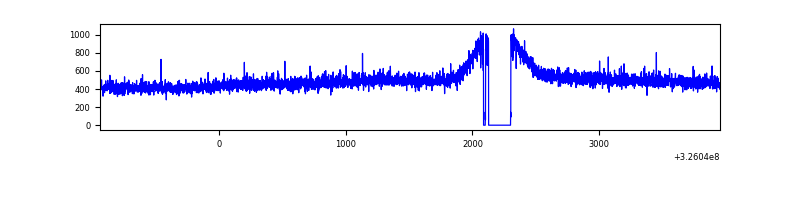 |
| B | 4901 | 4713 | 4 | 4 | 0.08% | 0.08% | 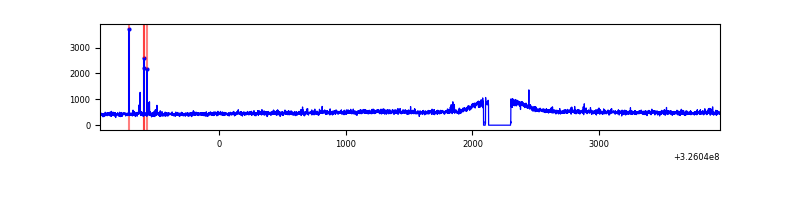 |
| C | 4901 | 4713 | 0 | 0 | 0.00% | 0.00% | 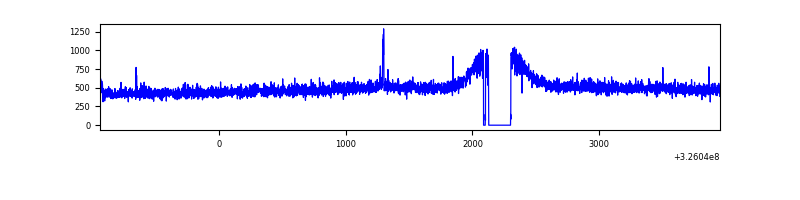 |
| D | 4901 | 4713 | 276 | 276 | 5.63% | 5.86% | 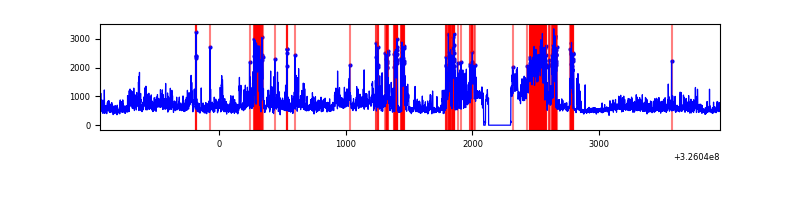 |
Top three noisy pixels from each quadrant. If the there are fewer than three noisy pixels in the level2.evt file, extra rows are filled as -1
| Pixel properties | Quadrant properties | ||||||
|---|---|---|---|---|---|---|---|
| Quadrant | DetID | PixID | Counts | Sigma | Mean | Median | Sigma |
| A | 13 | 254 | 6354 | 46.47 | 606 | 593 | 124.0 |
| A | 3 | 137 | 6000 | 43.62 | 606 | 593 | 124.0 |
| A | 0 | 226 | 5178 | 36.98 | 606 | 593 | 124.0 |
| B | 4 | 80 | 18686 | 150.7 | 600 | 584 | 120.1 |
| B | 12 | 111 | 15170 | 121.43 | 600 | 584 | 120.1 |
| B | 11 | 111 | 13627 | 108.58 | 600 | 584 | 120.1 |
| C | 14 | 238 | 92004 | 664.78 | 577 | 579 | 137.5 |
| C | 2 | 16 | 11827 | 81.79 | 577 | 579 | 137.5 |
| C | 7 | 247 | 7768 | 52.27 | 577 | 579 | 137.5 |
| D | 5 | 222 | 1252999 | 9006.59 | 565 | 546 | 139.1 |
| D | 8 | 195 | 577618 | 4149.82 | 565 | 546 | 139.1 |
| D | 1 | 52 | 91429 | 653.55 | 565 | 546 | 139.1 |
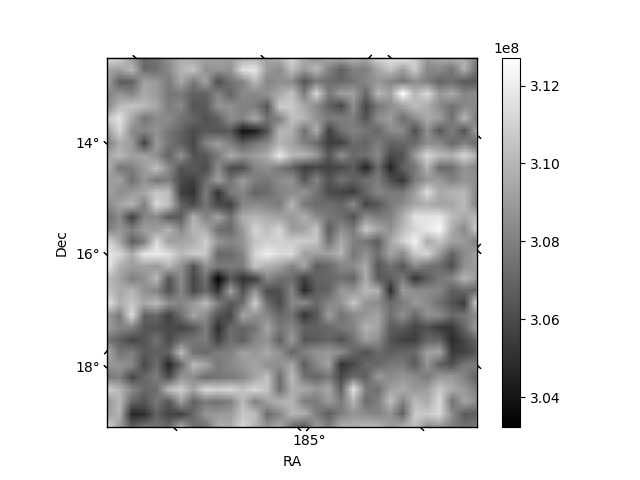
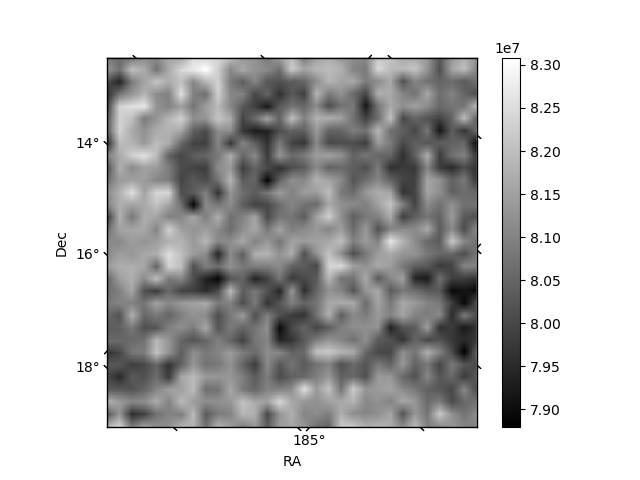
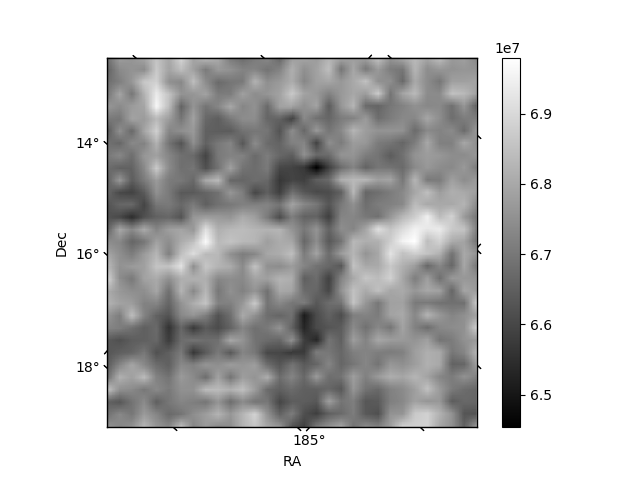
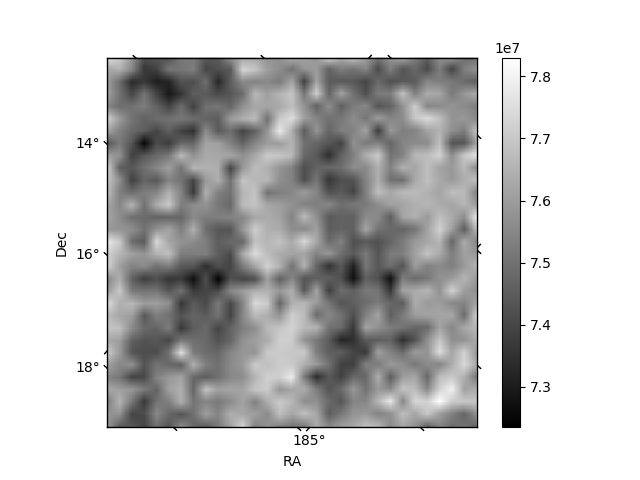
Histogram calculated using DETX and DETY for each event in the final _common_clean file
| Quadrant A | 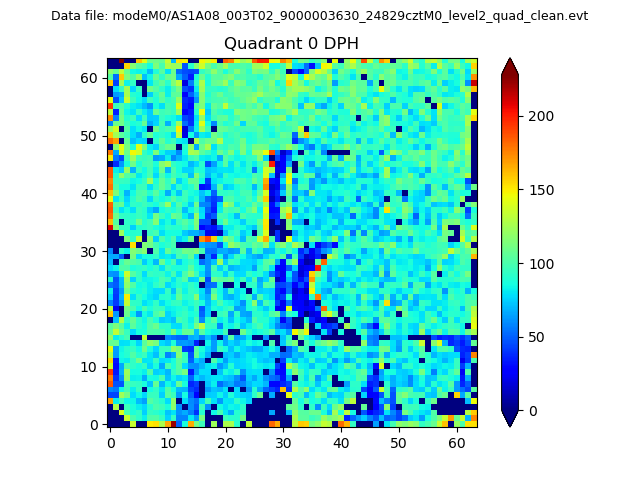 |
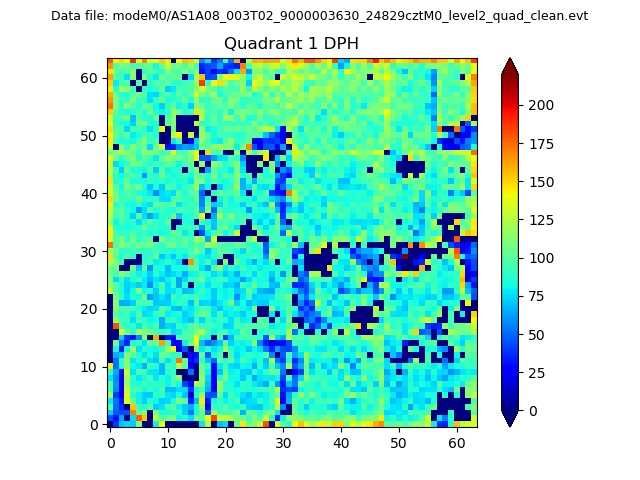 |
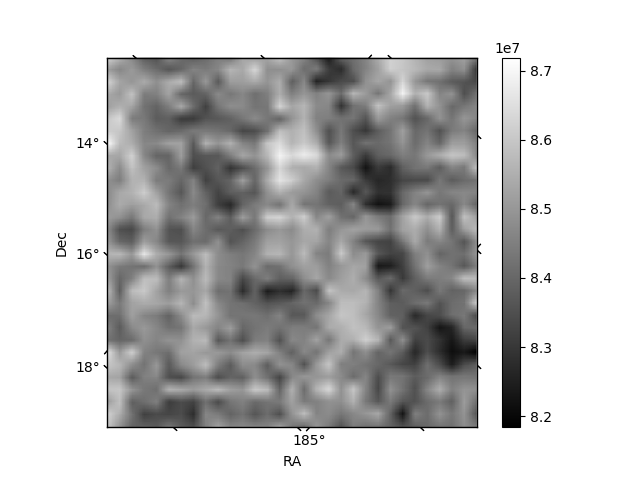
Quadrant B |
|---|---|---|---|
| Quadrant D | 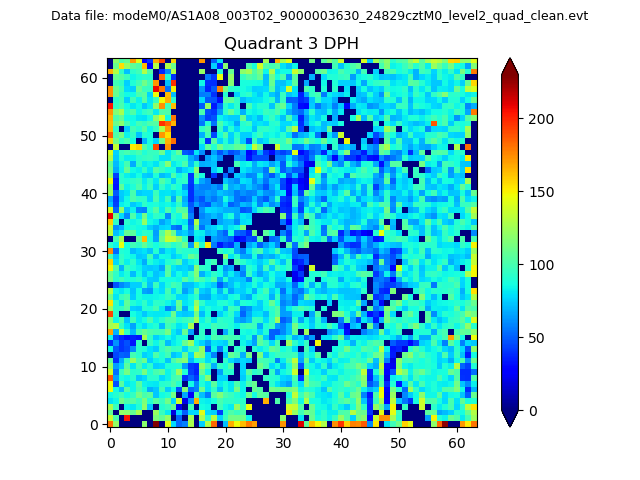 |
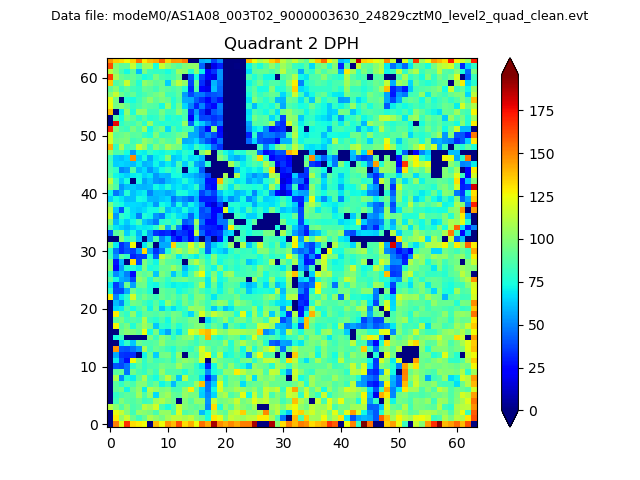 |
Quadrant C |
| Plot type | Count rate plots | Images |
|---|---|---|
| Comparison with Poisson distribution Blue bars denote a histogram of data divided into 1 sec bins. Red curve is a Poisson curve with rate = median count rate of data. |
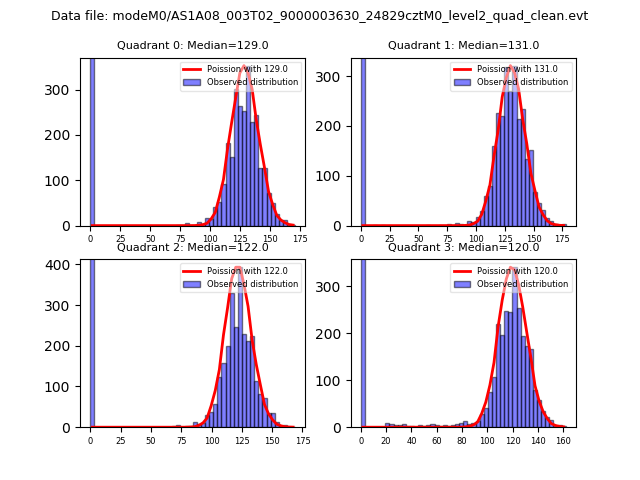 |
 |
| Quadrant-wise count rates Data is divided into 100 sec bins |
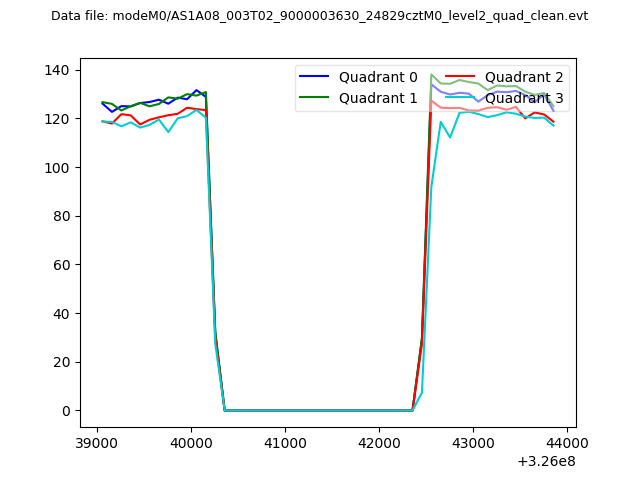 |
|
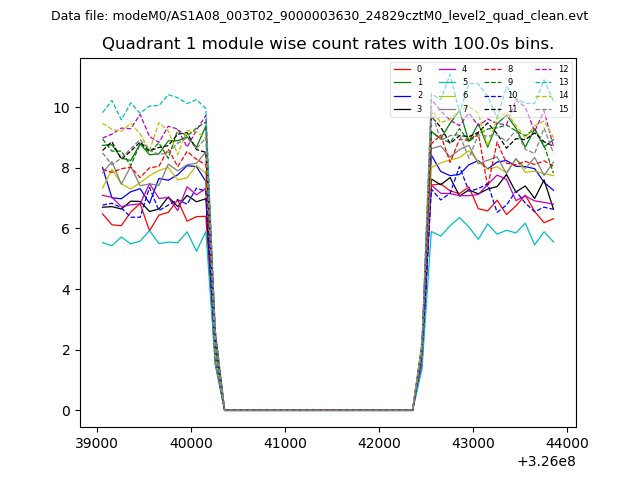
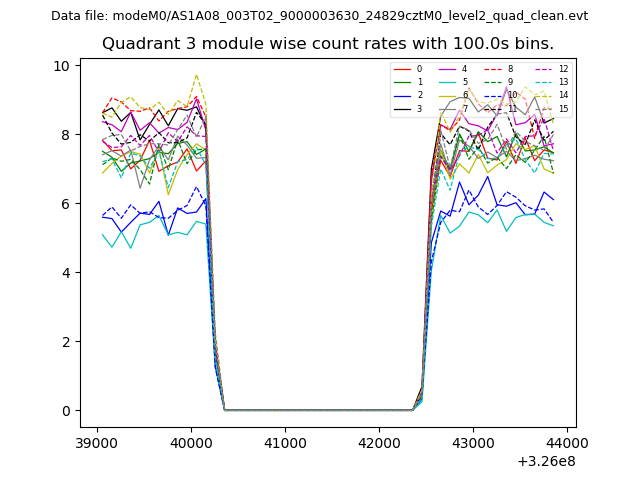
| Module-wise count rates for Quadrant A Data is divided into 100 sec bins |
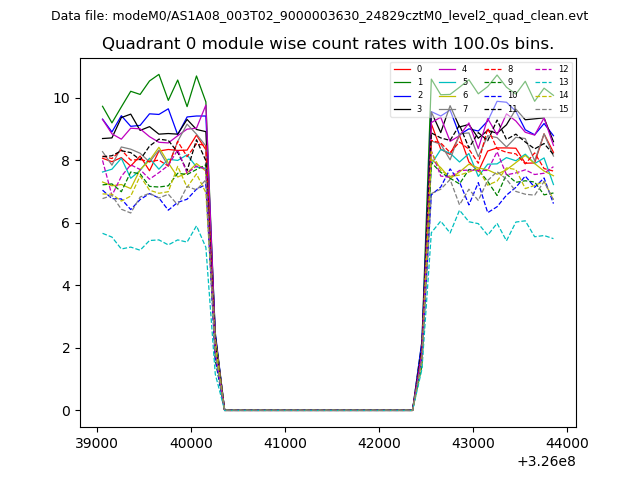 |
 |
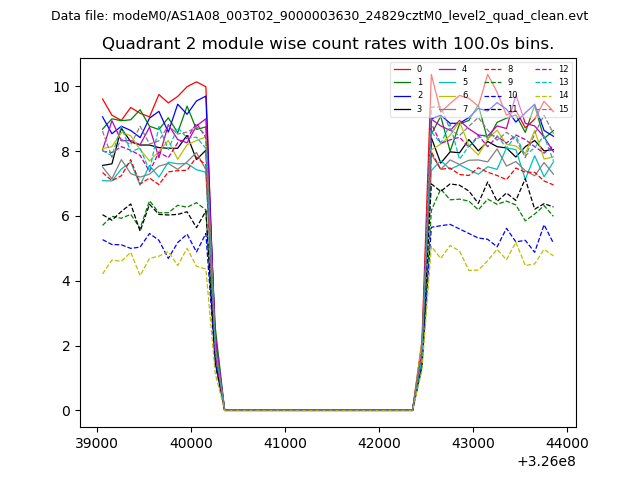
| Module-wise count rates for Quadrant B Data is divided into 100 sec bins |
 |
 |
| Module-wise count rates for Quadrant C Data is divided into 100 sec bins |
 |
 |
| Module-wise count rates for Quadrant D Data is divided into 100 sec bins |
 |
 |
| Parameter | Plot |
|---|---|
| CZT HV Monitor | 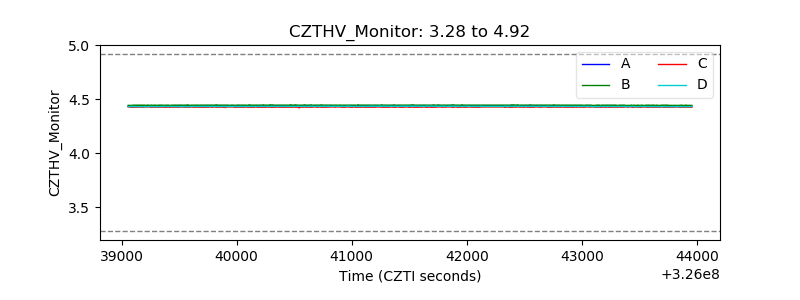 |
| D_VDD | 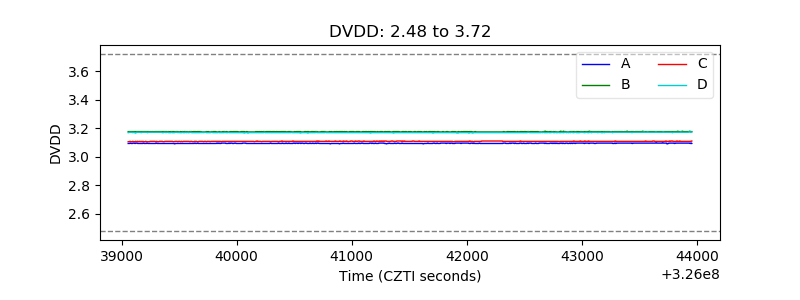 |
| Temperature 1 | 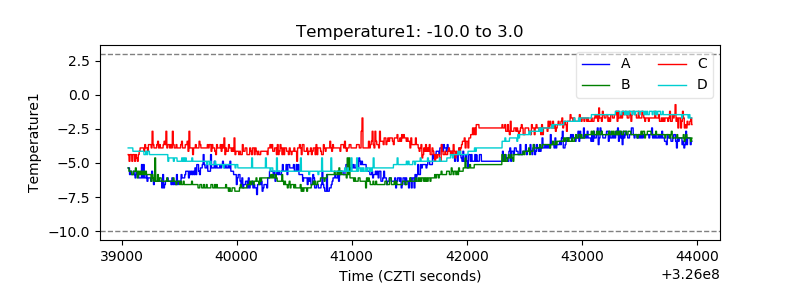 |
| Veto HV Monitor | 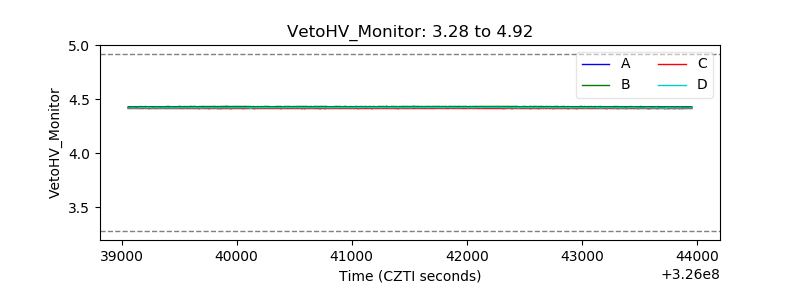 |
| Veto LLD | 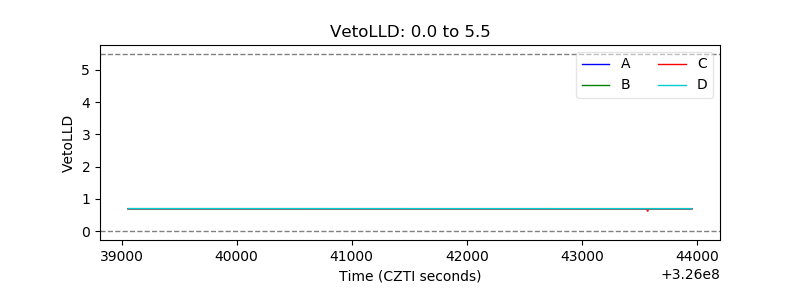 |
| Alpha Counter | 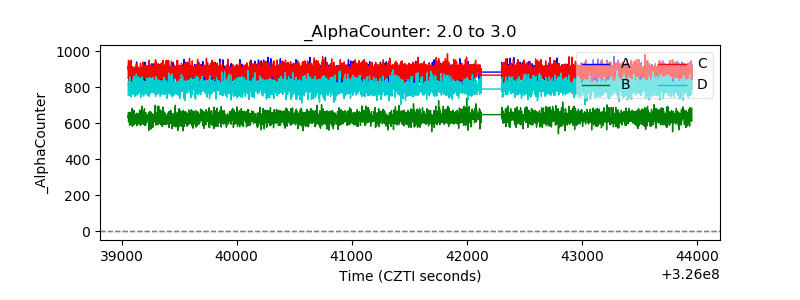 |
| _CPM_Rate | 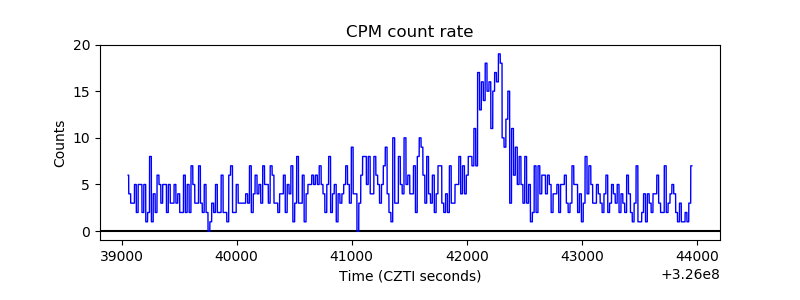 |
| CZT Counter | 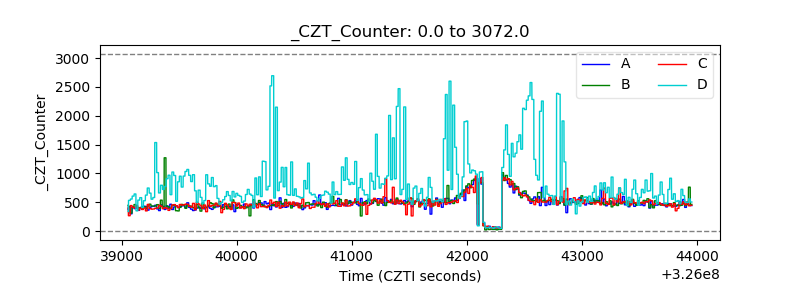 |
| +2.5 Volts monitor |  |
| +5 Volts monitor | 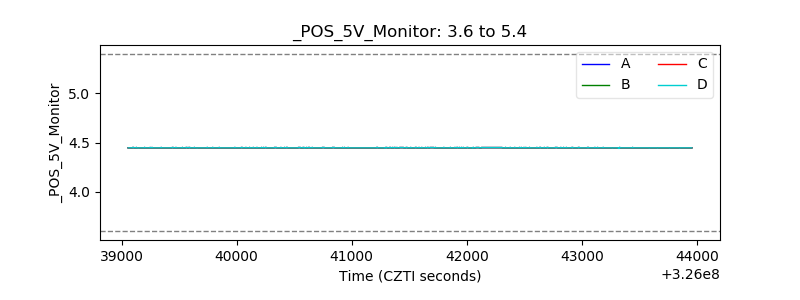 |
| _ROLL_ROT | 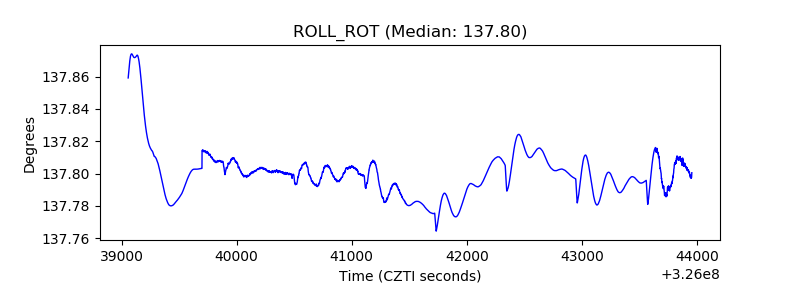 |
| _Roll_DEC | 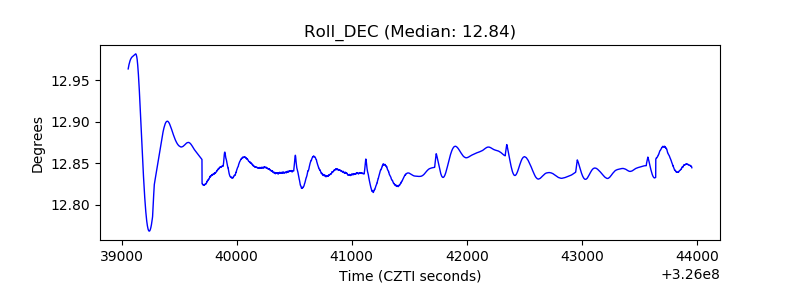 |
| _Roll_RA | 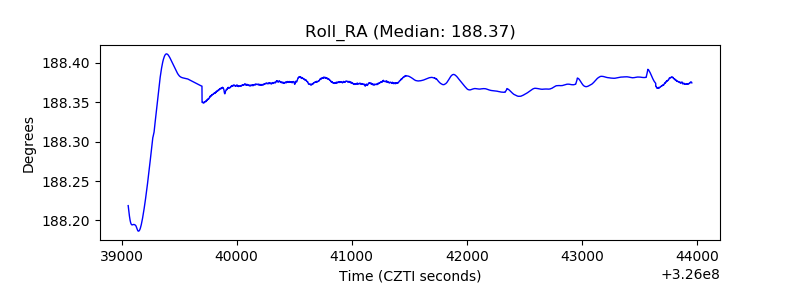 |
| Veto Counter | 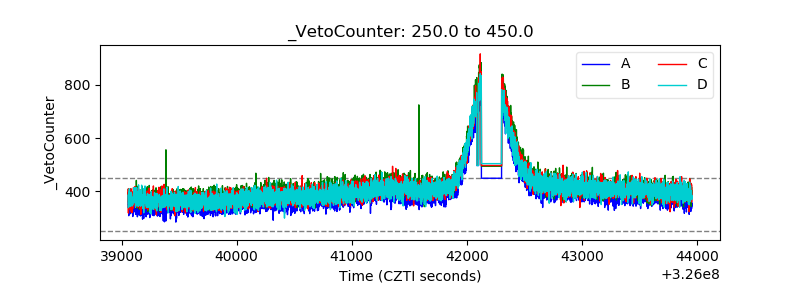 |