| Param | Original file | Final file |
|---|---|---|
| Filename | modeM0/AS1A08_003T02_9000003630_24830cztM0_level2.evt | modeM0/AS1A08_003T02_9000003630_24830cztM0_level2_quad_clean.evt |
| Size (bytes) | 541,163,520 | 100,967,040 |
| Size | 516.1 MB | 96.3 MB |
| Events in quadrant A | 3,498,571 | 657,822 |
| Events in quadrant B | 3,664,848 | 665,991 |
| Events in quadrant C | 3,610,590 | 625,159 |
| Events in quadrant D | 5,119,535 | 600,350 |
| Mode M0 | |||
|---|---|---|---|
| Quadrant | BADHDUFLAG | Total packets | Discarded packets |
| A | 0 | 15036 | 1 |
| B | 0 | 15509 | 1 |
| C | 0 | 15284 | 2 |
| D | 0 | 20049 | 1 |
| Mode M9 | |||
|---|---|---|---|
| Quadrant | BADHDUFLAG | Total packets | Discarded packets |
| A | 0 | 3 | 0 |
| B | 0 | 3 | 0 |
| C | 0 | 3 | 0 |
| D | 0 | 3 | 0 |
| Mode SS | |||
|---|---|---|---|
| Quadrant | BADHDUFLAG | Total packets | Discarded packets |
| A | 0 | 150 | 0 |
| B | 0 | 150 | 0 |
| C | 0 | 150 | 0 |
| D | 0 | 150 | 0 |
| Quadrant | Total seconds | Saturated seconds | Saturation percentage |
|---|---|---|---|
| A | 7294 | 95 | 1.302440% |
| B | 7295 | 115 | 1.576422% |
| C | 7294 | 178 | 2.440362% |
| D | 7294 | 369 | 5.058953% |
Noise dominated data is calculated using 1-second bins in cleaned event files. If a bin has >2000 counts, and if more than 50% of those come from <1% of pixels, then it is considered to be noise-dominated and hence unusable.
| Quadrant | # 1 sec bins | Bins with >0 counts | Bins with >2000 counts | High rate bins dominated by noise | Noise dominated (total time) | Noise dominated (detector-on time) | Marked lightcurve |
|---|---|---|---|---|---|---|---|
| A | 7674 | 7295 | 0 | 0 | 0.00% | 0.00% | 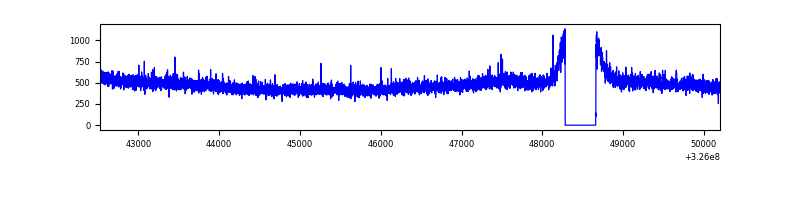 |
| B | 7675 | 7296 | 0 | 0 | 0.00% | 0.00% | 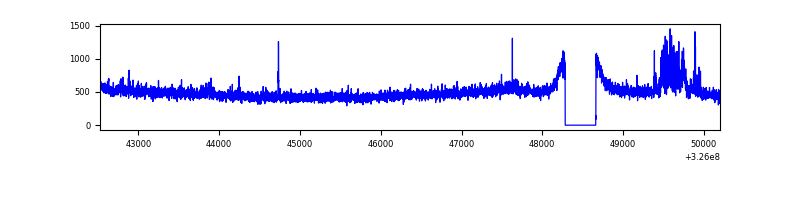 |
| C | 7674 | 7295 | 27 | 27 | 0.35% | 0.37% | 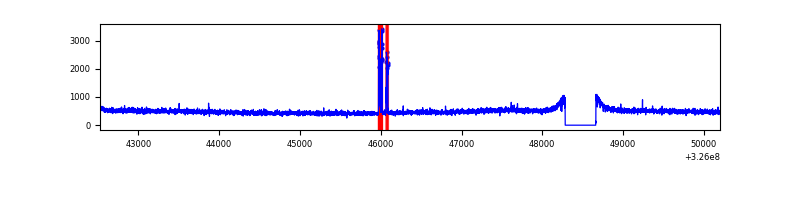 |
| D | 7674 | 7295 | 227 | 227 | 2.96% | 3.11% | 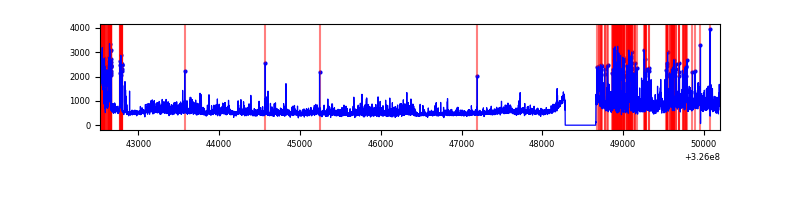 |
Top three noisy pixels from each quadrant. If the there are fewer than three noisy pixels in the level2.evt file, extra rows are filled as -1
| Pixel properties | Quadrant properties | ||||||
|---|---|---|---|---|---|---|---|
| Quadrant | DetID | PixID | Counts | Sigma | Mean | Median | Sigma |
| A | 13 | 254 | 10467 | 51.64 | 907 | 888 | 185.5 |
| A | 3 | 137 | 8771 | 42.5 | 907 | 888 | 185.5 |
| A | 0 | 226 | 7943 | 38.03 | 907 | 888 | 185.5 |
| B | 0 | 189 | 126594 | 717.91 | 894 | 870 | 175.1 |
| B | 12 | 111 | 22233 | 121.99 | 894 | 870 | 175.1 |
| B | 11 | 111 | 19799 | 108.09 | 894 | 870 | 175.1 |
| C | 14 | 238 | 137349 | 670.14 | 862 | 866 | 203.7 |
| C | 2 | 16 | 97356 | 473.77 | 862 | 866 | 203.7 |
| C | 7 | 247 | 16901 | 78.73 | 862 | 866 | 203.7 |
| D | 5 | 222 | 957393 | 4498.72 | 865 | 839 | 212.6 |
| D | 8 | 195 | 826614 | 3883.66 | 865 | 839 | 212.6 |
| D | 1 | 52 | 52703 | 243.92 | 865 | 839 | 212.6 |
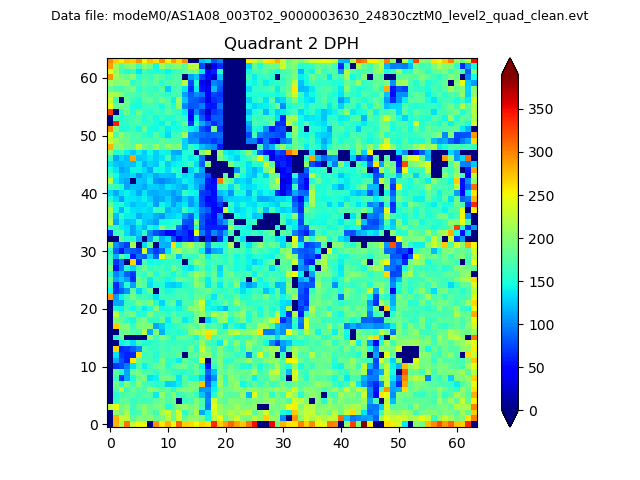
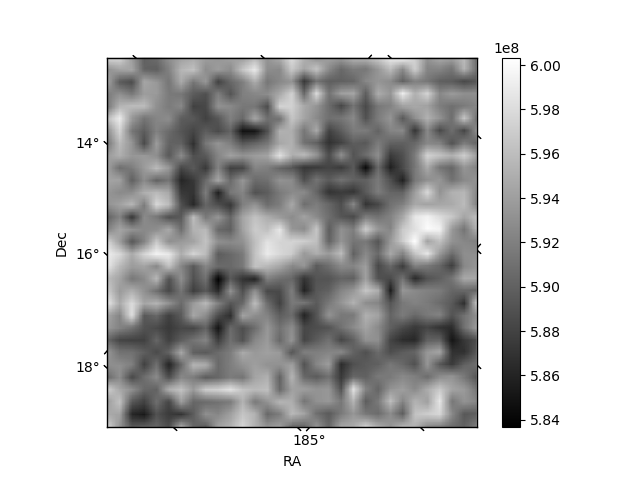
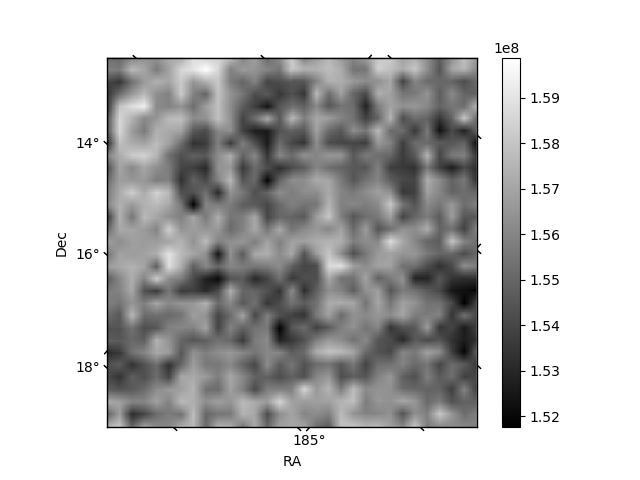
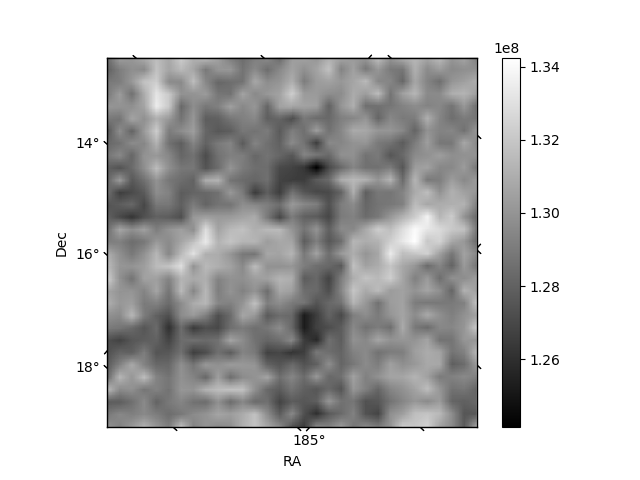
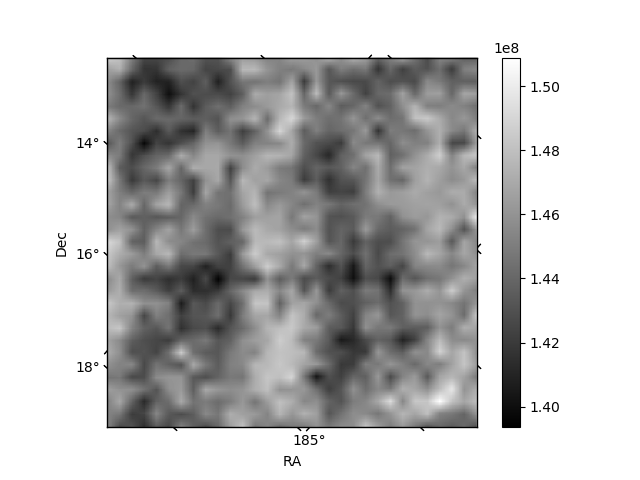
Histogram calculated using DETX and DETY for each event in the final _common_clean file
| Quadrant A | 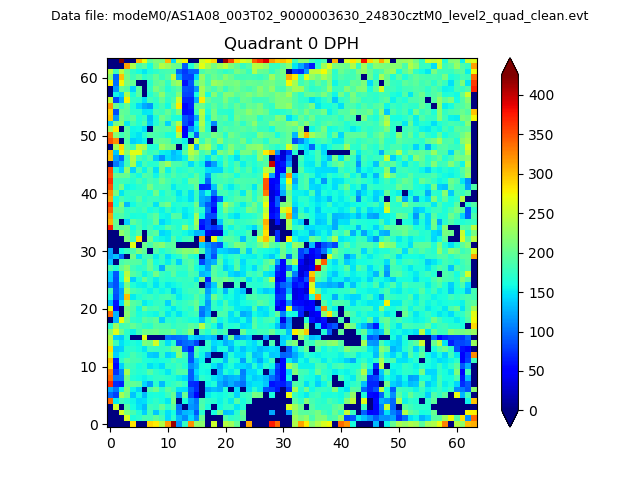 |
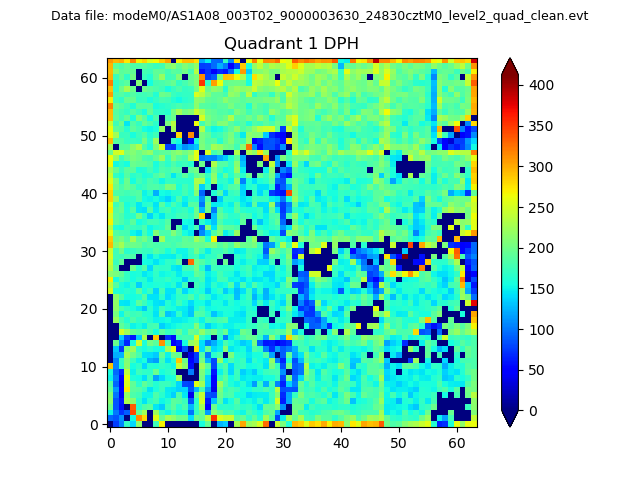 |
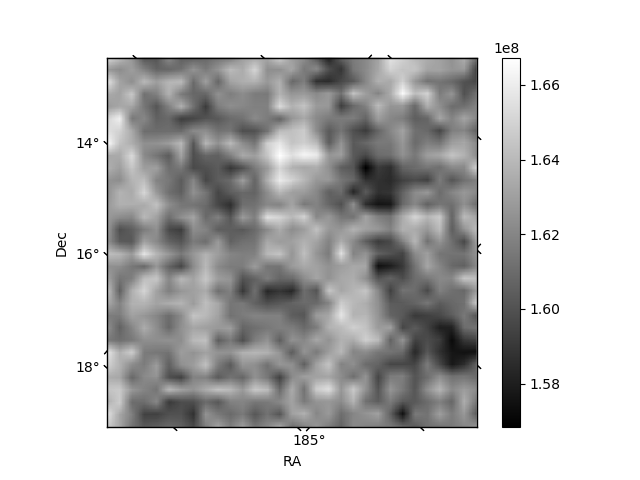
Quadrant B |
|---|---|---|---|
| Quadrant D | 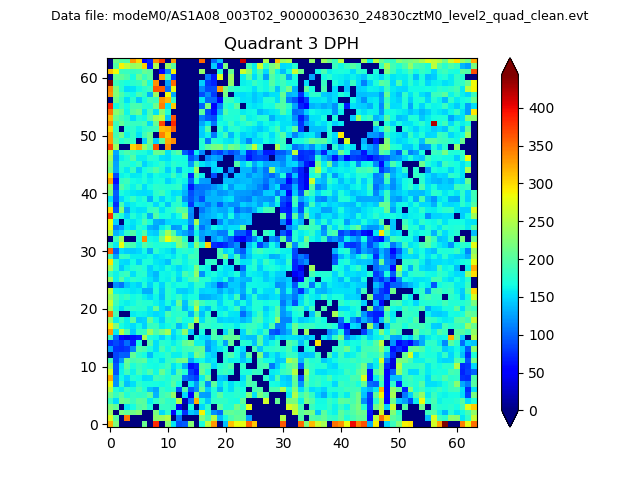 |
 |
Quadrant C |
| Plot type | Count rate plots | Images |
|---|---|---|
| Comparison with Poisson distribution Blue bars denote a histogram of data divided into 1 sec bins. Red curve is a Poisson curve with rate = median count rate of data. |
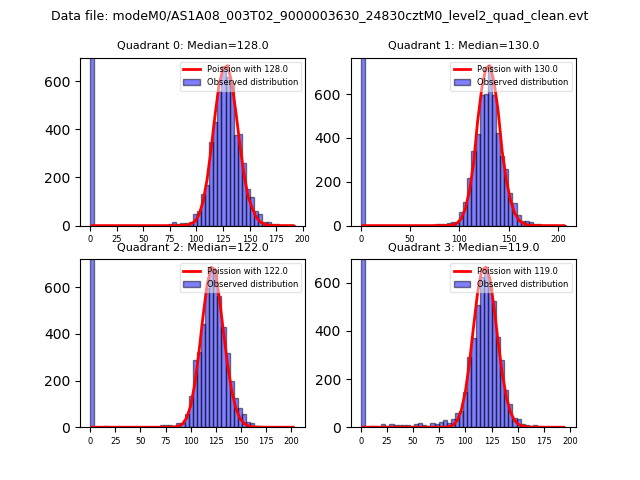 |
 |
| Quadrant-wise count rates Data is divided into 100 sec bins |
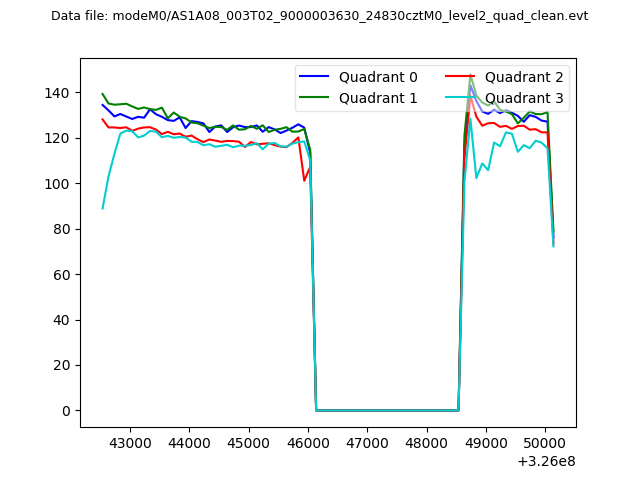 |
|
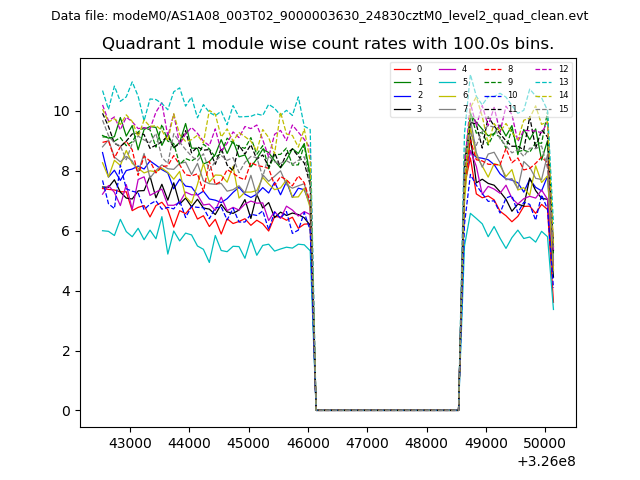
| Module-wise count rates for Quadrant A Data is divided into 100 sec bins |
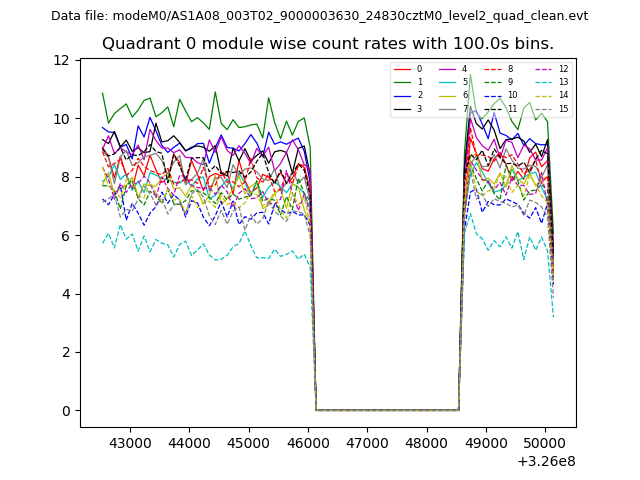 |
 |
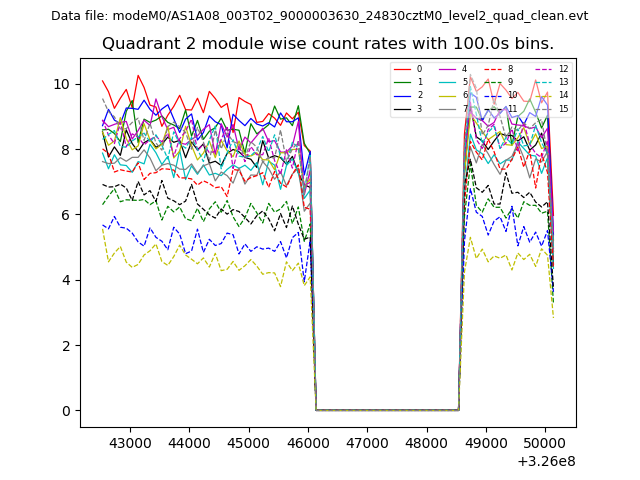
| Module-wise count rates for Quadrant B Data is divided into 100 sec bins |
 |
 |
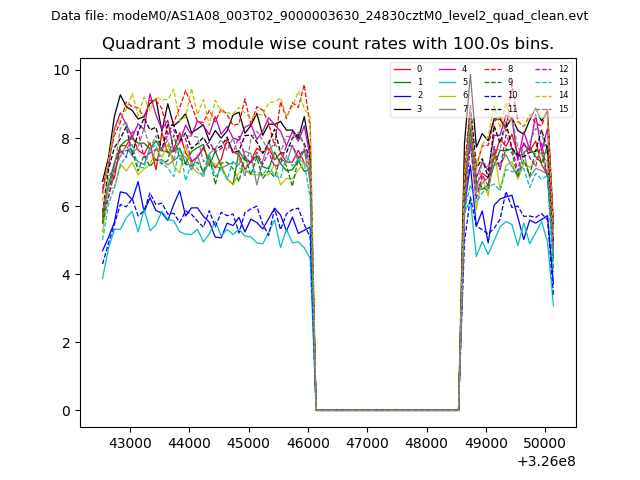
| Module-wise count rates for Quadrant C Data is divided into 100 sec bins |
 |
 |
| Module-wise count rates for Quadrant D Data is divided into 100 sec bins |
 |
 |
| Parameter | Plot |
|---|---|
| CZT HV Monitor | 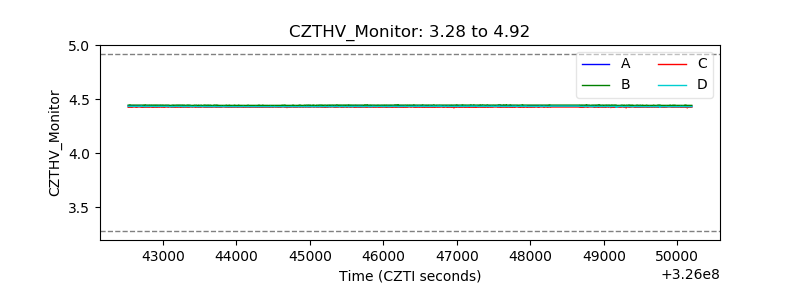 |
| D_VDD | 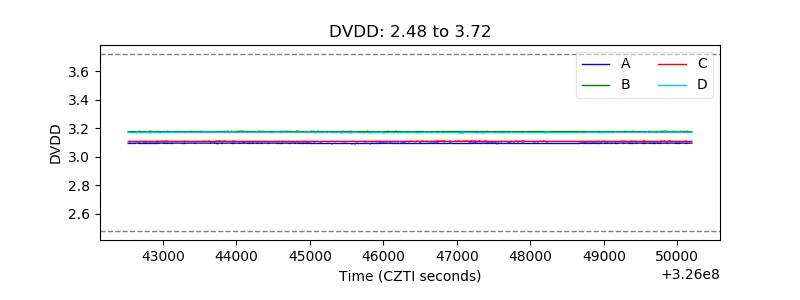 |
| Temperature 1 | 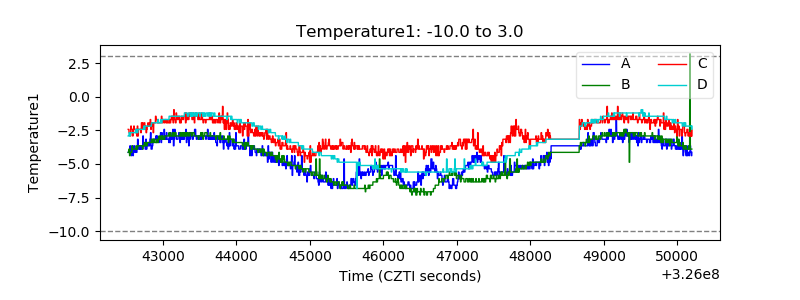 |
| Veto HV Monitor | 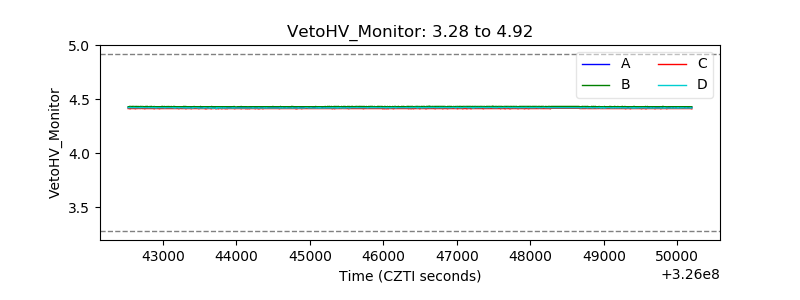 |
| Veto LLD |  |
| Alpha Counter | 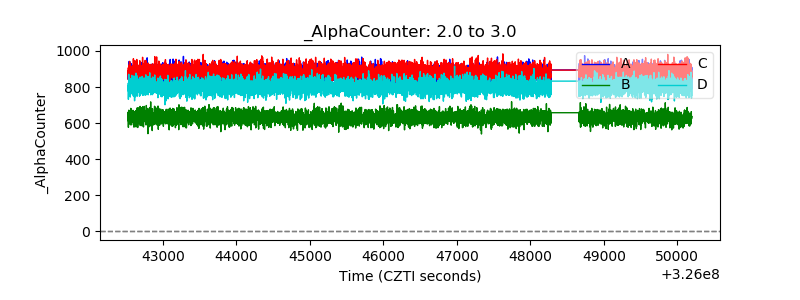 |
| _CPM_Rate |  |
| CZT Counter | 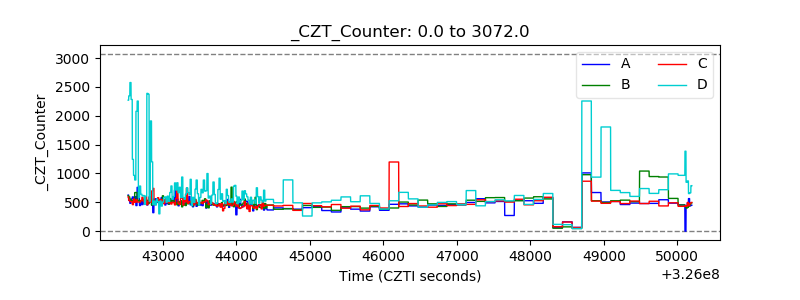 |
| +2.5 Volts monitor |  |
| +5 Volts monitor |  |
| _ROLL_ROT | 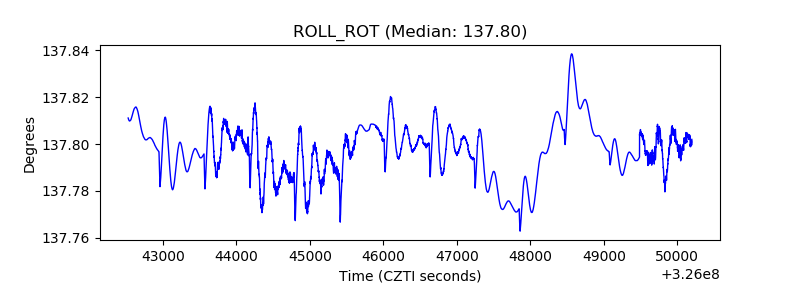 |
| _Roll_DEC | 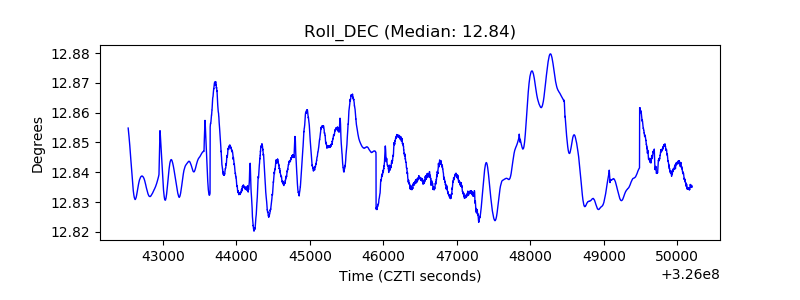 |
| _Roll_RA | 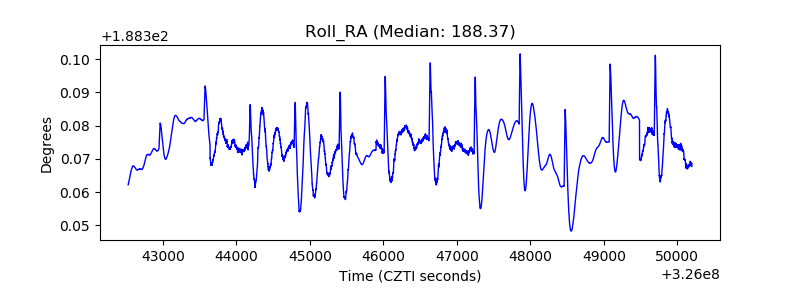 |
| Veto Counter | 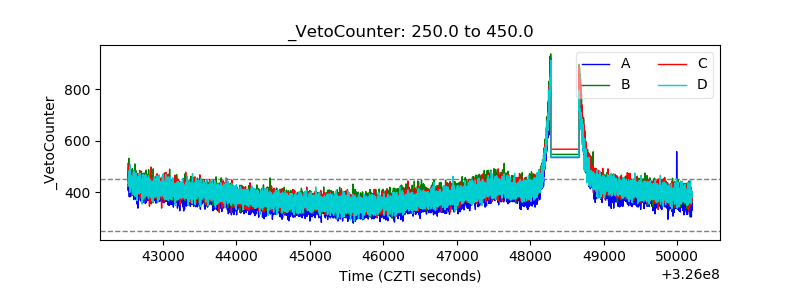 |