| Param | Original file | Final file |
|---|---|---|
| Filename | modeM0/AS1A08_003T02_9000003630_24832cztM0_level2.evt | modeM0/AS1A08_003T02_9000003630_24832cztM0_level2_quad_clean.evt |
| Size (bytes) | 892,889,280 | 165,611,520 |
| Size | 851.5 MB | 157.9 MB |
| Events in quadrant A | 6,008,193 | 1,058,088 |
| Events in quadrant B | 6,369,833 | 1,066,501 |
| Events in quadrant C | 6,068,590 | 1,017,589 |
| Events in quadrant D | 7,729,976 | 990,683 |
| Mode M0 | |||
|---|---|---|---|
| Quadrant | BADHDUFLAG | Total packets | Discarded packets |
| A | 0 | 26269 | 2 |
| B | 0 | 27210 | 2 |
| C | 0 | 26328 | 2 |
| D | 0 | 31507 | 2 |
| Mode M9 | |||
|---|---|---|---|
| Quadrant | BADHDUFLAG | Total packets | Discarded packets |
| A | 0 | 14 | 0 |
| B | 0 | 14 | 0 |
| C | 0 | 14 | 0 |
| D | 0 | 14 | 0 |
| Mode SS | |||
|---|---|---|---|
| Quadrant | BADHDUFLAG | Total packets | Discarded packets |
| A | 0 | 258 | 0 |
| B | 0 | 258 | 0 |
| C | 0 | 258 | 0 |
| D | 0 | 258 | 0 |
| Quadrant | Total seconds | Saturated seconds | Saturation percentage |
|---|---|---|---|
| A | 12779 | 108 | 0.845137% |
| B | 12779 | 158 | 1.236403% |
| C | 12779 | 200 | 1.565068% |
| D | 12780 | 284 | 2.222222% |
Noise dominated data is calculated using 1-second bins in cleaned event files. If a bin has >2000 counts, and if more than 50% of those come from <1% of pixels, then it is considered to be noise-dominated and hence unusable.
| Quadrant | # 1 sec bins | Bins with >0 counts | Bins with >2000 counts | High rate bins dominated by noise | Noise dominated (total time) | Noise dominated (detector-on time) | Marked lightcurve |
|---|---|---|---|---|---|---|---|
| A | 14089 | 12781 | 1 | 1 | 0.01% | 0.01% | 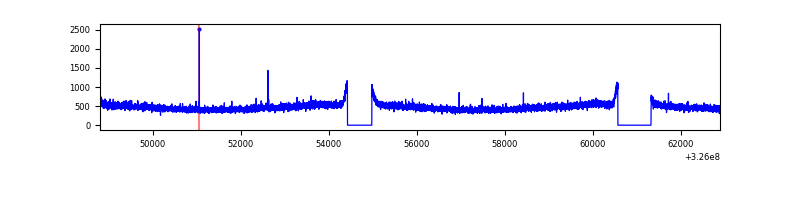 |
| B | 14089 | 12781 | 14 | 14 | 0.10% | 0.11% | 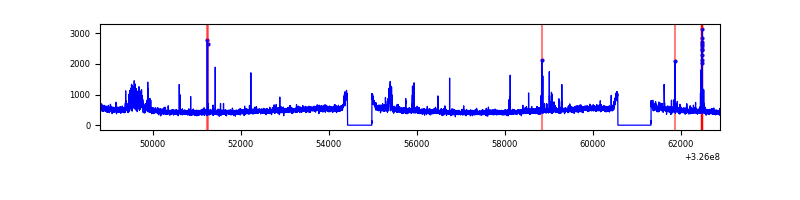 |
| C | 14089 | 12781 | 0 | 0 | 0.00% | 0.00% | 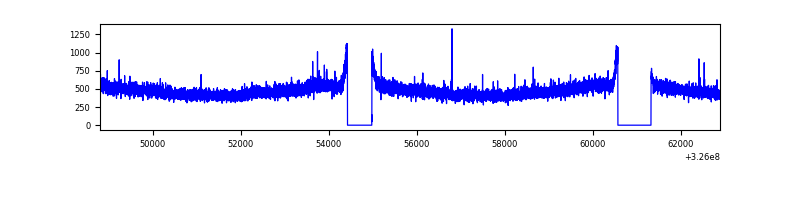 |
| D | 14090 | 12782 | 172 | 172 | 1.22% | 1.35% | 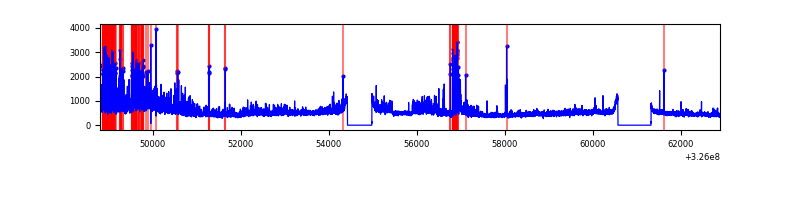 |
Top three noisy pixels from each quadrant. If the there are fewer than three noisy pixels in the level2.evt file, extra rows are filled as -1
| Pixel properties | Quadrant properties | ||||||
|---|---|---|---|---|---|---|---|
| Quadrant | DetID | PixID | Counts | Sigma | Mean | Median | Sigma |
| A | 13 | 254 | 19054 | 55.95 | 1554 | 1519 | 313.4 |
| A | 3 | 137 | 15023 | 43.09 | 1554 | 1519 | 313.4 |
| A | 0 | 226 | 13086 | 36.91 | 1554 | 1519 | 313.4 |
| B | 0 | 189 | 178023 | 593.42 | 1538 | 1496 | 297.5 |
| B | 10 | 251 | 80993 | 267.24 | 1538 | 1496 | 297.5 |
| B | 12 | 111 | 37352 | 120.53 | 1538 | 1496 | 297.5 |
| C | 14 | 238 | 233387 | 662.51 | 1488 | 1497 | 350.0 |
| C | 7 | 247 | 25974 | 69.93 | 1488 | 1497 | 350.0 |
| C | 13 | 61 | 10219 | 24.92 | 1488 | 1497 | 350.0 |
| D | 8 | 195 | 1143585 | 3113.41 | 1503 | 1459 | 366.8 |
| D | 5 | 222 | 803067 | 2185.16 | 1503 | 1459 | 366.8 |
| D | 1 | 52 | 64530 | 171.93 | 1503 | 1459 | 366.8 |
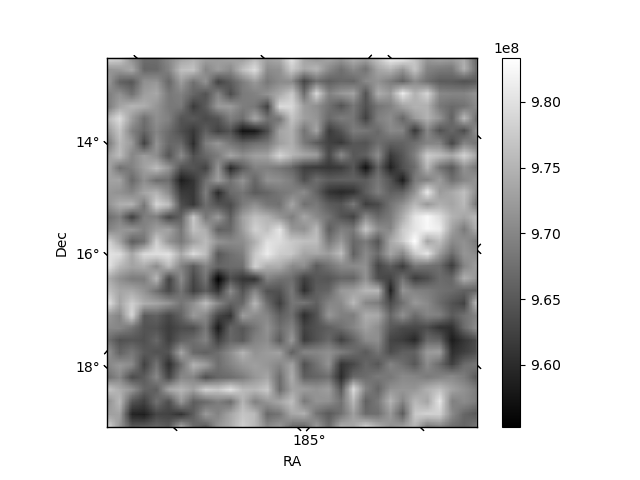
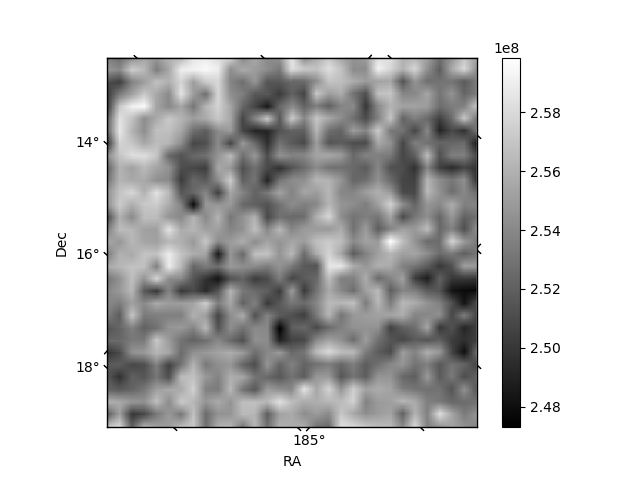
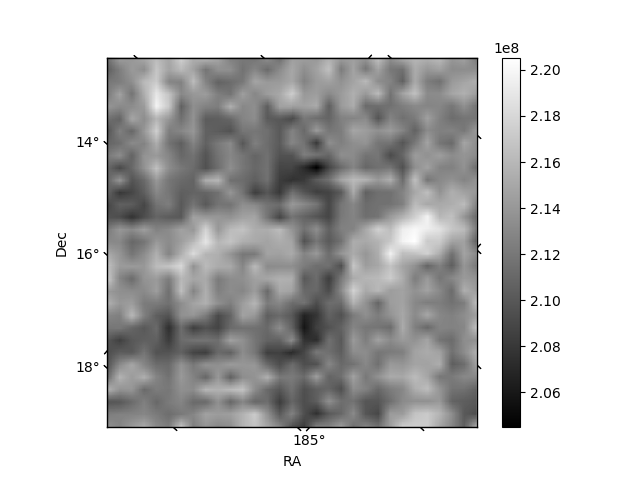
Histogram calculated using DETX and DETY for each event in the final _common_clean file
| Quadrant A | 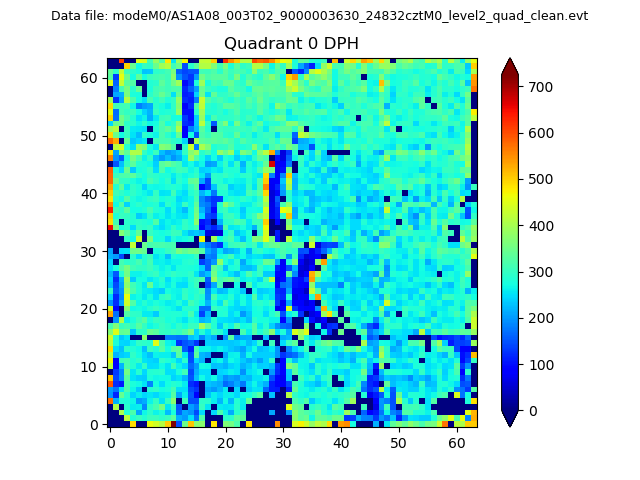 |
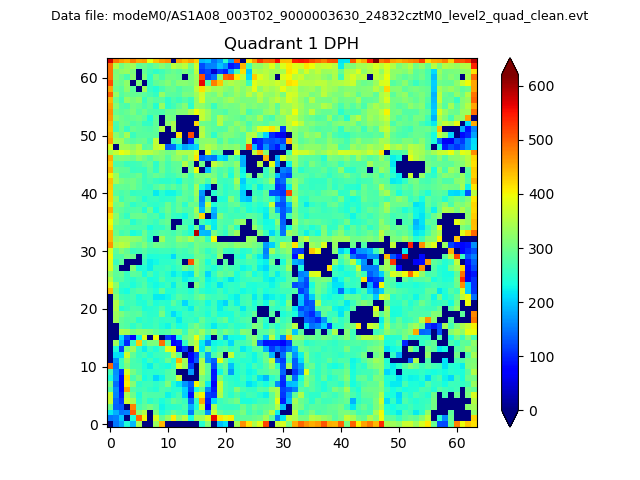 |
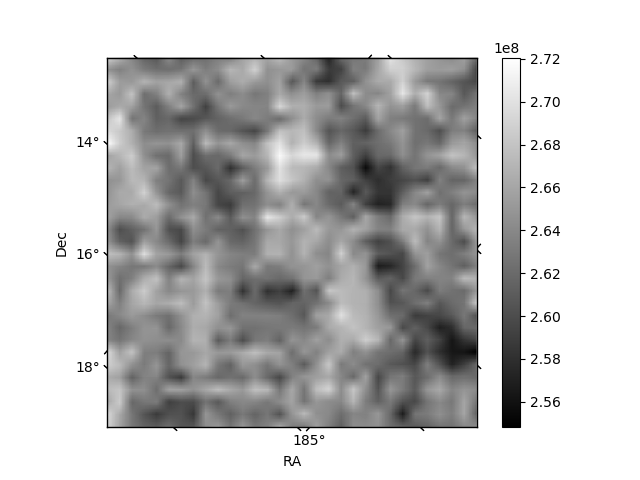
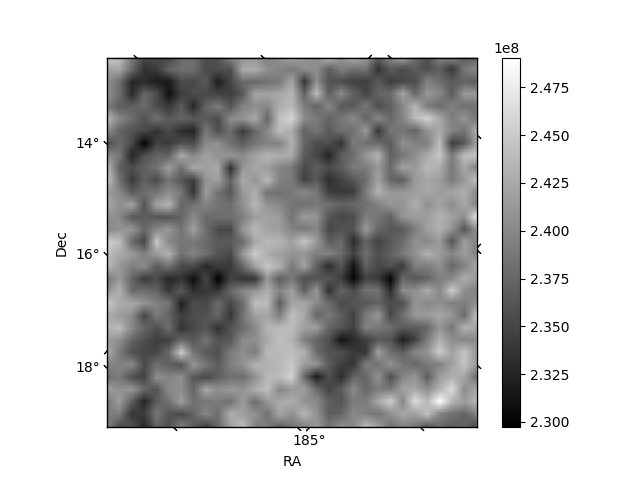
Quadrant B |
|---|---|---|---|
| Quadrant D | 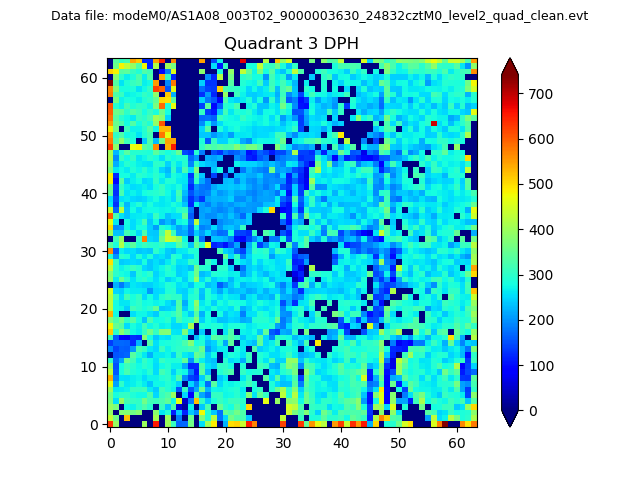 |
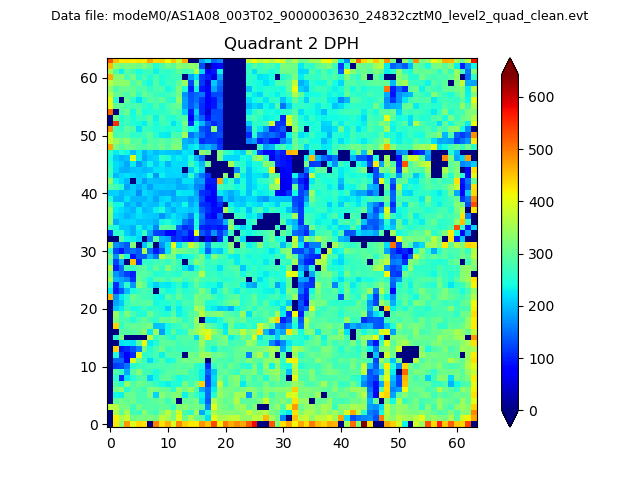 |
Quadrant C |
| Plot type | Count rate plots | Images |
|---|---|---|
| Comparison with Poisson distribution Blue bars denote a histogram of data divided into 1 sec bins. Red curve is a Poisson curve with rate = median count rate of data. |
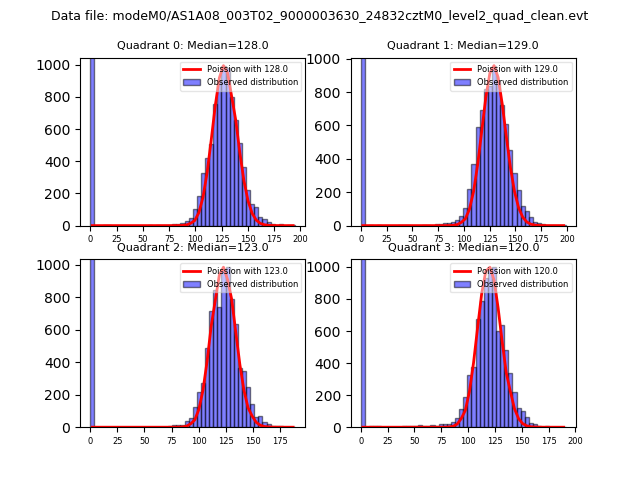 |
 |
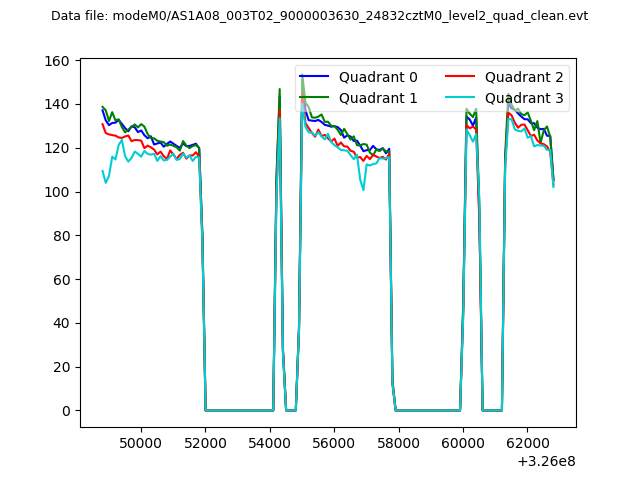
| Quadrant-wise count rates Data is divided into 100 sec bins |
 |
|
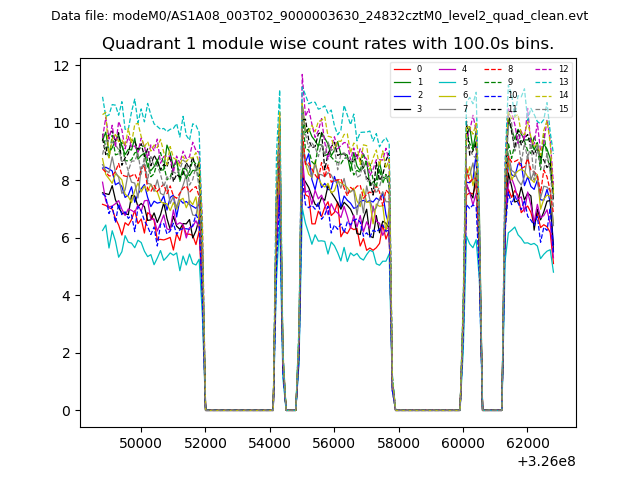
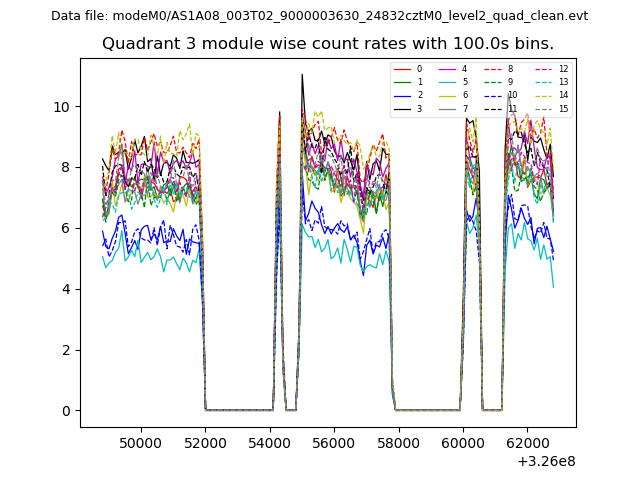
| Module-wise count rates for Quadrant A Data is divided into 100 sec bins |
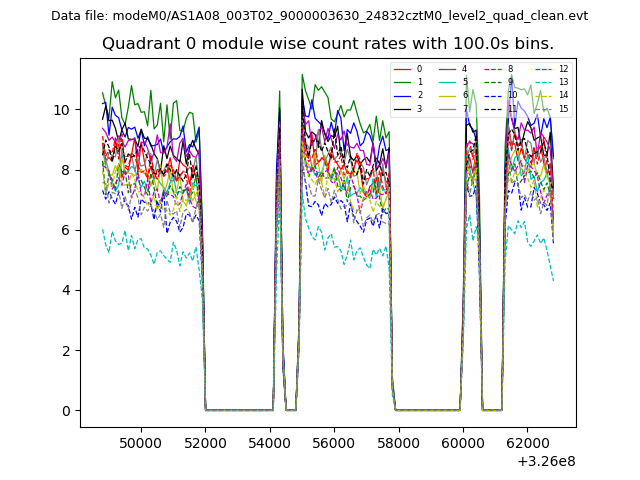 |
 |
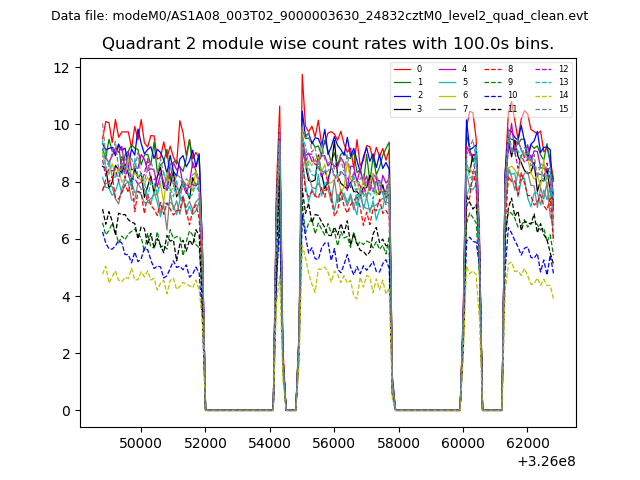
| Module-wise count rates for Quadrant B Data is divided into 100 sec bins |
 |
 |
| Module-wise count rates for Quadrant C Data is divided into 100 sec bins |
 |
 |
| Module-wise count rates for Quadrant D Data is divided into 100 sec bins |
 |
 |
| Parameter | Plot |
|---|---|
| CZT HV Monitor | 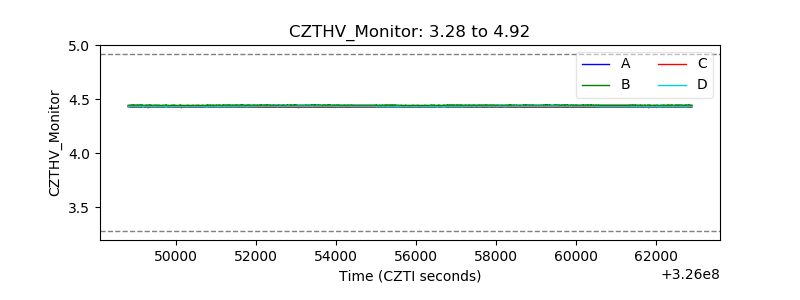 |
| D_VDD | 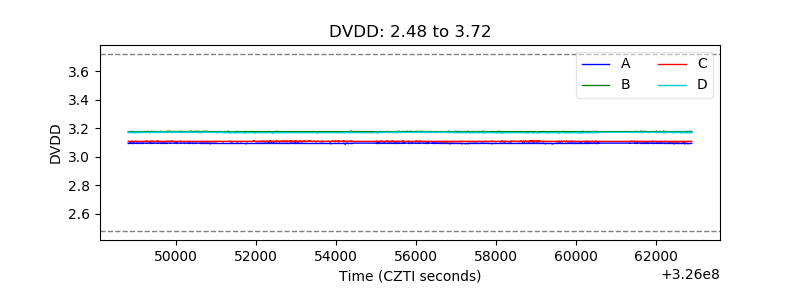 |
| Temperature 1 | 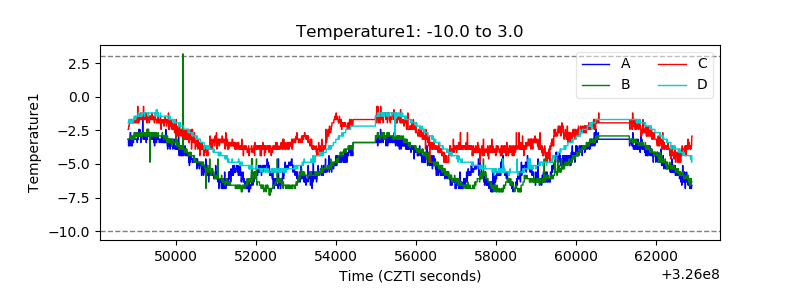 |
| Veto HV Monitor | 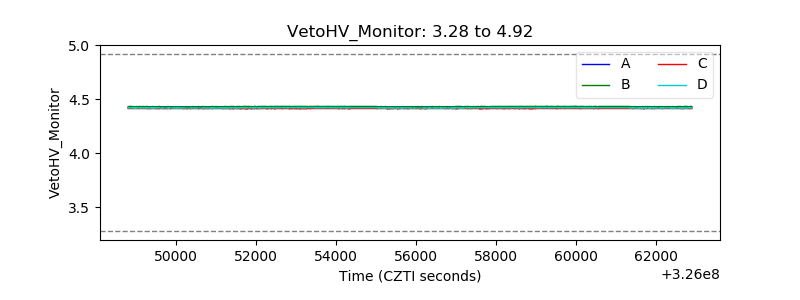 |
| Veto LLD | 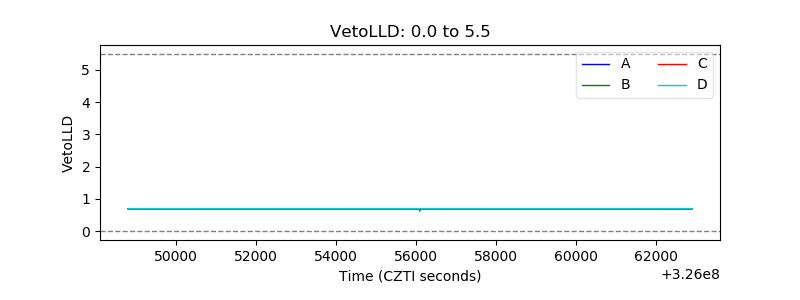 |
| Alpha Counter | 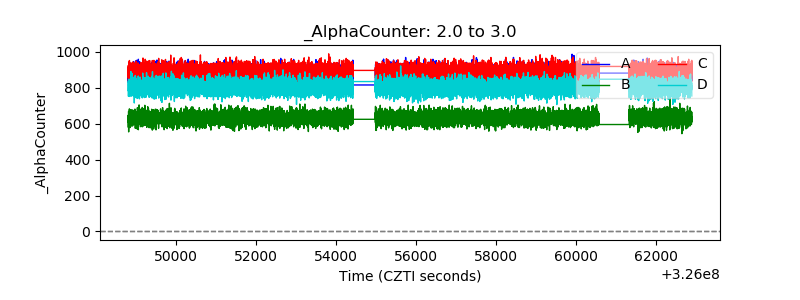 |
| _CPM_Rate | 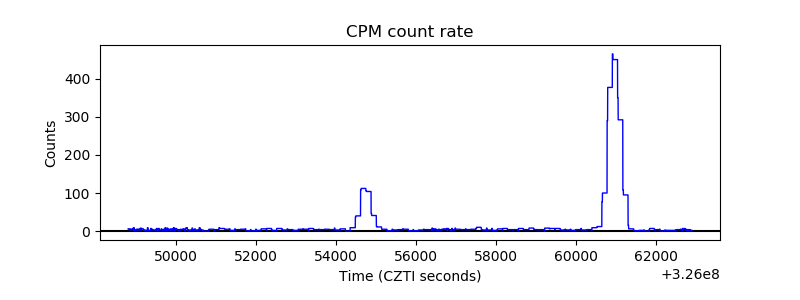 |
| CZT Counter | 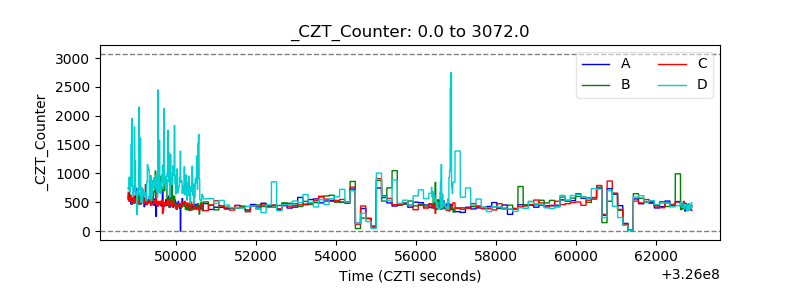 |
| +2.5 Volts monitor |  |
| +5 Volts monitor |  |
| _ROLL_ROT | 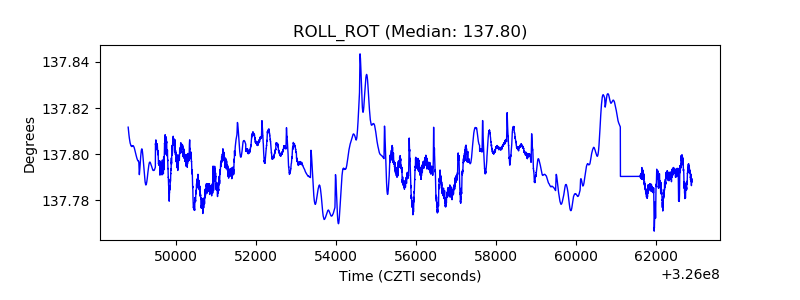 |
| _Roll_DEC | 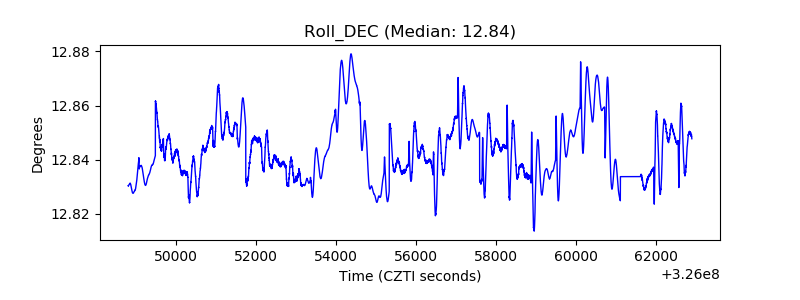 |
| _Roll_RA | 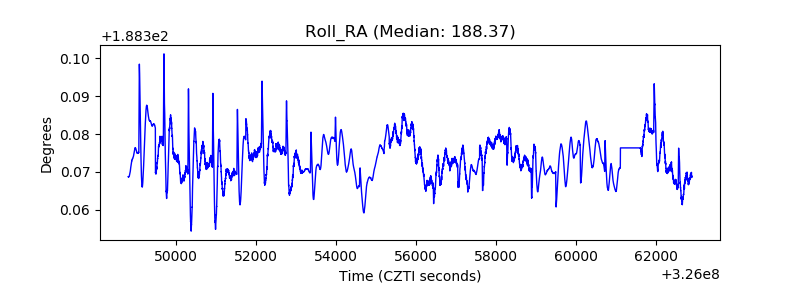 |
| Veto Counter | 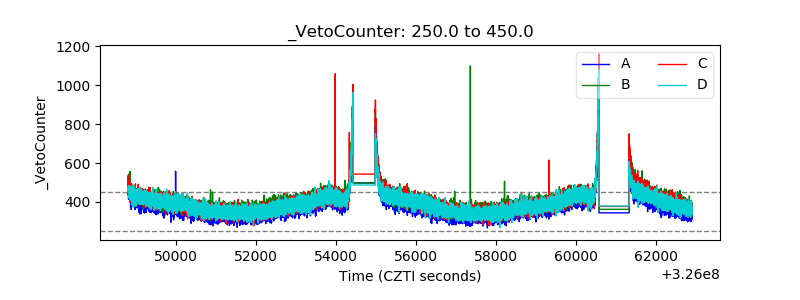 |