| Param | Original file | Final file |
|---|---|---|
| Filename | modeM0/AS1A08_003T02_9000003630_24833cztM0_level2.evt | modeM0/AS1A08_003T02_9000003630_24833cztM0_level2_quad_clean.evt |
| Size (bytes) | 430,194,240 | 88,534,080 |
| Size | 410.3 MB | 84.4 MB |
| Events in quadrant A | 3,053,580 | 567,978 |
| Events in quadrant B | 3,176,242 | 576,496 |
| Events in quadrant C | 3,093,935 | 544,713 |
| Events in quadrant D | 3,261,350 | 537,204 |
| Mode M0 | |||
|---|---|---|---|
| Quadrant | BADHDUFLAG | Total packets | Discarded packets |
| A | 0 | 13308 | 2 |
| B | 0 | 13564 | 2 |
| C | 0 | 13370 | 2 |
| D | 0 | 14117 | 2 |
| Mode M9 | |||
|---|---|---|---|
| Quadrant | BADHDUFLAG | Total packets | Discarded packets |
| A | 0 | 16 | 0 |
| B | 0 | 17 | 0 |
| C | 0 | 17 | 0 |
| D | 0 | 17 | 0 |
| Mode SS | |||
|---|---|---|---|
| Quadrant | BADHDUFLAG | Total packets | Discarded packets |
| A | 0 | 132 | 0 |
| B | 0 | 132 | 0 |
| C | 0 | 132 | 0 |
| D | 0 | 132 | 0 |
| Quadrant | Total seconds | Saturated seconds | Saturation percentage |
|---|---|---|---|
| A | 6520 | 16 | 0.245399% |
| B | 6520 | 32 | 0.490798% |
| C | 6520 | 66 | 1.012270% |
| D | 6520 | 35 | 0.536810% |
Noise dominated data is calculated using 1-second bins in cleaned event files. If a bin has >2000 counts, and if more than 50% of those come from <1% of pixels, then it is considered to be noise-dominated and hence unusable.
| Quadrant | # 1 sec bins | Bins with >0 counts | Bins with >2000 counts | High rate bins dominated by noise | Noise dominated (total time) | Noise dominated (detector-on time) | Marked lightcurve |
|---|---|---|---|---|---|---|---|
| A | 7465 | 6521 | 0 | 0 | 0.00% | 0.00% | 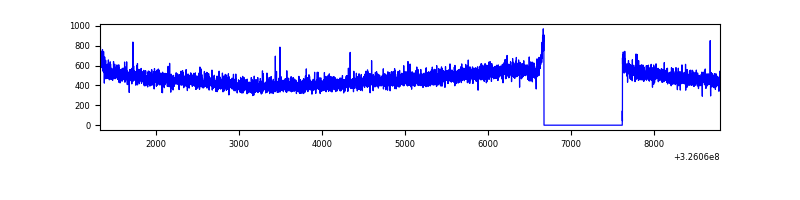 |
| B | 7465 | 6521 | 11 | 11 | 0.15% | 0.17% | 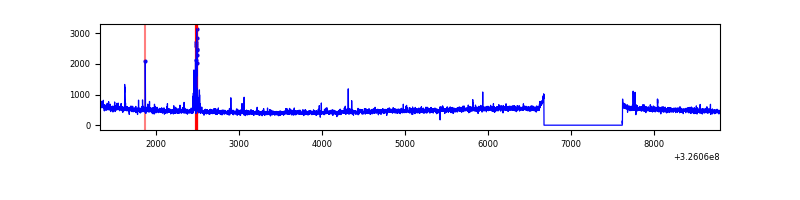 |
| C | 7465 | 6521 | 0 | 0 | 0.00% | 0.00% |  |
| D | 7465 | 6521 | 18 | 18 | 0.24% | 0.28% | 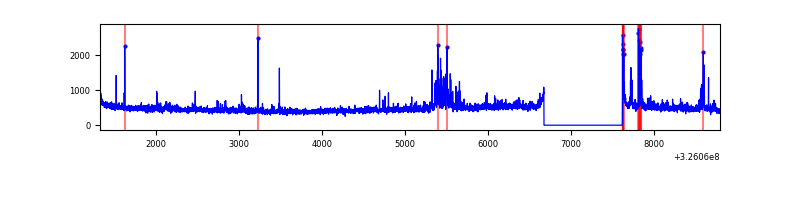 |
Top three noisy pixels from each quadrant. If the there are fewer than three noisy pixels in the level2.evt file, extra rows are filled as -1
| Pixel properties | Quadrant properties | ||||||
|---|---|---|---|---|---|---|---|
| Quadrant | DetID | PixID | Counts | Sigma | Mean | Median | Sigma |
| A | 13 | 254 | 9849 | 56.29 | 791 | 774 | 161.2 |
| A | 3 | 137 | 7585 | 42.24 | 791 | 774 | 161.2 |
| A | 0 | 226 | 6660 | 36.51 | 791 | 774 | 161.2 |
| B | 10 | 251 | 51130 | 333.11 | 786 | 765 | 151.2 |
| B | 7 | 202 | 22386 | 143.0 | 786 | 765 | 151.2 |
| B | 12 | 111 | 18956 | 120.31 | 786 | 765 | 151.2 |
| C | 14 | 238 | 121329 | 672.06 | 758 | 762 | 179.4 |
| C | 7 | 247 | 15581 | 82.6 | 758 | 762 | 179.4 |
| C | 13 | 61 | 5037 | 23.83 | 758 | 762 | 179.4 |
| D | 10 | 199 | 114182 | 612.41 | 765 | 745 | 185.2 |
| D | 8 | 195 | 107978 | 578.91 | 765 | 745 | 185.2 |
| D | 12 | 218 | 106437 | 570.59 | 765 | 745 | 185.2 |
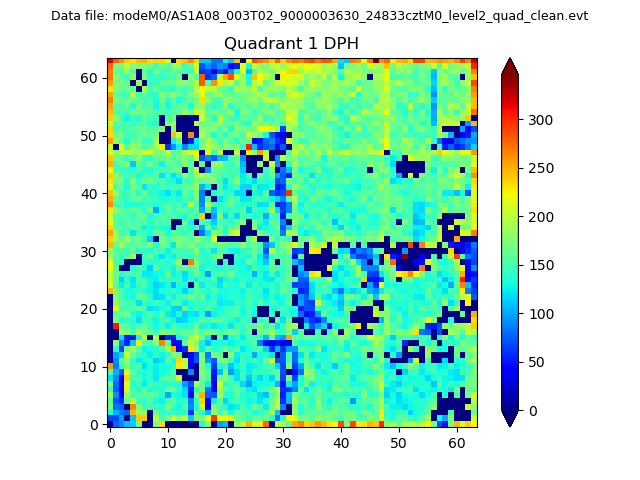
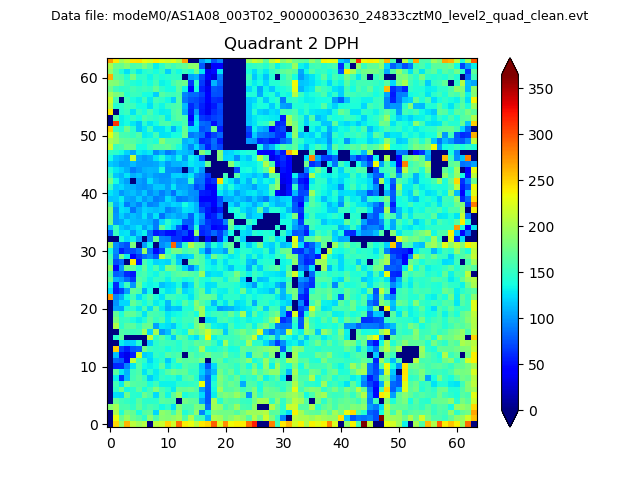
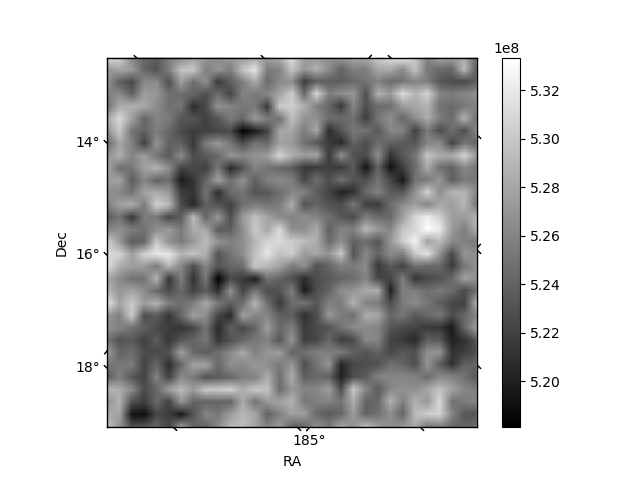
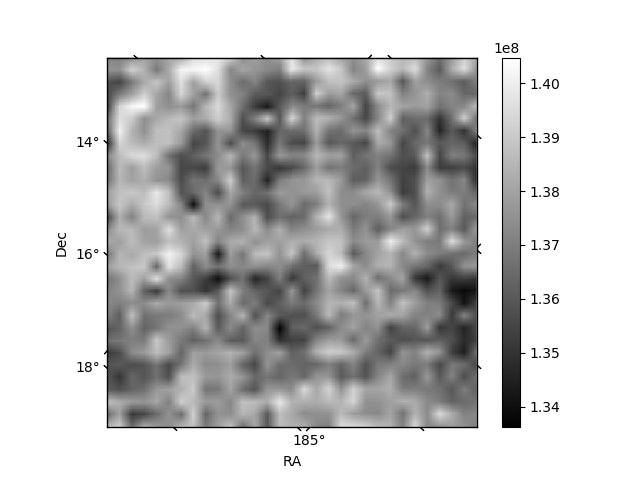
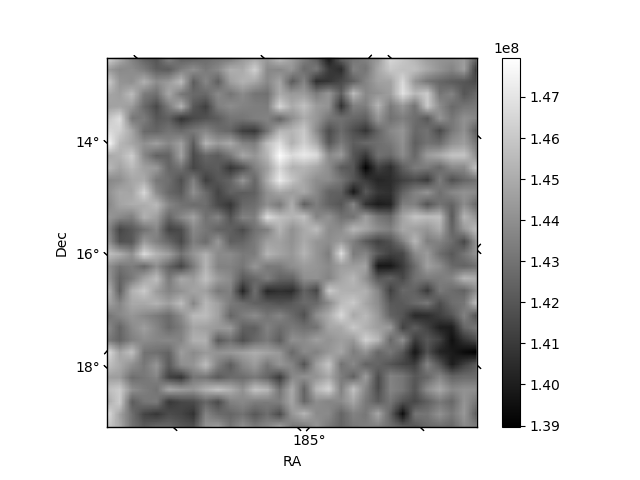
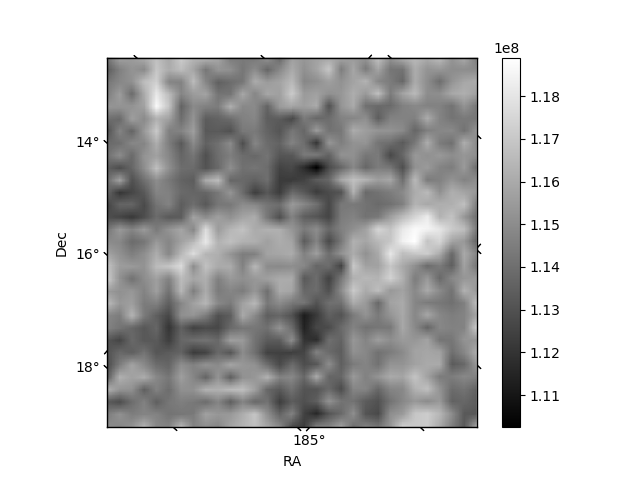
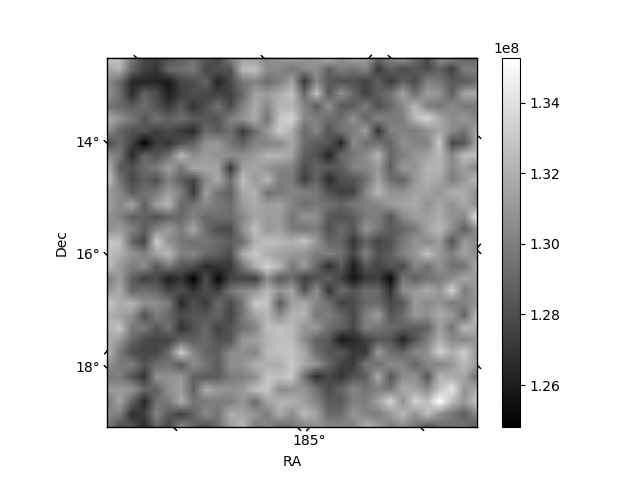
Histogram calculated using DETX and DETY for each event in the final _common_clean file
| Quadrant A | 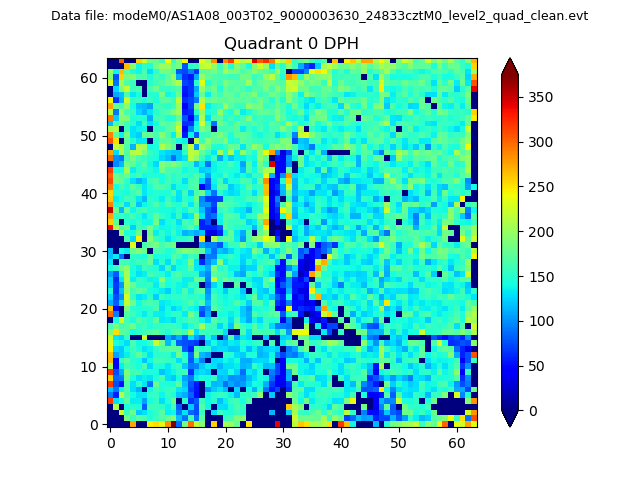 |
 |
Quadrant B |
|---|---|---|---|
| Quadrant D | 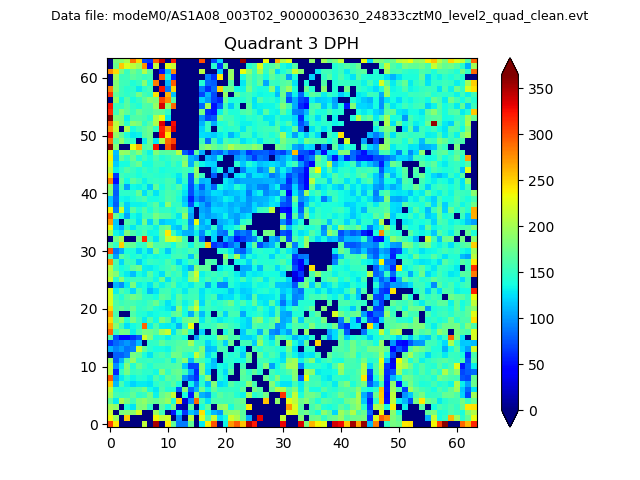 |
 |
Quadrant C |
| Plot type | Count rate plots | Images |
|---|---|---|
| Comparison with Poisson distribution Blue bars denote a histogram of data divided into 1 sec bins. Red curve is a Poisson curve with rate = median count rate of data. |
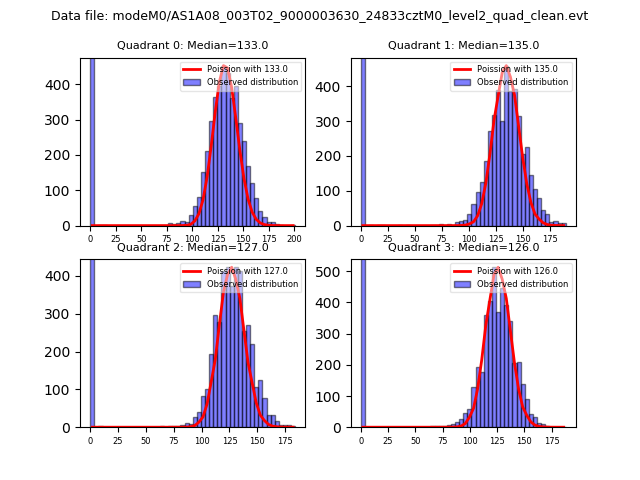 |
 |
| Quadrant-wise count rates Data is divided into 100 sec bins |
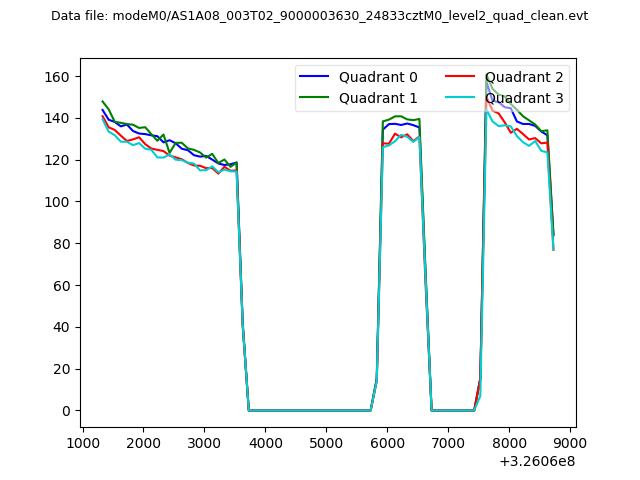 |
|
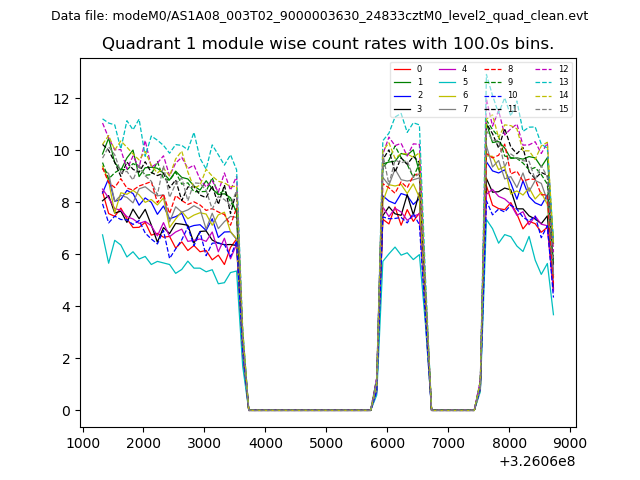
| Module-wise count rates for Quadrant A Data is divided into 100 sec bins |
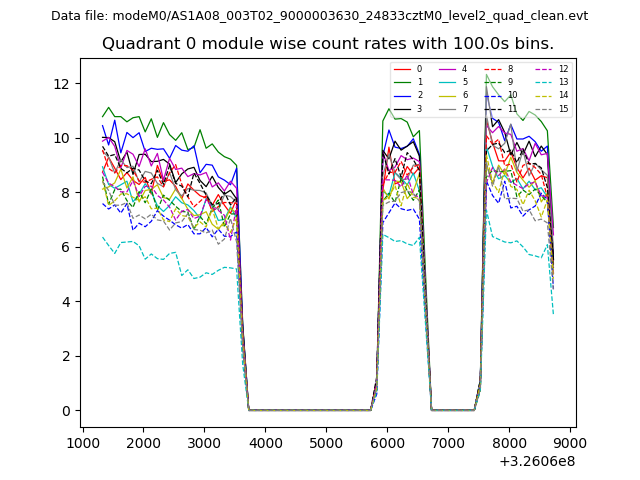 |
 |
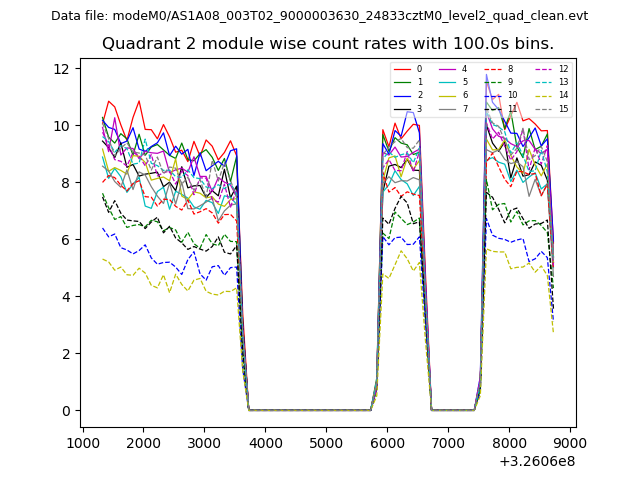
| Module-wise count rates for Quadrant B Data is divided into 100 sec bins |
 |
 |
| Module-wise count rates for Quadrant C Data is divided into 100 sec bins |
 |
 |
| Module-wise count rates for Quadrant D Data is divided into 100 sec bins |
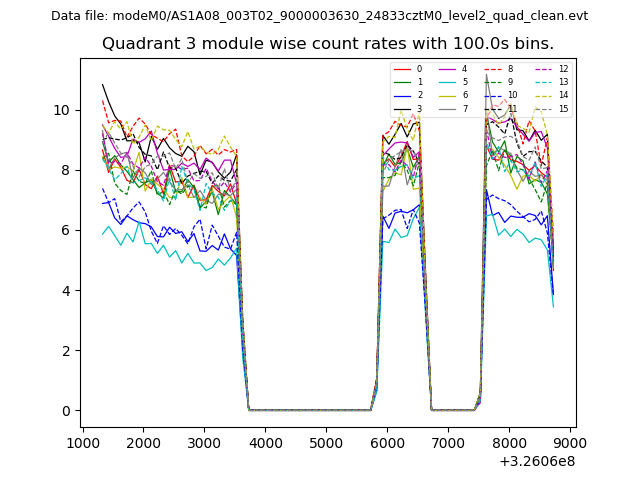 |
 |
| Parameter | Plot |
|---|---|
| CZT HV Monitor | 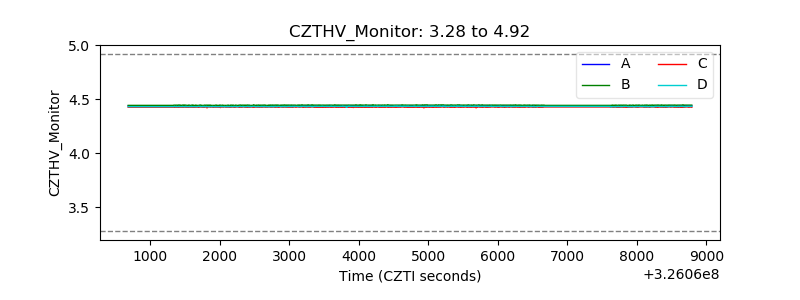 |
| D_VDD | 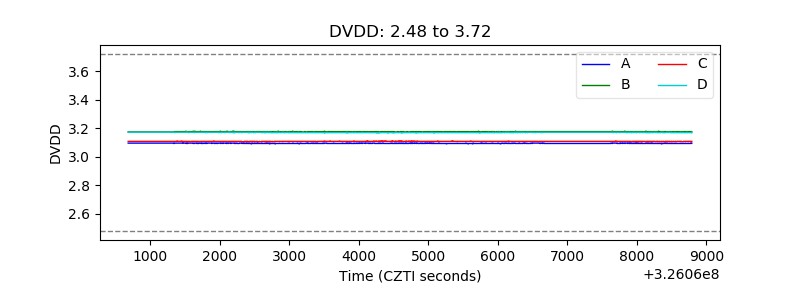 |
| Temperature 1 | 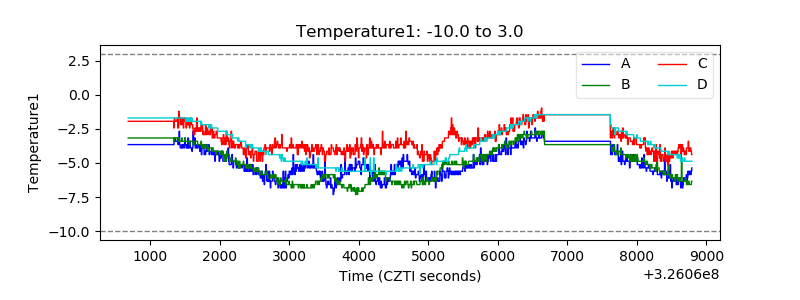 |
| Veto HV Monitor | 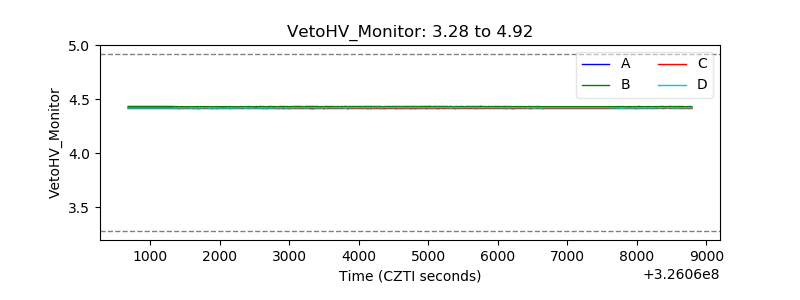 |
| Veto LLD | 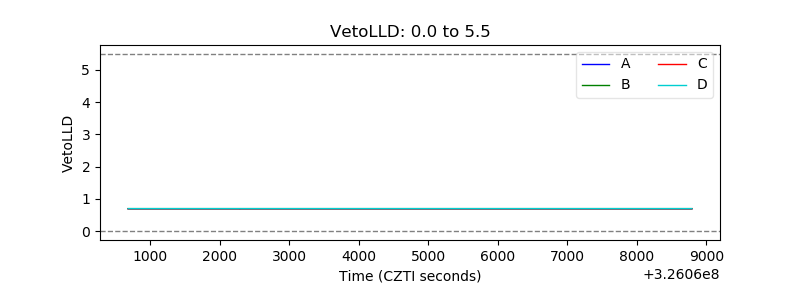 |
| Alpha Counter | 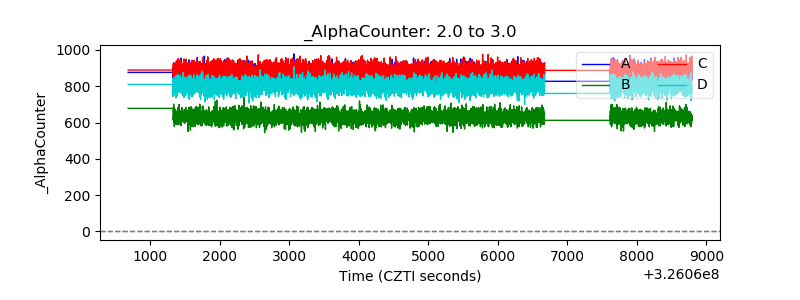 |
| _CPM_Rate | 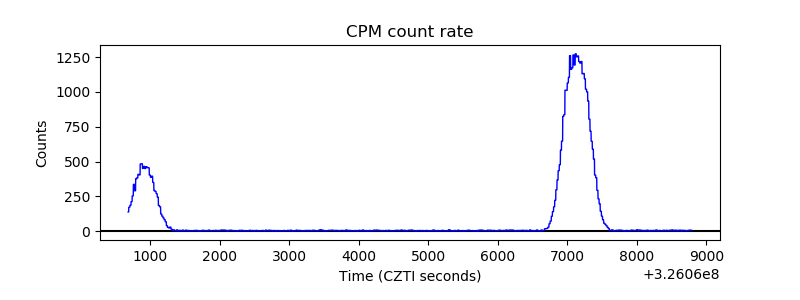 |
| CZT Counter | 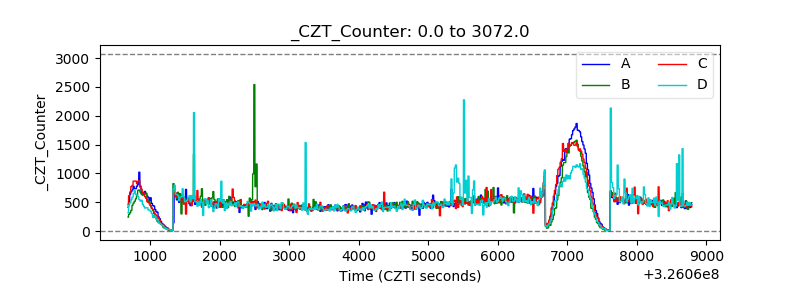 |
| +2.5 Volts monitor |  |
| +5 Volts monitor |  |
| _ROLL_ROT | 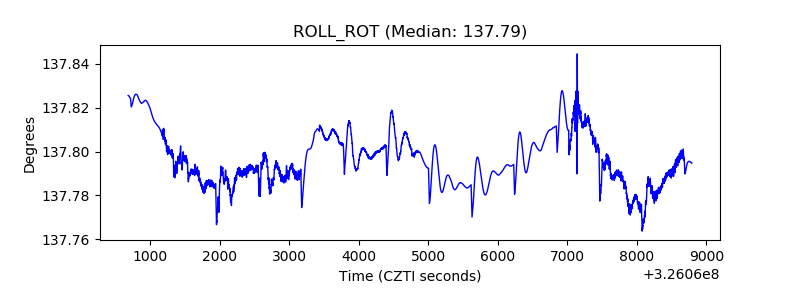 |
| _Roll_DEC | 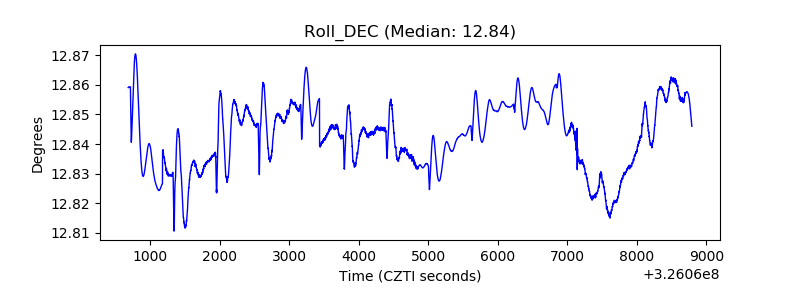 |
| _Roll_RA | 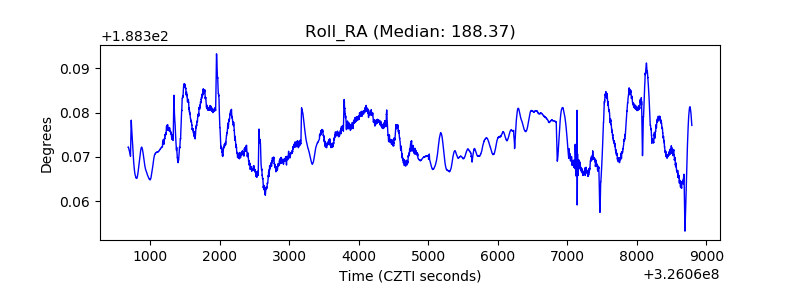 |
| Veto Counter | 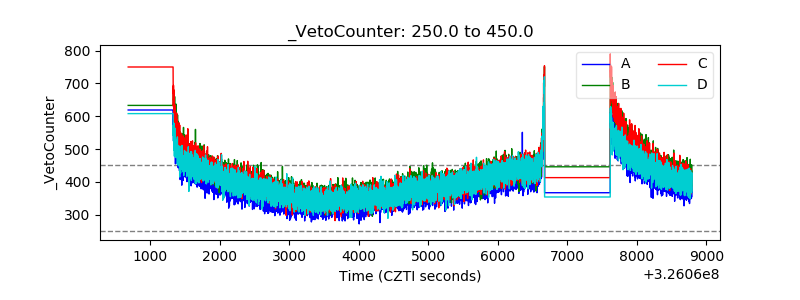 |