| Param | Original file | Final file |
|---|---|---|
| Filename | modeM0/AS1A08_003T02_9000003630_24834cztM0_level2.evt | modeM0/AS1A08_003T02_9000003630_24834cztM0_level2_quad_clean.evt |
| Size (bytes) | 83,298,240 | 24,312,960 |
| Size | 79.4 MB | 23.2 MB |
| Events in quadrant A | 577,483 | 165,479 |
| Events in quadrant B | 590,508 | 169,108 |
| Events in quadrant C | 592,377 | 158,060 |
| Events in quadrant D | 679,214 | 153,966 |
| Mode M0 | |||
|---|---|---|---|
| Quadrant | BADHDUFLAG | Total packets | Discarded packets |
| A | 0 | 2402 | 1 |
| B | 0 | 2442 | 1 |
| C | 0 | 2432 | 1 |
| D | 0 | 2763 | 1 |
| Mode M9 | |||
|---|---|---|---|
| Quadrant | BADHDUFLAG | Total packets | Discarded packets |
| A | 0 | 2 | 0 |
| B | 0 | 3 | 0 |
| C | 0 | 3 | 0 |
| D | 0 | 3 | 0 |
| Mode SS | |||
|---|---|---|---|
| Quadrant | BADHDUFLAG | Total packets | Discarded packets |
| A | 0 | 24 | 0 |
| B | 0 | 24 | 0 |
| C | 0 | 24 | 0 |
| D | 0 | 24 | 0 |
| Quadrant | Total seconds | Saturated seconds | Saturation percentage |
|---|---|---|---|
| A | 1175 | 3 | 0.255319% |
| B | 1175 | 2 | 0.170213% |
| C | 1175 | 8 | 0.680851% |
| D | 1175 | 24 | 2.042553% |
Noise dominated data is calculated using 1-second bins in cleaned event files. If a bin has >2000 counts, and if more than 50% of those come from <1% of pixels, then it is considered to be noise-dominated and hence unusable.
| Quadrant | # 1 sec bins | Bins with >0 counts | Bins with >2000 counts | High rate bins dominated by noise | Noise dominated (total time) | Noise dominated (detector-on time) | Marked lightcurve |
|---|---|---|---|---|---|---|---|
| A | 1175 | 1175 | 0 | 0 | 0.00% | 0.00% | 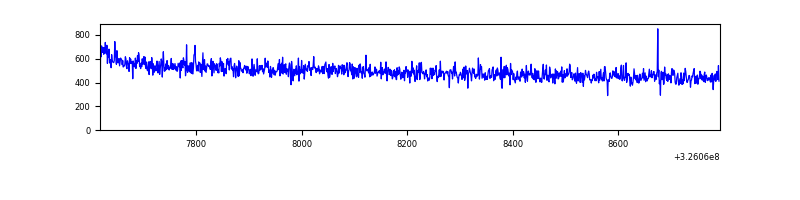 |
| B | 1175 | 1175 | 0 | 0 | 0.00% | 0.00% | 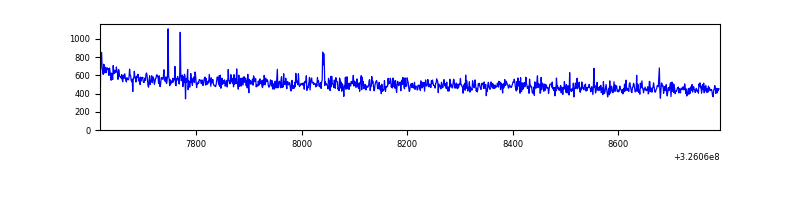 |
| C | 1175 | 1175 | 0 | 0 | 0.00% | 0.00% | 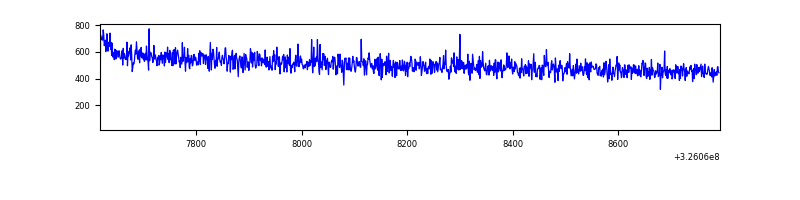 |
| D | 1175 | 1175 | 14 | 14 | 1.19% | 1.19% |  |
Top three noisy pixels from each quadrant. If the there are fewer than three noisy pixels in the level2.evt file, extra rows are filled as -1
| Pixel properties | Quadrant properties | ||||||
|---|---|---|---|---|---|---|---|
| Quadrant | DetID | PixID | Counts | Sigma | Mean | Median | Sigma |
| A | 13 | 254 | 1927 | 56.02 | 149 | 146 | 31.8 |
| A | 3 | 137 | 1353 | 37.96 | 149 | 146 | 31.8 |
| A | 0 | 226 | 1271 | 35.38 | 149 | 146 | 31.8 |
| B | 12 | 111 | 3479 | 110.65 | 149 | 145 | 30.1 |
| B | 7 | 202 | 3124 | 98.87 | 149 | 145 | 30.1 |
| B | 11 | 111 | 3049 | 96.38 | 149 | 145 | 30.1 |
| C | 14 | 238 | 23760 | 654.26 | 145 | 146 | 36.1 |
| C | 7 | 247 | 3472 | 92.15 | 145 | 146 | 36.1 |
| C | 13 | 61 | 891 | 20.64 | 145 | 146 | 36.1 |
| D | 12 | 218 | 105775 | 2907.51 | 144 | 140 | 36.3 |
| D | 8 | 195 | 20289 | 554.58 | 144 | 140 | 36.3 |
| D | 2 | 234 | 5027 | 134.51 | 144 | 140 | 36.3 |
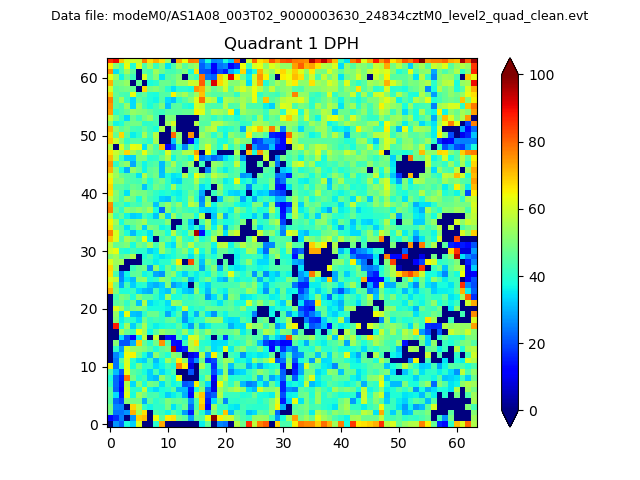
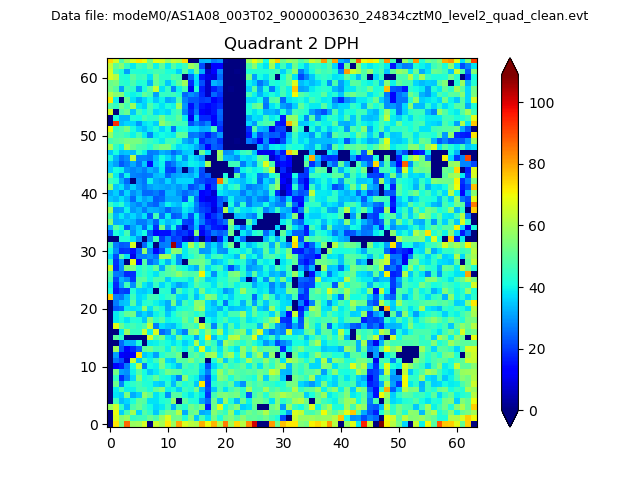
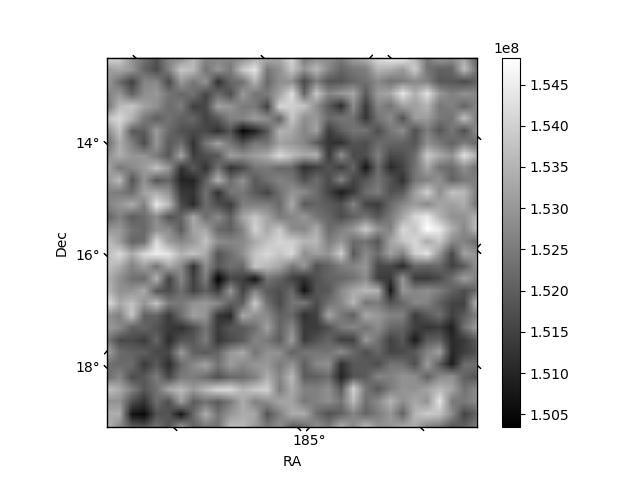
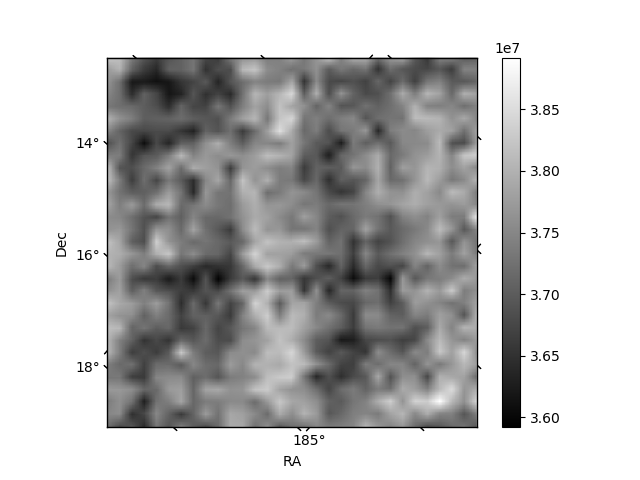
Histogram calculated using DETX and DETY for each event in the final _common_clean file
| Quadrant A | 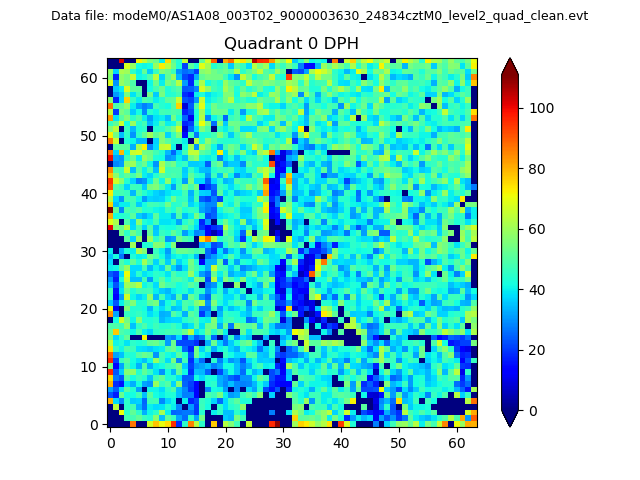 |
 |
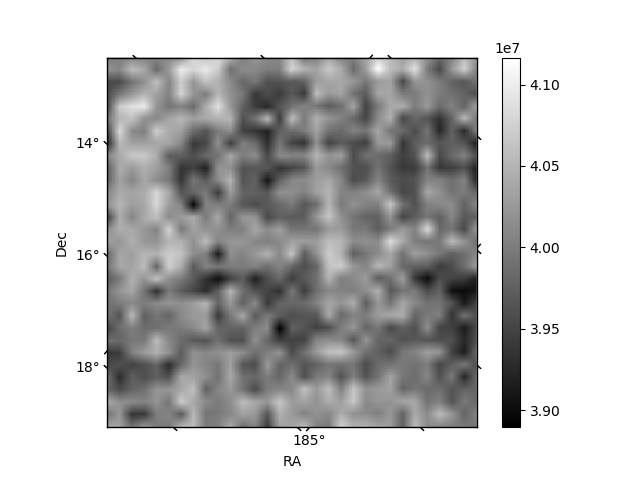
Quadrant B |
|---|---|---|---|
| Quadrant D | 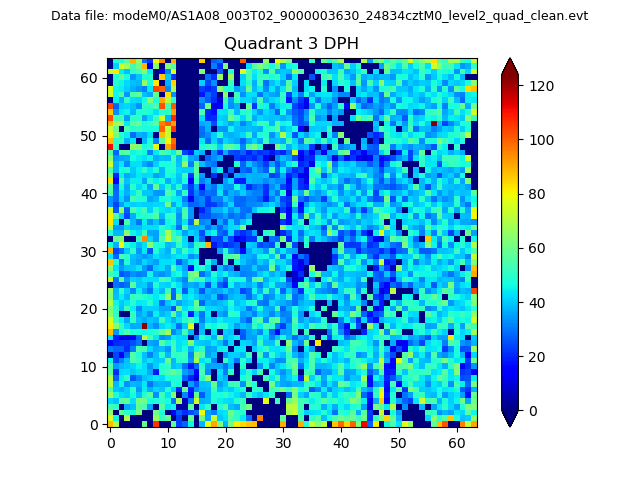 |
 |
Quadrant C |
| Plot type | Count rate plots | Images |
|---|---|---|
| Comparison with Poisson distribution Blue bars denote a histogram of data divided into 1 sec bins. Red curve is a Poisson curve with rate = median count rate of data. |
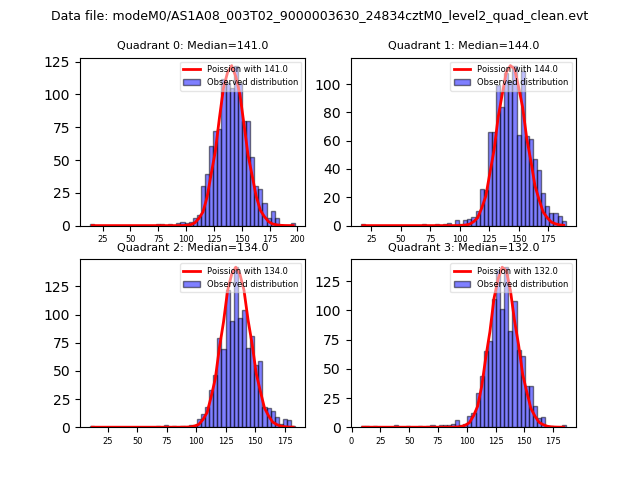 |
 |
| Quadrant-wise count rates Data is divided into 100 sec bins |
 |
|
| Module-wise count rates for Quadrant A Data is divided into 100 sec bins |
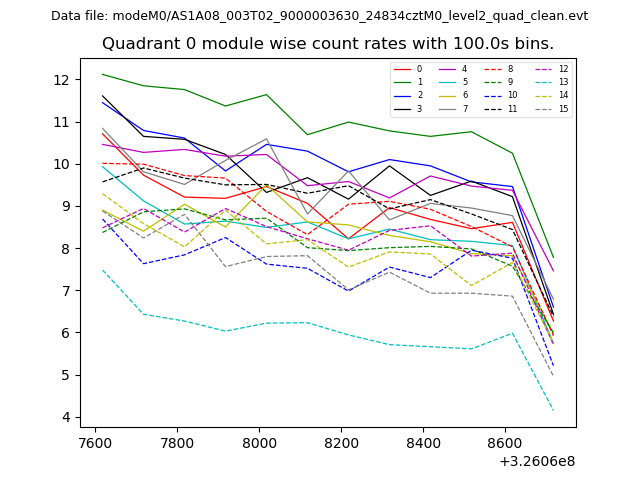 |
 |
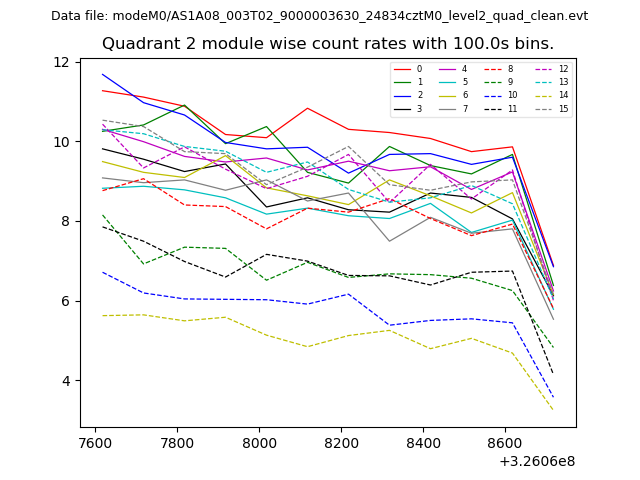
| Module-wise count rates for Quadrant B Data is divided into 100 sec bins |
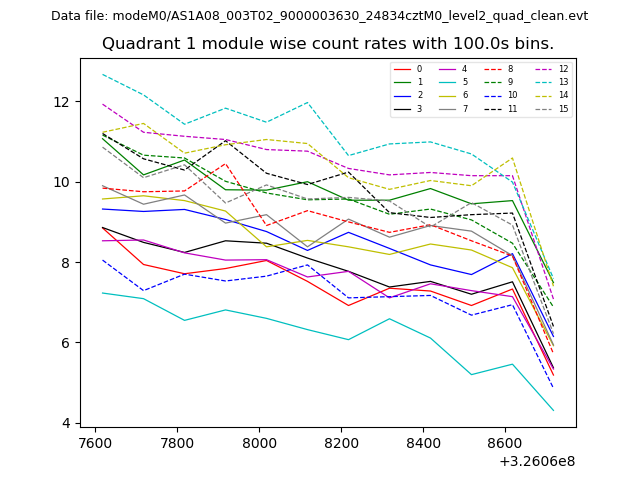 |
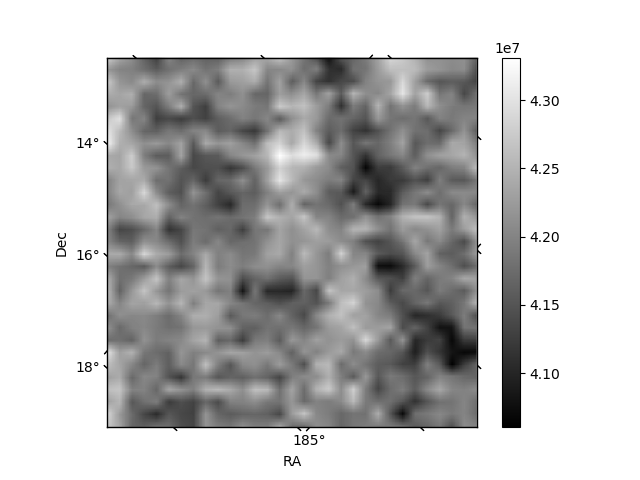 |
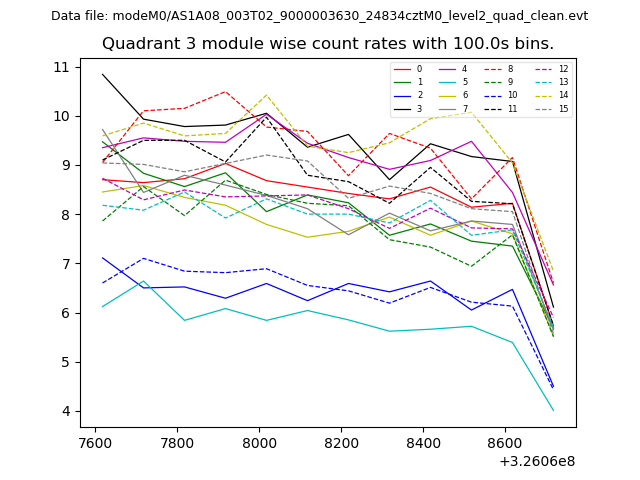
| Module-wise count rates for Quadrant C Data is divided into 100 sec bins |
 |
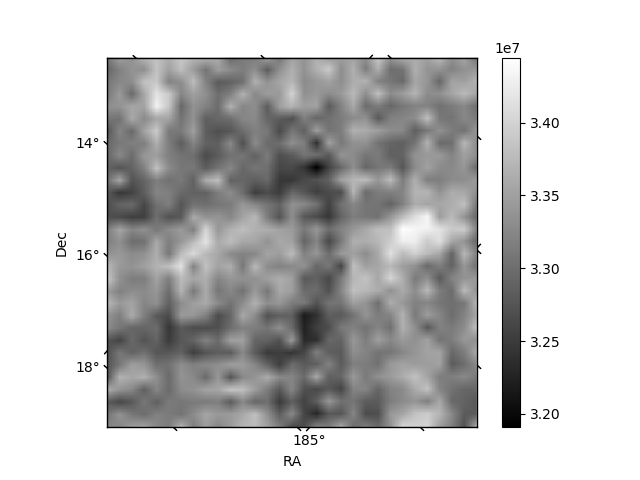 |
| Module-wise count rates for Quadrant D Data is divided into 100 sec bins |
 |
 |
| Parameter | Plot |
|---|---|
| CZT HV Monitor | 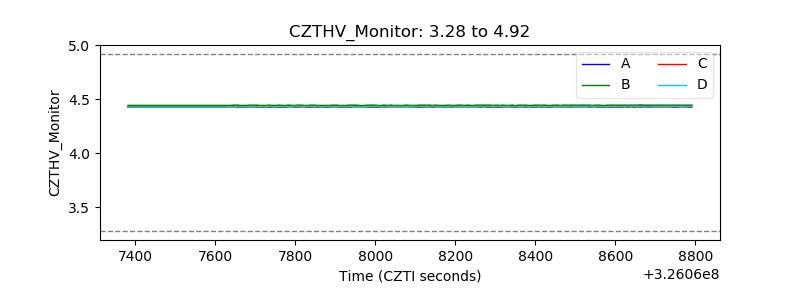 |
| D_VDD | 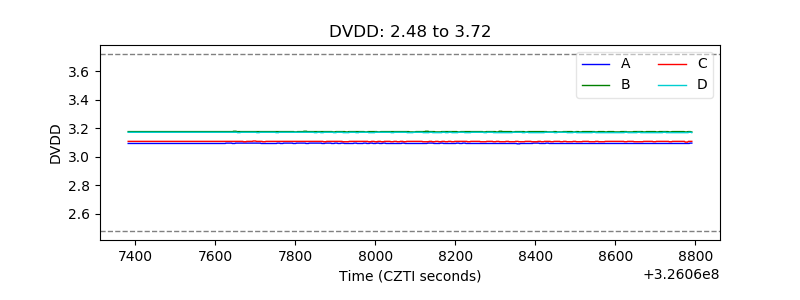 |
| Temperature 1 | 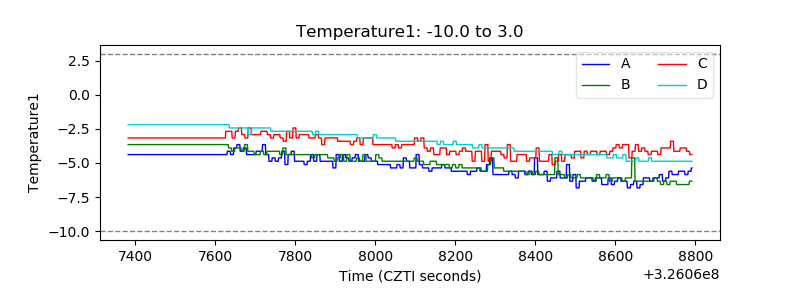 |
| Veto HV Monitor |  |
| Veto LLD | 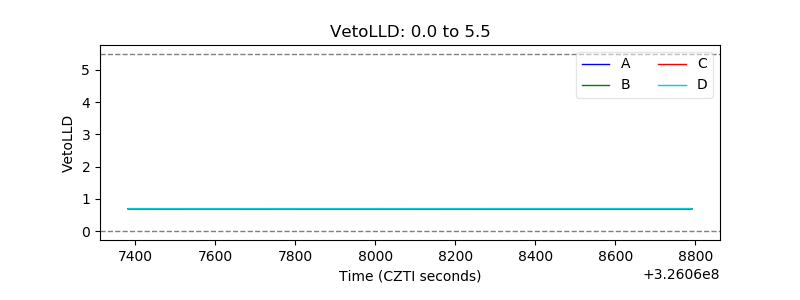 |
| Alpha Counter | 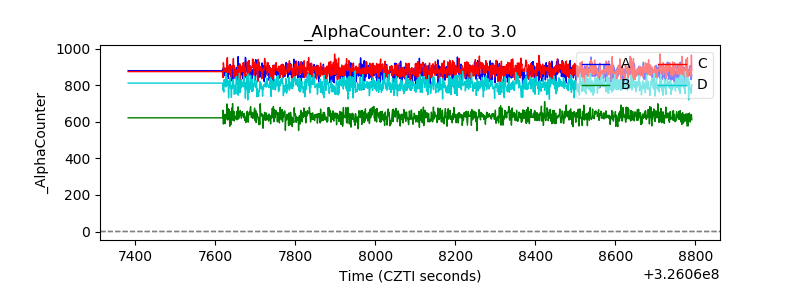 |
| _CPM_Rate | 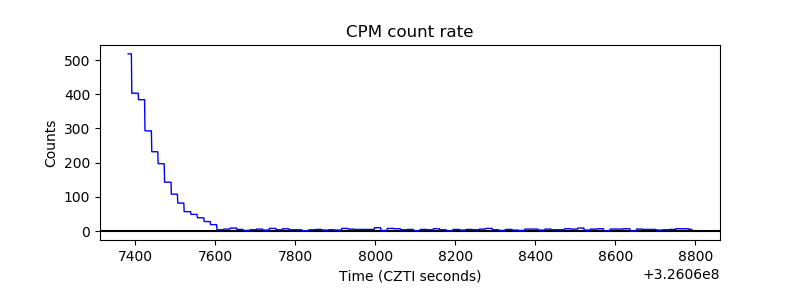 |
| CZT Counter | 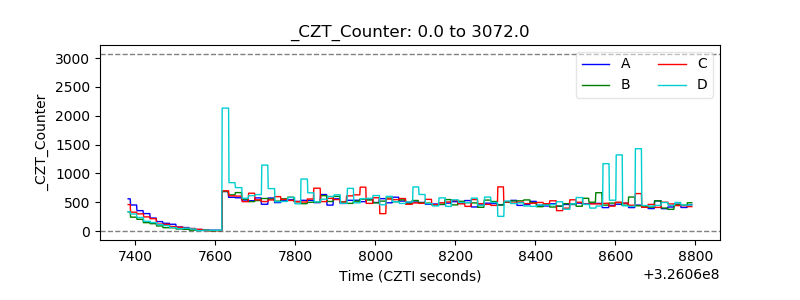 |
| +2.5 Volts monitor |  |
| +5 Volts monitor |  |
| _ROLL_ROT | 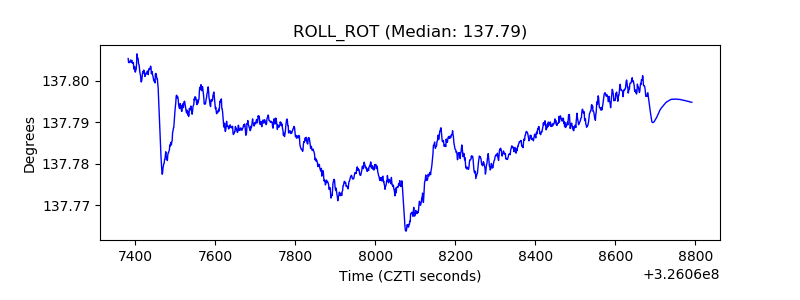 |
| _Roll_DEC | 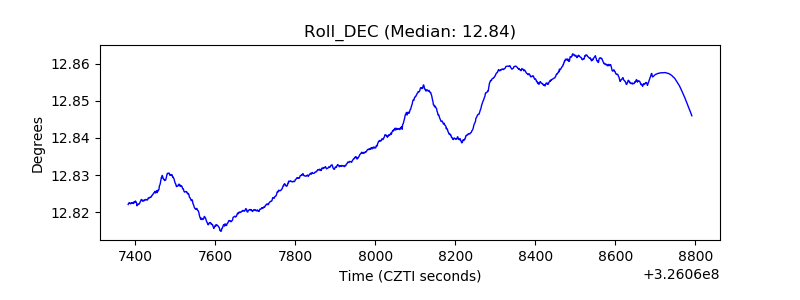 |
| _Roll_RA | 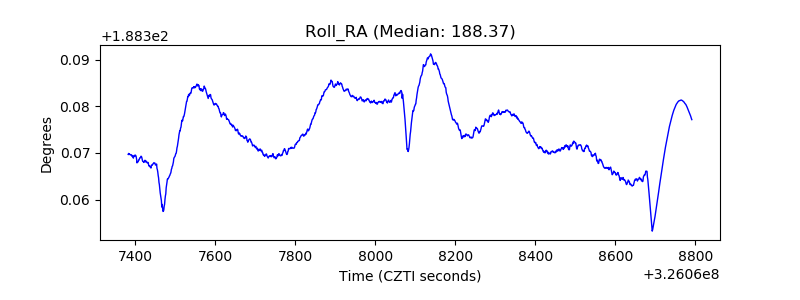 |
| Veto Counter | 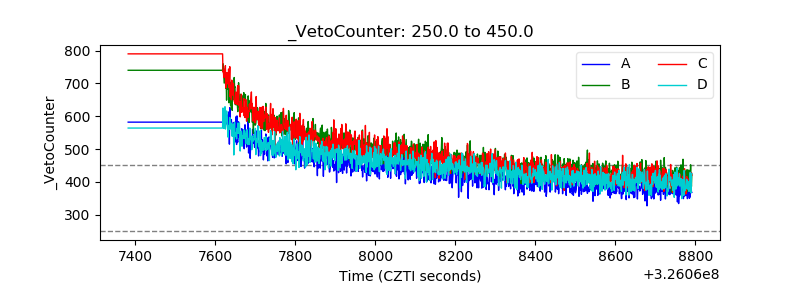 |