| Param | Original file | Final file |
|---|---|---|
| Filename | modeM0/AS1A08_003T03_9000003632_24837cztM0_level2.evt | modeM0/AS1A08_003T03_9000003632_24837cztM0_level2_quad_clean.evt |
| Size (bytes) | 459,691,200 | 82,863,360 |
| Size | 438.4 MB | 79.0 MB |
| Events in quadrant A | 3,219,001 | 534,979 |
| Events in quadrant B | 3,422,709 | 550,975 |
| Events in quadrant C | 3,268,968 | 507,547 |
| Events in quadrant D | 3,592,475 | 485,316 |
| Mode M0 | |||
|---|---|---|---|
| Quadrant | BADHDUFLAG | Total packets | Discarded packets |
| A | 0 | 13166 | 2 |
| B | 0 | 13798 | 2 |
| C | 0 | 13299 | 2 |
| D | 0 | 14514 | 2 |
| Mode M9 | |||
|---|---|---|---|
| Quadrant | BADHDUFLAG | Total packets | Discarded packets |
| A | 0 | 13 | 0 |
| B | 0 | 13 | 0 |
| C | 0 | 13 | 0 |
| D | 0 | 13 | 0 |
| Mode SS | |||
|---|---|---|---|
| Quadrant | BADHDUFLAG | Total packets | Discarded packets |
| A | 0 | 126 | 0 |
| B | 0 | 126 | 0 |
| C | 0 | 126 | 0 |
| D | 0 | 126 | 0 |
| Quadrant | Total seconds | Saturated seconds | Saturation percentage |
|---|---|---|---|
| A | 6165 | 24 | 0.389294% |
| B | 6165 | 53 | 0.859692% |
| C | 6166 | 54 | 0.875770% |
| D | 6166 | 105 | 1.702887% |
Noise dominated data is calculated using 1-second bins in cleaned event files. If a bin has >2000 counts, and if more than 50% of those come from <1% of pixels, then it is considered to be noise-dominated and hence unusable.
| Quadrant | # 1 sec bins | Bins with >0 counts | Bins with >2000 counts | High rate bins dominated by noise | Noise dominated (total time) | Noise dominated (detector-on time) | Marked lightcurve |
|---|---|---|---|---|---|---|---|
| A | 7435 | 6166 | 0 | 0 | 0.00% | 0.00% | 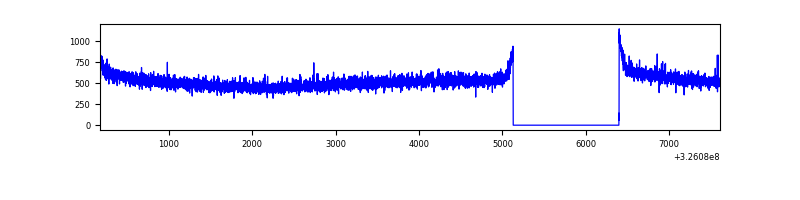 |
| B | 7435 | 6166 | 9 | 9 | 0.12% | 0.15% | 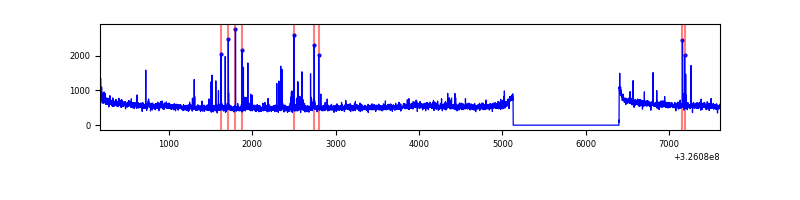 |
| C | 7436 | 6167 | 0 | 0 | 0.00% | 0.00% | 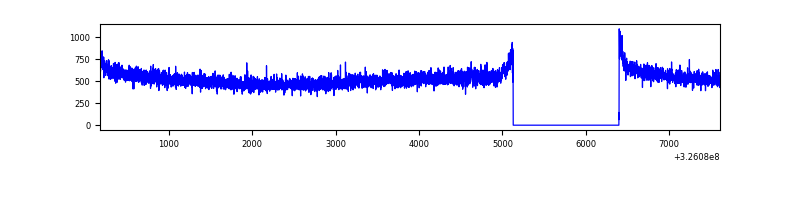 |
| D | 7436 | 6167 | 78 | 78 | 1.05% | 1.26% | 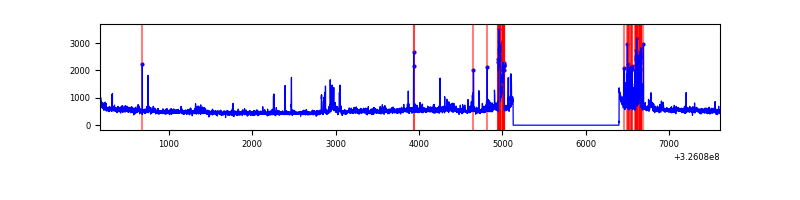 |
Top three noisy pixels from each quadrant. If the there are fewer than three noisy pixels in the level2.evt file, extra rows are filled as -1
| Pixel properties | Quadrant properties | ||||||
|---|---|---|---|---|---|---|---|
| Quadrant | DetID | PixID | Counts | Sigma | Mean | Median | Sigma |
| A | 13 | 254 | 9112 | 49.87 | 834 | 819 | 166.3 |
| A | 3 | 137 | 7293 | 38.93 | 834 | 819 | 166.3 |
| A | 0 | 226 | 7119 | 37.88 | 834 | 819 | 166.3 |
| B | 0 | 189 | 59946 | 376.77 | 834 | 817 | 156.9 |
| B | 4 | 80 | 50613 | 317.3 | 834 | 817 | 156.9 |
| B | 10 | 251 | 31715 | 196.88 | 834 | 817 | 156.9 |
| C | 14 | 238 | 128171 | 697.46 | 789 | 799 | 182.6 |
| C | 7 | 247 | 65713 | 355.46 | 789 | 799 | 182.6 |
| C | 13 | 61 | 5507 | 25.78 | 789 | 799 | 182.6 |
| D | 1 | 52 | 252839 | 1328.18 | 786 | 766 | 189.8 |
| D | 8 | 195 | 180750 | 948.34 | 786 | 766 | 189.8 |
| D | 5 | 222 | 144881 | 759.34 | 786 | 766 | 189.8 |
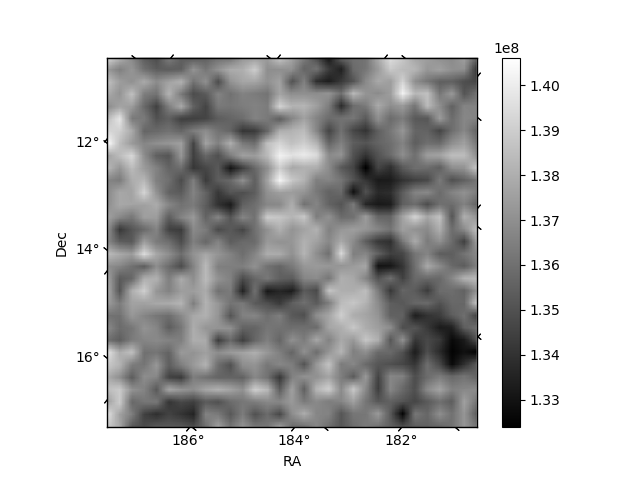
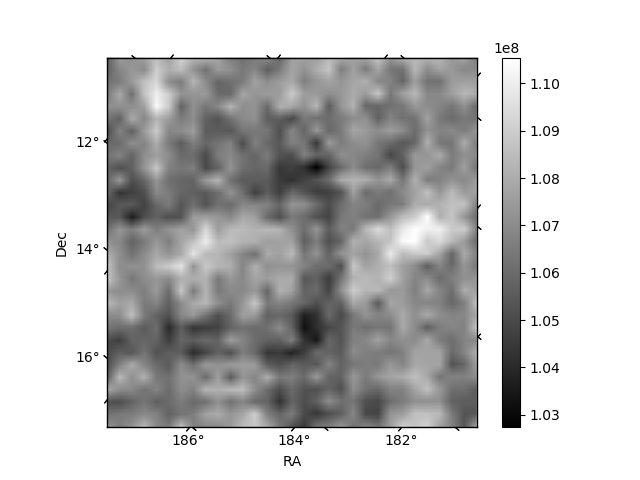
Histogram calculated using DETX and DETY for each event in the final _common_clean file
| Quadrant A | 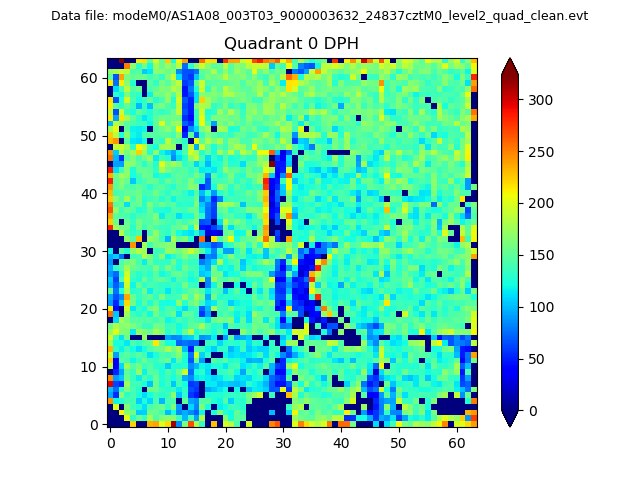 |
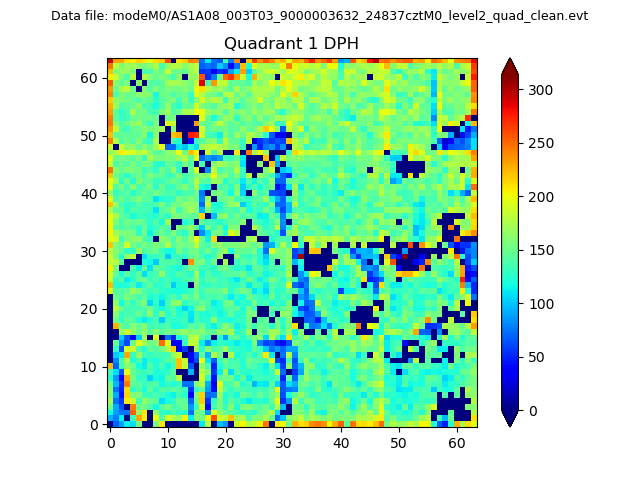 |
Quadrant B |
|---|---|---|---|
| Quadrant D | 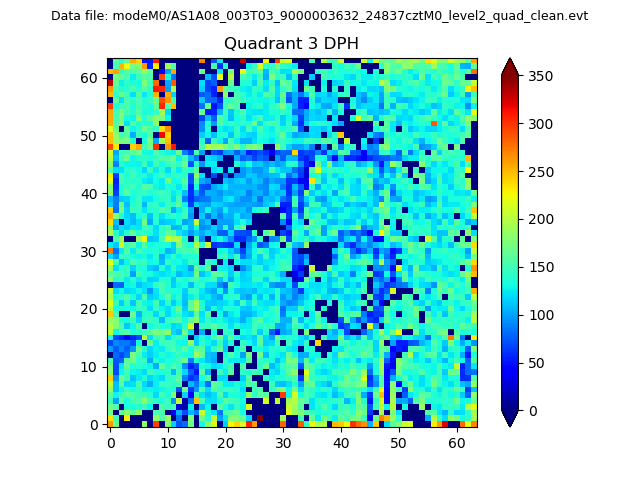 |
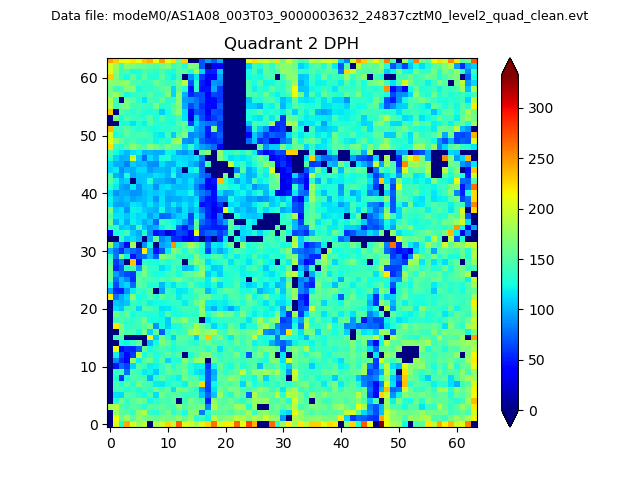 |
Quadrant C |
| Plot type | Count rate plots | Images |
|---|---|---|
| Comparison with Poisson distribution Blue bars denote a histogram of data divided into 1 sec bins. Red curve is a Poisson curve with rate = median count rate of data. |
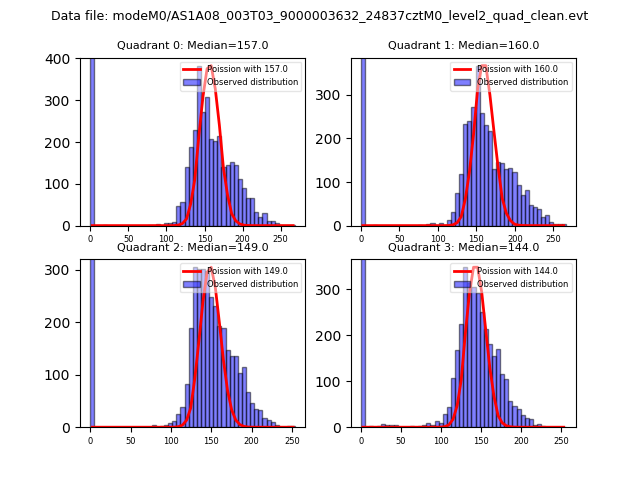 |
 |
| Quadrant-wise count rates Data is divided into 100 sec bins |
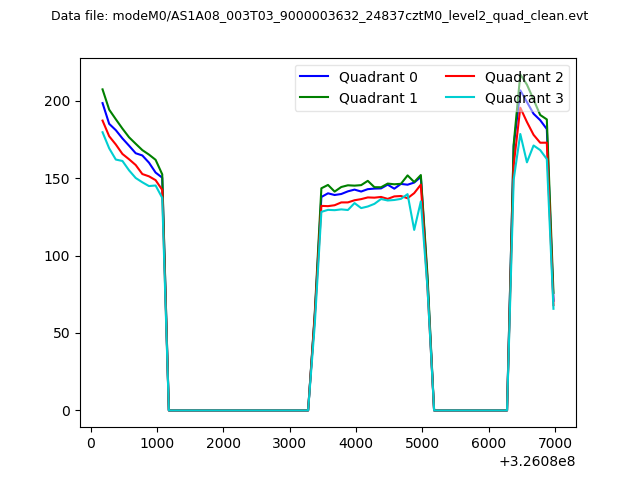 |
|
| Module-wise count rates for Quadrant A Data is divided into 100 sec bins |
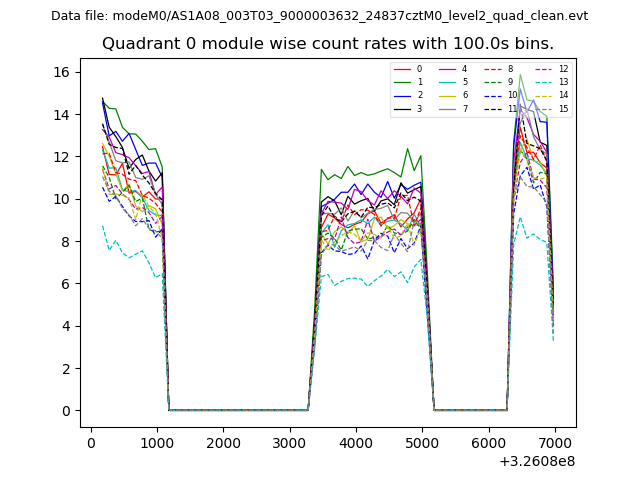 |
 |
| Module-wise count rates for Quadrant B Data is divided into 100 sec bins |
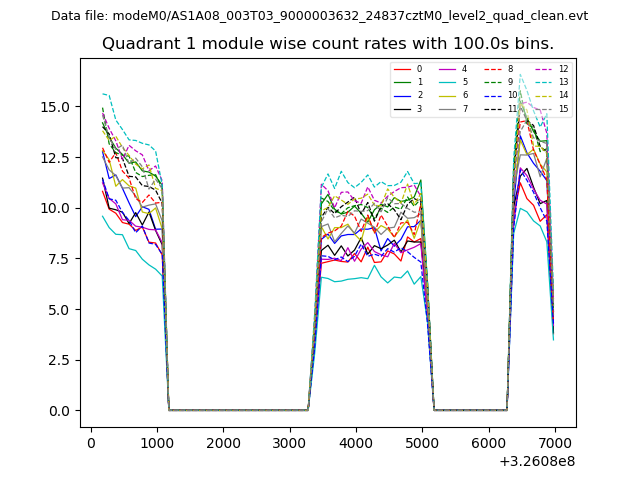 |
 |
| Module-wise count rates for Quadrant C Data is divided into 100 sec bins |
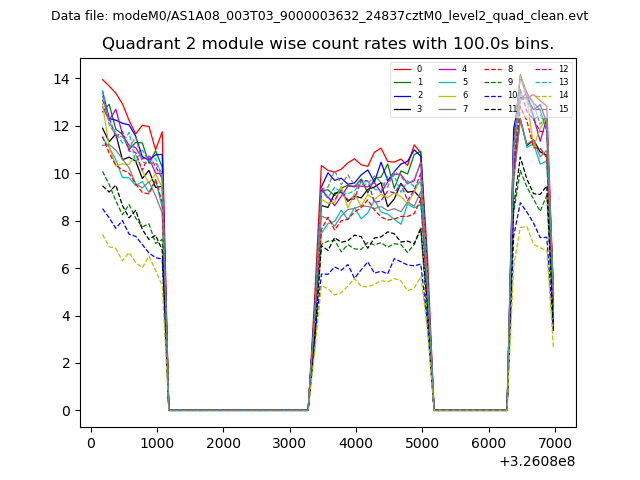 |
 |
| Module-wise count rates for Quadrant D Data is divided into 100 sec bins |
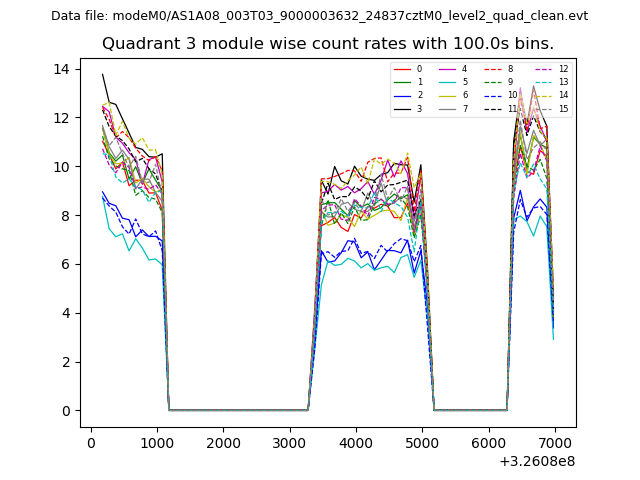 |
 |
| Parameter | Plot |
|---|---|
| CZT HV Monitor | 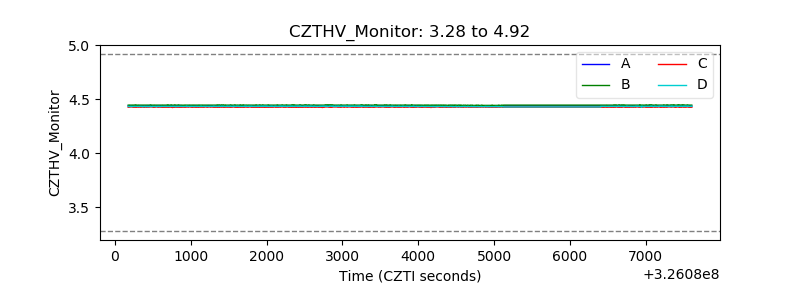 |
| D_VDD | 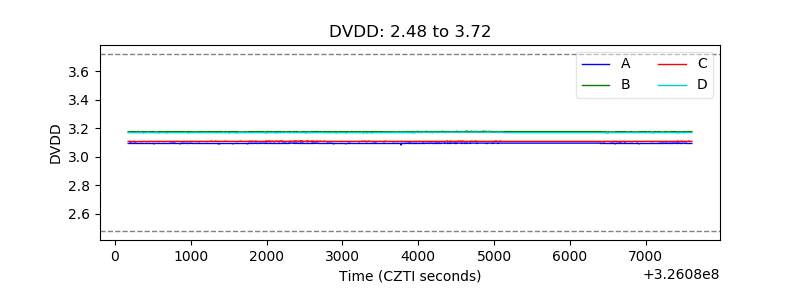 |
| Temperature 1 | 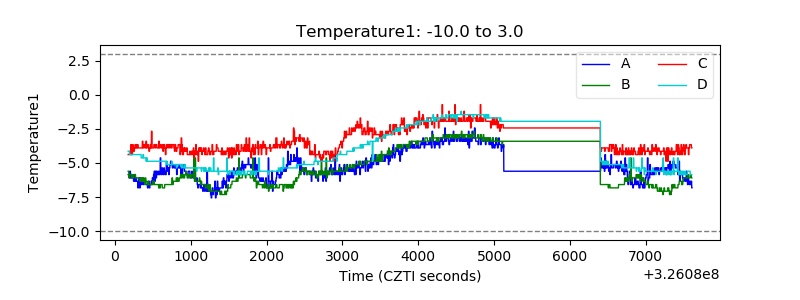 |
| Veto HV Monitor |  |
| Veto LLD | 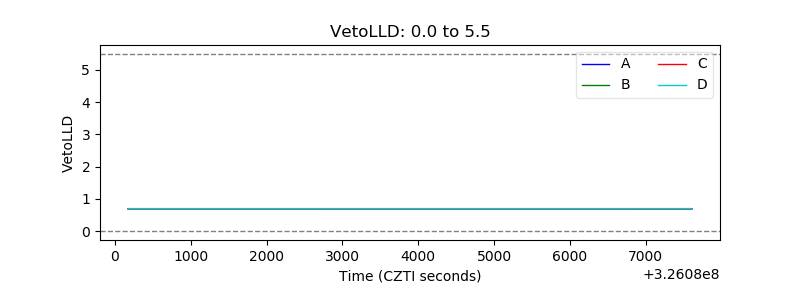 |
| Alpha Counter |  |
| _CPM_Rate | 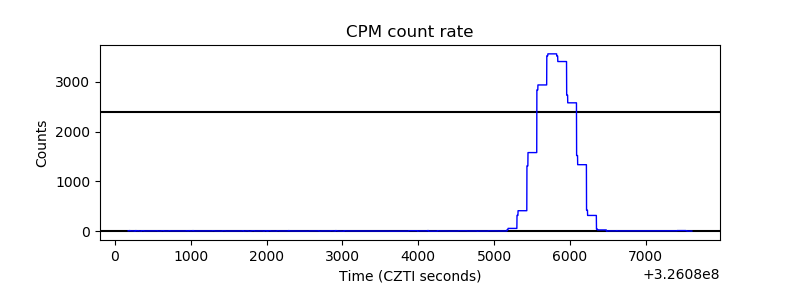 |
| CZT Counter | 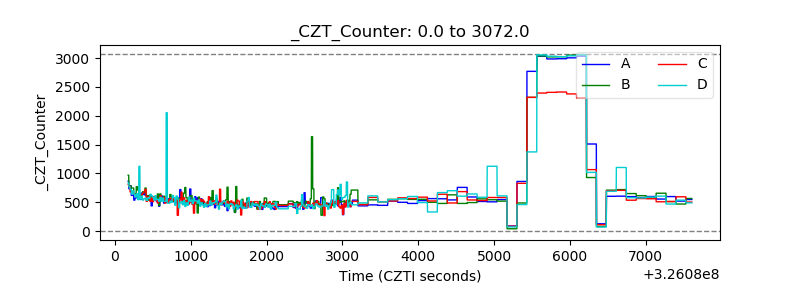 |
| +2.5 Volts monitor |  |
| +5 Volts monitor |  |
| _ROLL_ROT | 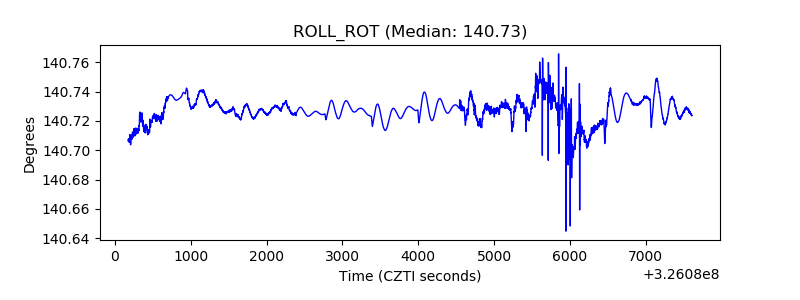 |
| _Roll_DEC | 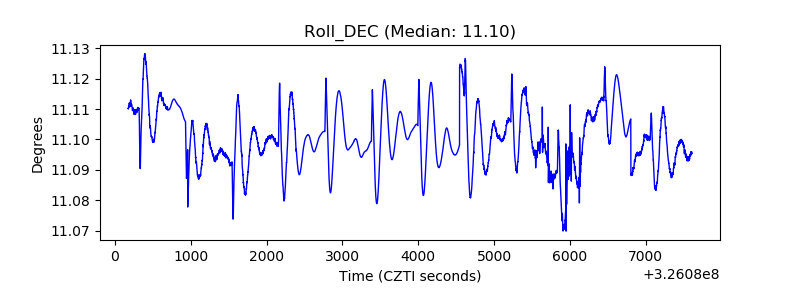 |
| _Roll_RA | 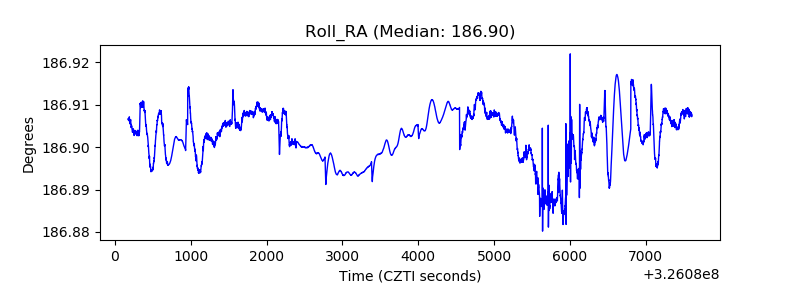 |
| Veto Counter | 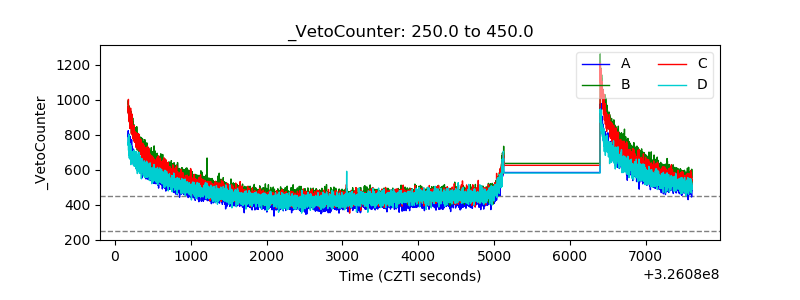 |