| Param | Original file | Final file |
|---|---|---|
| Filename | modeM0/AS1A08_003T03_9000003632_24838cztM0_level2.evt | modeM0/AS1A08_003T03_9000003632_24838cztM0_level2_quad_clean.evt |
| Size (bytes) | 493,646,400 | 74,036,160 |
| Size | 470.8 MB | 70.6 MB |
| Events in quadrant A | 3,375,954 | 469,113 |
| Events in quadrant B | 3,545,380 | 479,908 |
| Events in quadrant C | 3,423,636 | 441,616 |
| Events in quadrant D | 4,184,618 | 418,190 |
| Mode M0 | |||
|---|---|---|---|
| Quadrant | BADHDUFLAG | Total packets | Discarded packets |
| A | 0 | 13585 | 2 |
| B | 0 | 14218 | 2 |
| C | 0 | 13639 | 2 |
| D | 0 | 16298 | 2 |
| Mode M9 | |||
|---|---|---|---|
| Quadrant | BADHDUFLAG | Total packets | Discarded packets |
| A | 0 | 13 | 0 |
| B | 0 | 14 | 0 |
| C | 0 | 14 | 0 |
| D | 0 | 14 | 0 |
| Mode SS | |||
|---|---|---|---|
| Quadrant | BADHDUFLAG | Total packets | Discarded packets |
| A | 0 | 126 | 0 |
| B | 0 | 126 | 0 |
| C | 0 | 126 | 0 |
| D | 0 | 126 | 0 |
| Quadrant | Total seconds | Saturated seconds | Saturation percentage |
|---|---|---|---|
| A | 6202 | 29 | 0.467591% |
| B | 6201 | 62 | 0.999839% |
| C | 6201 | 77 | 1.241735% |
| D | 6201 | 182 | 2.935010% |
Noise dominated data is calculated using 1-second bins in cleaned event files. If a bin has >2000 counts, and if more than 50% of those come from <1% of pixels, then it is considered to be noise-dominated and hence unusable.
| Quadrant | # 1 sec bins | Bins with >0 counts | Bins with >2000 counts | High rate bins dominated by noise | Noise dominated (total time) | Noise dominated (detector-on time) | Marked lightcurve |
|---|---|---|---|---|---|---|---|
| A | 7542 | 6203 | 0 | 0 | 0.00% | 0.00% | 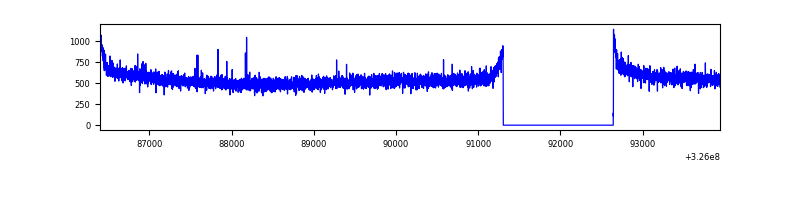 |
| B | 7541 | 6202 | 7 | 7 | 0.09% | 0.11% |  |
| C | 7541 | 6202 | 0 | 0 | 0.00% | 0.00% | 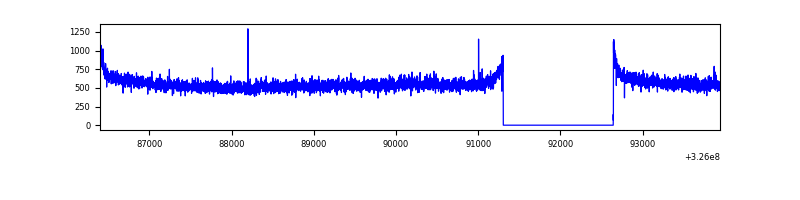 |
| D | 7541 | 6202 | 121 | 121 | 1.60% | 1.95% | 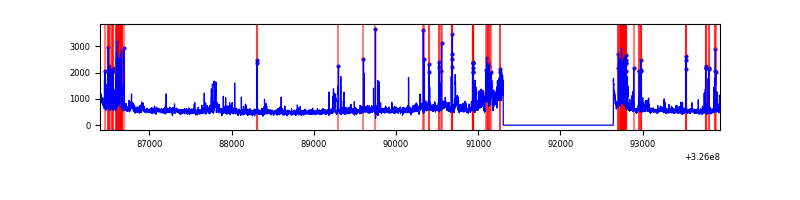 |
Top three noisy pixels from each quadrant. If the there are fewer than three noisy pixels in the level2.evt file, extra rows are filled as -1
| Pixel properties | Quadrant properties | ||||||
|---|---|---|---|---|---|---|---|
| Quadrant | DetID | PixID | Counts | Sigma | Mean | Median | Sigma |
| A | 13 | 254 | 8700 | 45.3 | 876 | 862 | 173.0 |
| A | 0 | 226 | 7615 | 39.03 | 876 | 862 | 173.0 |
| A | 3 | 137 | 7428 | 37.95 | 876 | 862 | 173.0 |
| B | 0 | 189 | 56703 | 342.26 | 874 | 858 | 163.2 |
| B | 10 | 251 | 32942 | 196.63 | 874 | 858 | 163.2 |
| B | 4 | 80 | 27717 | 164.61 | 874 | 858 | 163.2 |
| C | 14 | 238 | 134823 | 705.68 | 822 | 829 | 189.9 |
| C | 7 | 247 | 82154 | 428.3 | 822 | 829 | 189.9 |
| C | 13 | 61 | 5752 | 25.93 | 822 | 829 | 189.9 |
| D | 1 | 52 | 635303 | 3209.65 | 816 | 793 | 197.7 |
| D | 5 | 222 | 372061 | 1878.05 | 816 | 793 | 197.7 |
| D | 8 | 195 | 59405 | 296.48 | 816 | 793 | 197.7 |
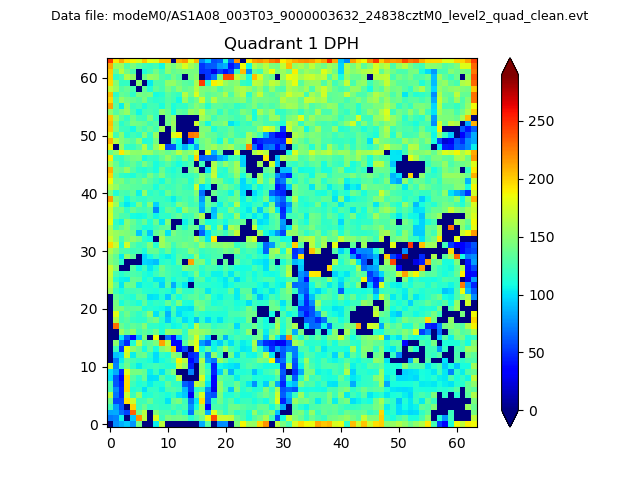
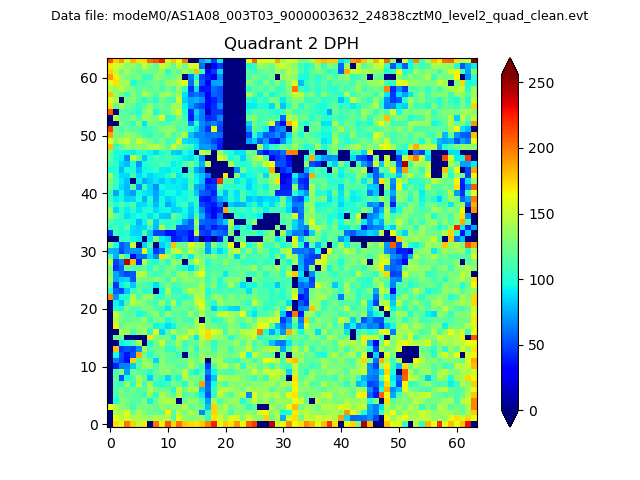
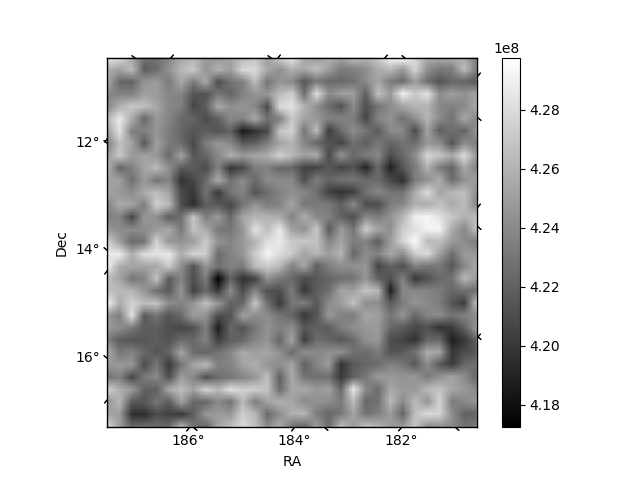
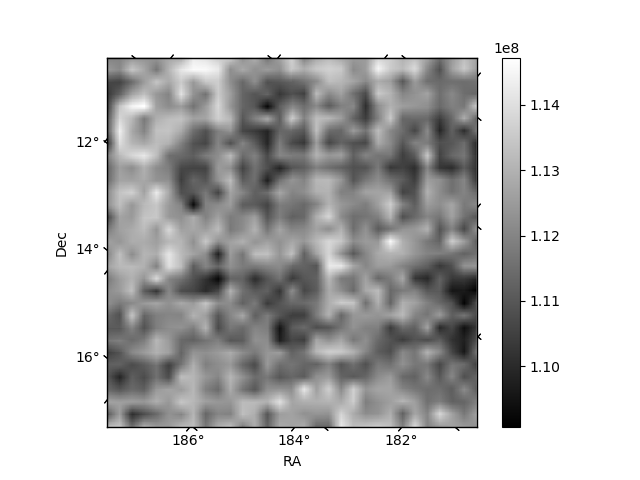
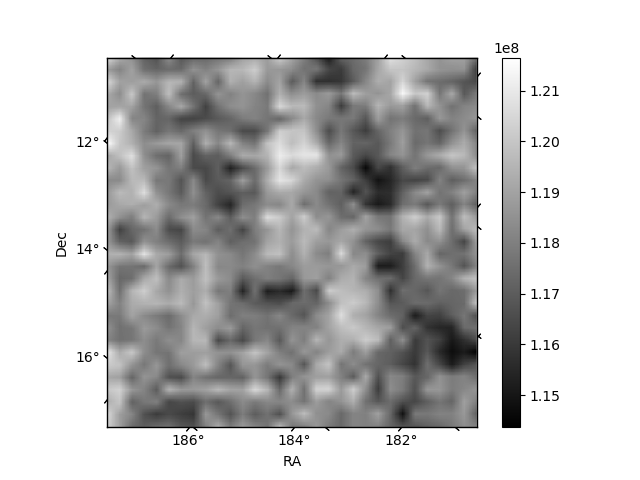
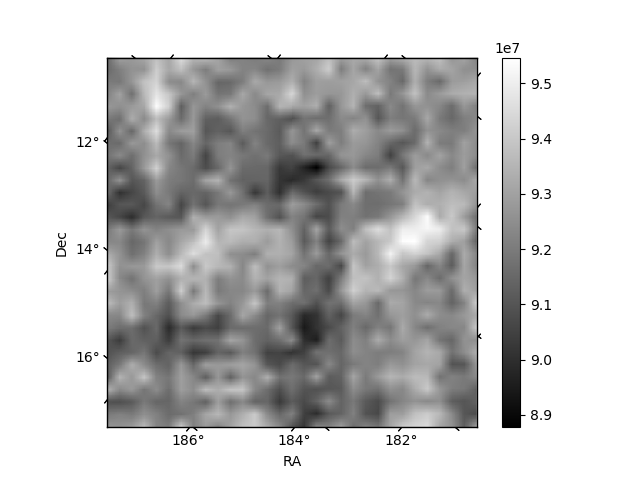
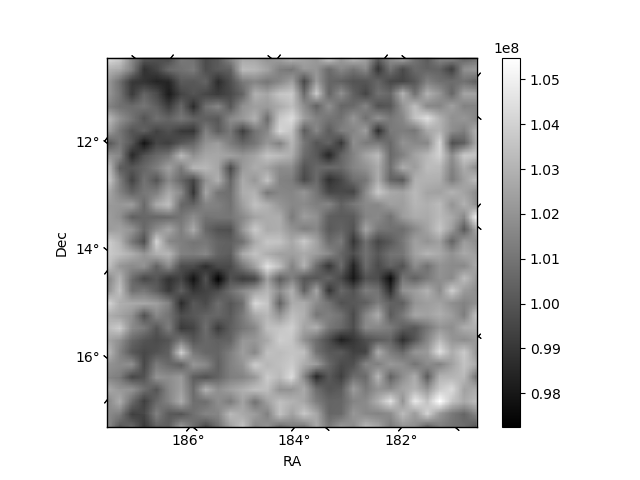
Histogram calculated using DETX and DETY for each event in the final _common_clean file
| Quadrant A | 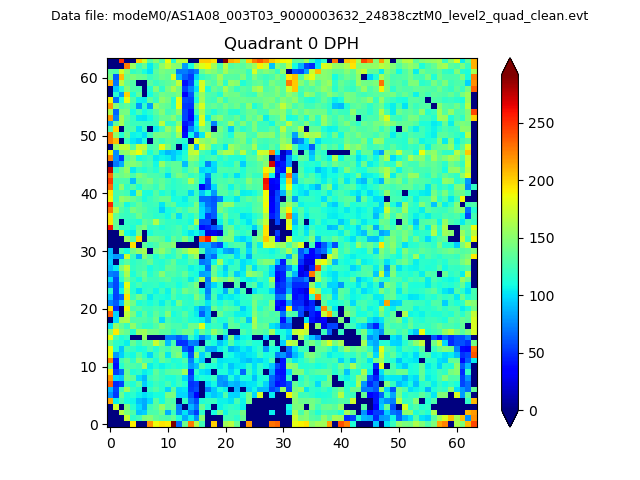 |
 |
Quadrant B |
|---|---|---|---|
| Quadrant D | 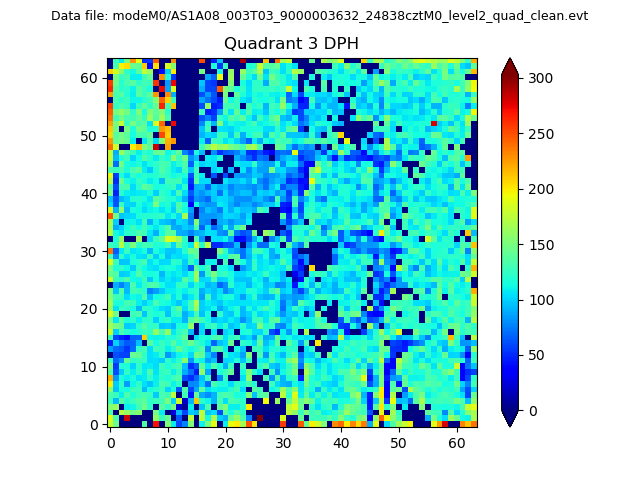 |
 |
Quadrant C |
| Plot type | Count rate plots | Images |
|---|---|---|
| Comparison with Poisson distribution Blue bars denote a histogram of data divided into 1 sec bins. Red curve is a Poisson curve with rate = median count rate of data. |
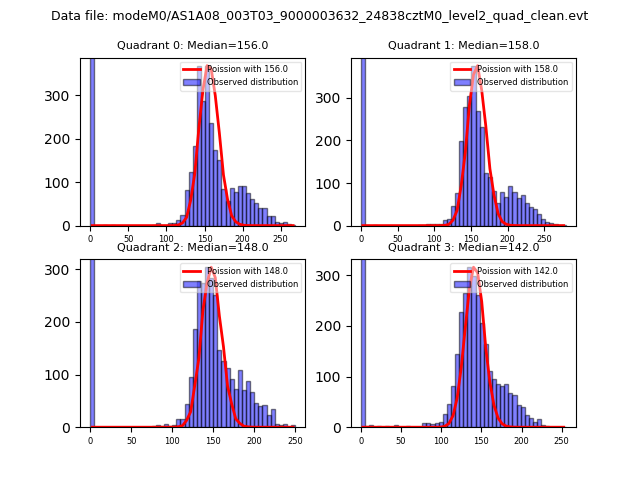 |
 |
| Quadrant-wise count rates Data is divided into 100 sec bins |
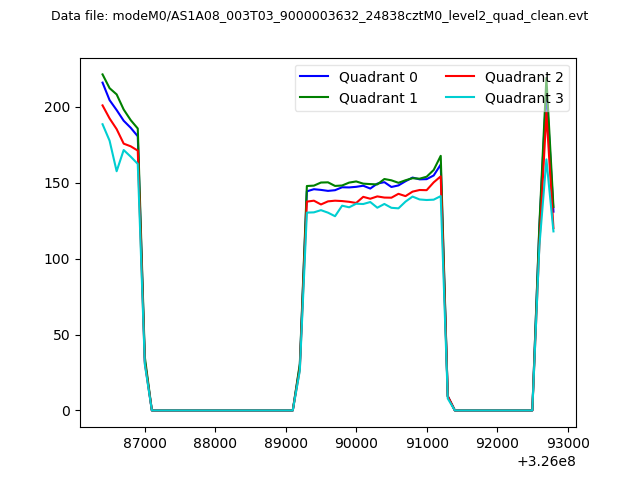 |
|
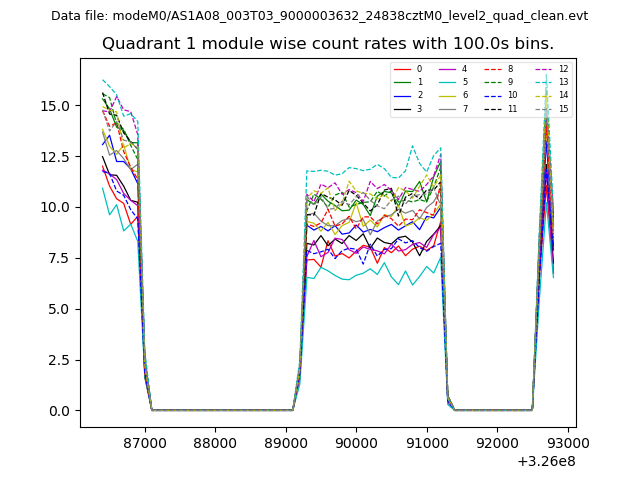
| Module-wise count rates for Quadrant A Data is divided into 100 sec bins |
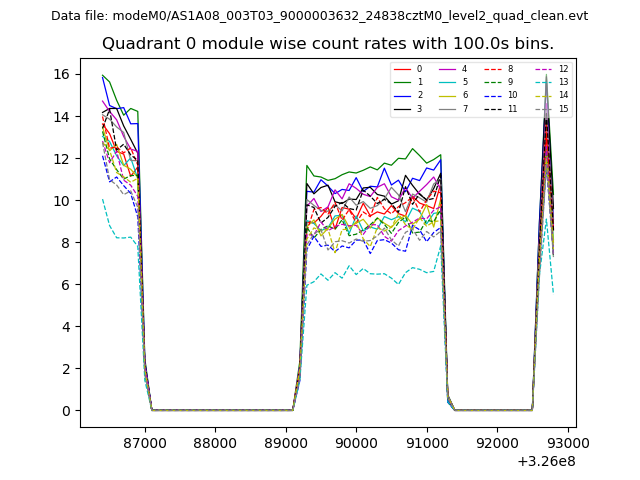 |
 |
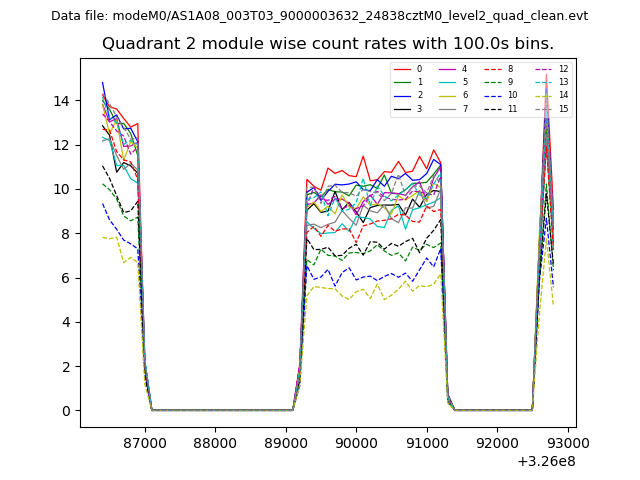
| Module-wise count rates for Quadrant B Data is divided into 100 sec bins |
 |
 |
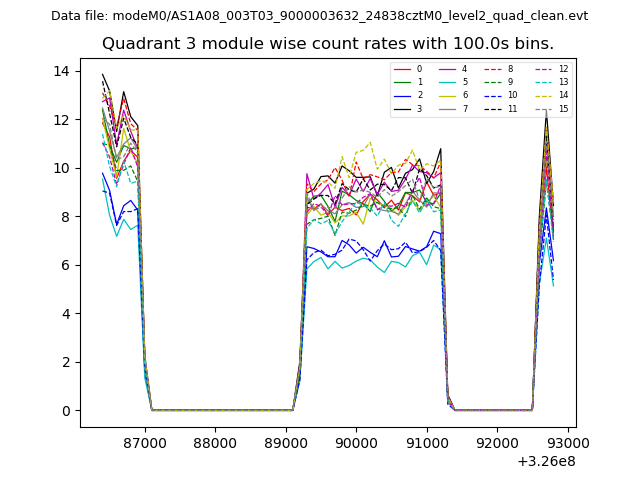
| Module-wise count rates for Quadrant C Data is divided into 100 sec bins |
 |
 |
| Module-wise count rates for Quadrant D Data is divided into 100 sec bins |
 |
 |
| Parameter | Plot |
|---|---|
| CZT HV Monitor | 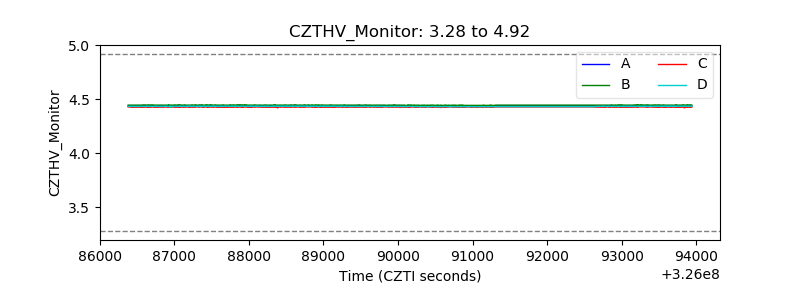 |
| D_VDD | 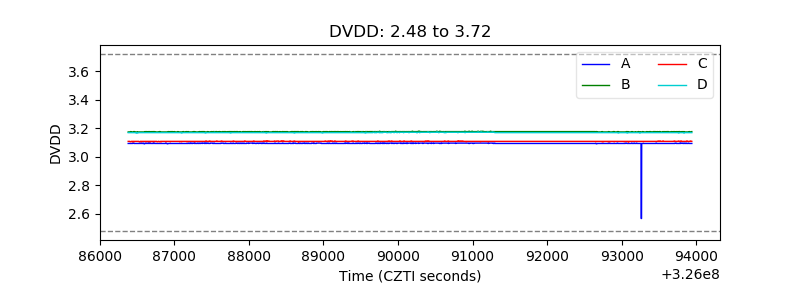 |
| Temperature 1 | 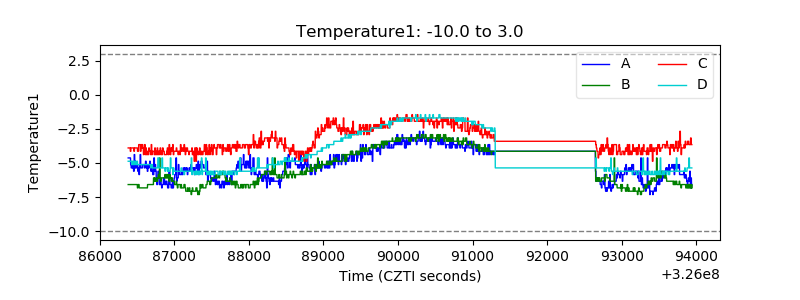 |
| Veto HV Monitor | 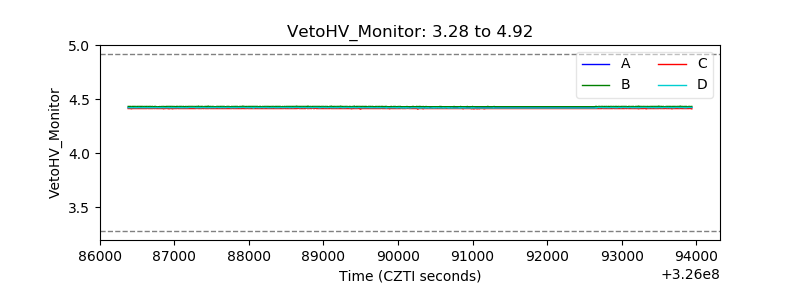 |
| Veto LLD | 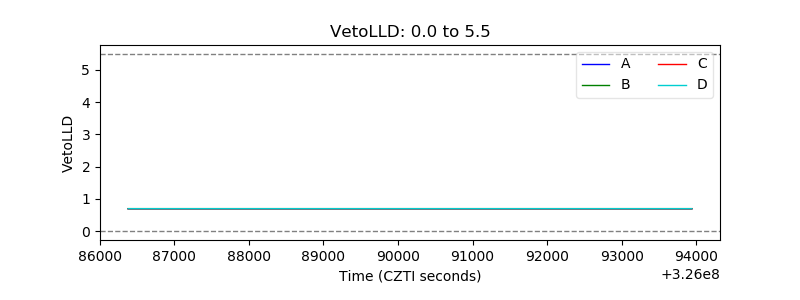 |
| Alpha Counter | 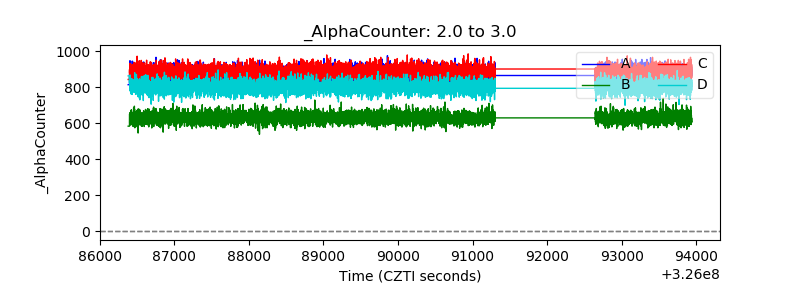 |
| _CPM_Rate | 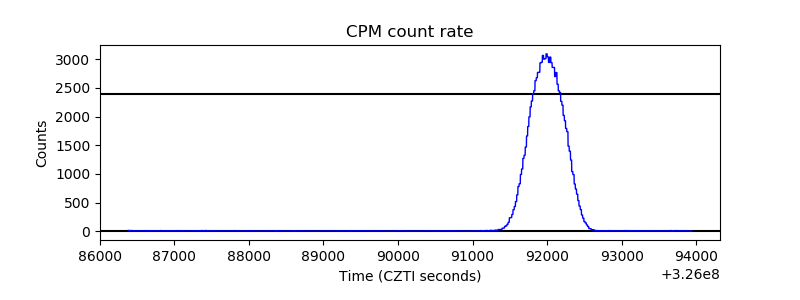 |
| CZT Counter | 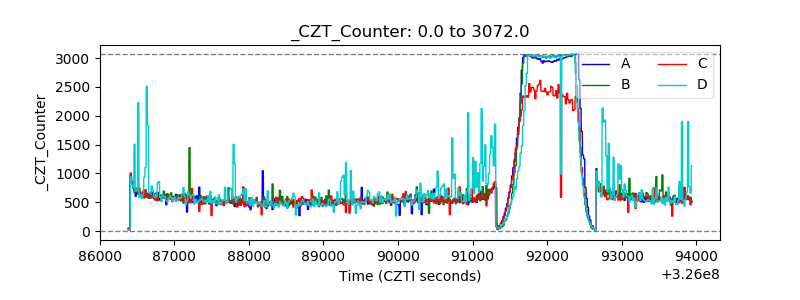 |
| +2.5 Volts monitor |  |
| +5 Volts monitor |  |
| _ROLL_ROT | 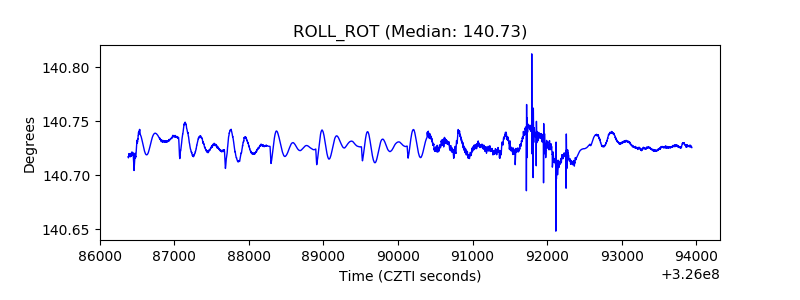 |
| _Roll_DEC | 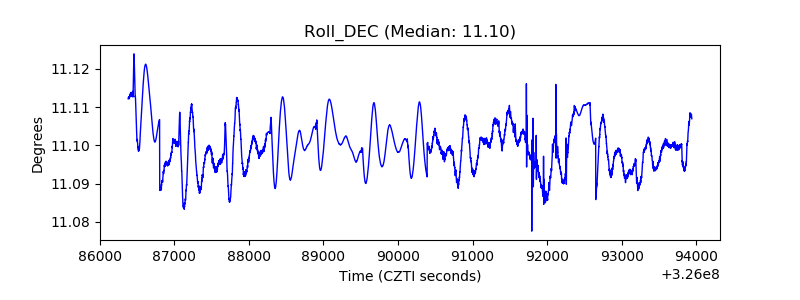 |
| _Roll_RA | 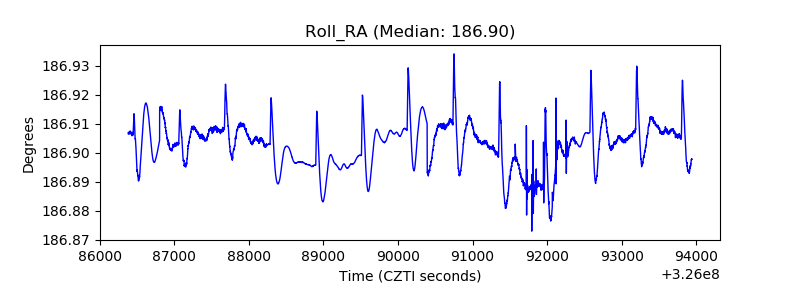 |
| Veto Counter | 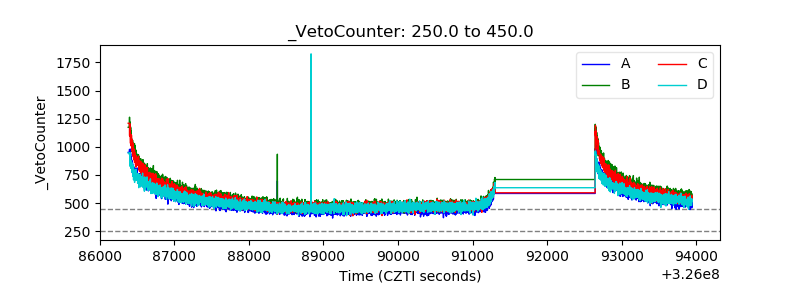 |