| Param | Original file | Final file |
|---|---|---|
| Filename | modeM0/AS1A08_003T03_9000003632_24839cztM0_level2.evt | modeM0/AS1A08_003T03_9000003632_24839cztM0_level2_quad_clean.evt |
| Size (bytes) | 514,820,160 | 68,123,520 |
| Size | 491.0 MB | 65.0 MB |
| Events in quadrant A | 3,565,668 | 415,925 |
| Events in quadrant B | 3,685,494 | 423,463 |
| Events in quadrant C | 3,586,289 | 390,071 |
| Events in quadrant D | 4,312,887 | 379,449 |
| Mode M0 | |||
|---|---|---|---|
| Quadrant | BADHDUFLAG | Total packets | Discarded packets |
| A | 0 | 14207 | 2 |
| B | 0 | 14681 | 2 |
| C | 0 | 14207 | 2 |
| D | 0 | 16774 | 2 |
| Mode M9 | |||
|---|---|---|---|
| Quadrant | BADHDUFLAG | Total packets | Discarded packets |
| A | 0 | 16 | 0 |
| B | 0 | 17 | 0 |
| C | 0 | 17 | 0 |
| D | 0 | 17 | 0 |
| Mode SS | |||
|---|---|---|---|
| Quadrant | BADHDUFLAG | Total packets | Discarded packets |
| A | 0 | 130 | 0 |
| B | 0 | 130 | 0 |
| C | 0 | 130 | 0 |
| D | 0 | 130 | 0 |
| Quadrant | Total seconds | Saturated seconds | Saturation percentage |
|---|---|---|---|
| A | 6513 | 64 | 0.982650% |
| B | 6512 | 103 | 1.581695% |
| C | 6512 | 98 | 1.504914% |
| D | 6512 | 240 | 3.685504% |
Noise dominated data is calculated using 1-second bins in cleaned event files. If a bin has >2000 counts, and if more than 50% of those come from <1% of pixels, then it is considered to be noise-dominated and hence unusable.
| Quadrant | # 1 sec bins | Bins with >0 counts | Bins with >2000 counts | High rate bins dominated by noise | Noise dominated (total time) | Noise dominated (detector-on time) | Marked lightcurve |
|---|---|---|---|---|---|---|---|
| A | 7833 | 6514 | 0 | 0 | 0.00% | 0.00% | 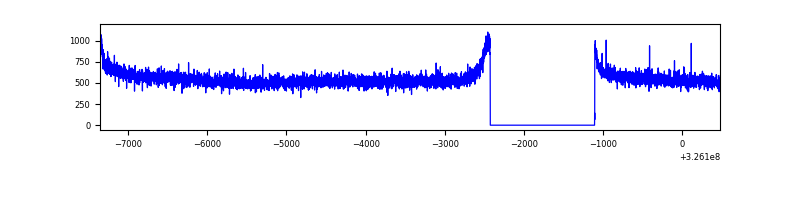 |
| B | 7832 | 6513 | 6 | 6 | 0.08% | 0.09% | 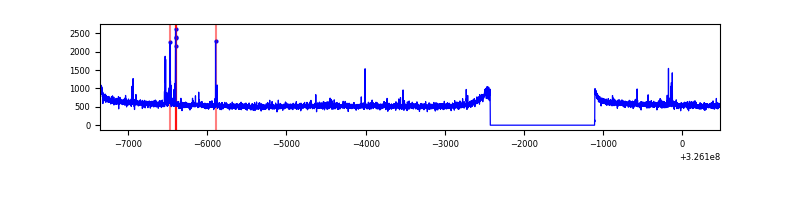 |
| C | 7832 | 6513 | 0 | 0 | 0.00% | 0.00% | 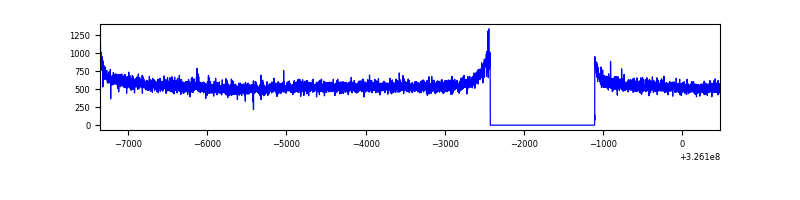 |
| D | 7832 | 6513 | 160 | 160 | 2.04% | 2.46% | 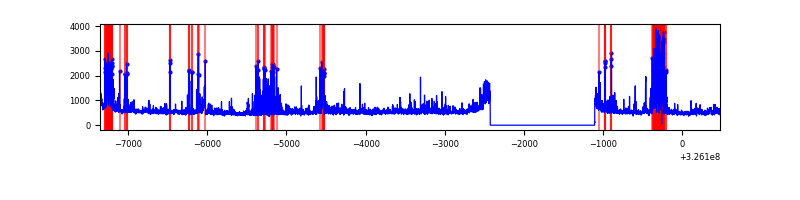 |
Top three noisy pixels from each quadrant. If the there are fewer than three noisy pixels in the level2.evt file, extra rows are filled as -1
| Pixel properties | Quadrant properties | ||||||
|---|---|---|---|---|---|---|---|
| Quadrant | DetID | PixID | Counts | Sigma | Mean | Median | Sigma |
| A | 13 | 254 | 9019 | 44.13 | 925 | 910 | 183.7 |
| A | 0 | 226 | 7973 | 38.44 | 925 | 910 | 183.7 |
| A | 3 | 137 | 7785 | 37.42 | 925 | 910 | 183.7 |
| B | 0 | 189 | 50240 | 285.3 | 919 | 899 | 172.9 |
| B | 7 | 202 | 20638 | 114.13 | 919 | 899 | 172.9 |
| B | 12 | 111 | 20443 | 113.01 | 919 | 899 | 172.9 |
| C | 14 | 238 | 141751 | 706.21 | 863 | 870 | 199.5 |
| C | 10 | 218 | 59222 | 292.51 | 863 | 870 | 199.5 |
| C | 7 | 247 | 16010 | 75.89 | 863 | 870 | 199.5 |
| D | 5 | 222 | 619937 | 2964.93 | 859 | 835 | 208.8 |
| D | 1 | 52 | 318839 | 1522.95 | 859 | 835 | 208.8 |
| D | 8 | 195 | 92771 | 440.29 | 859 | 835 | 208.8 |
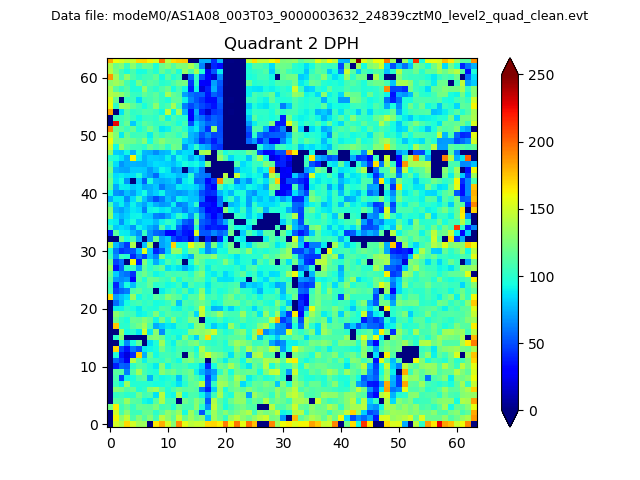
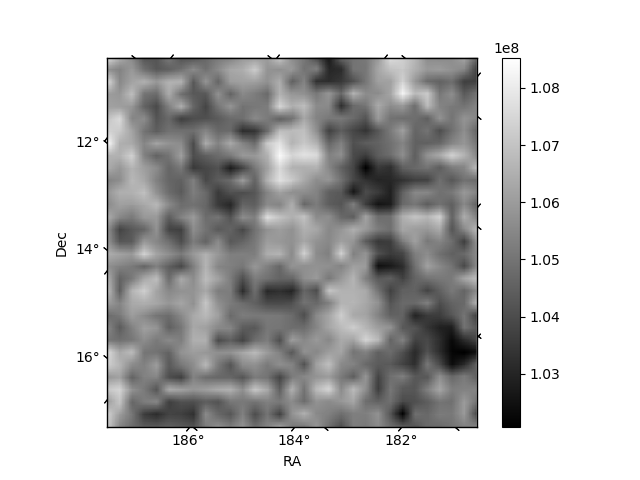
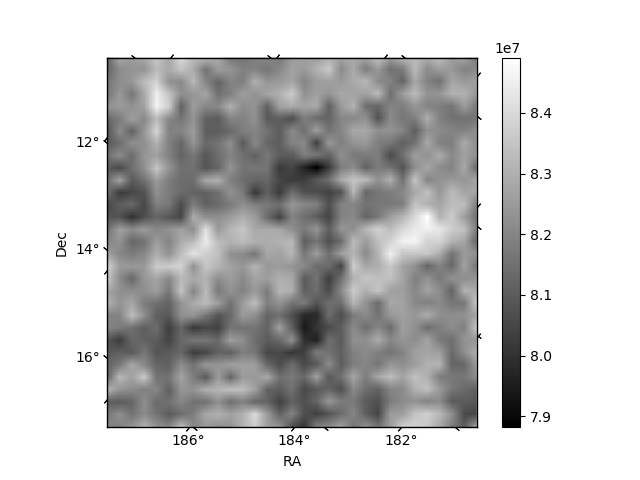
Histogram calculated using DETX and DETY for each event in the final _common_clean file
| Quadrant A | 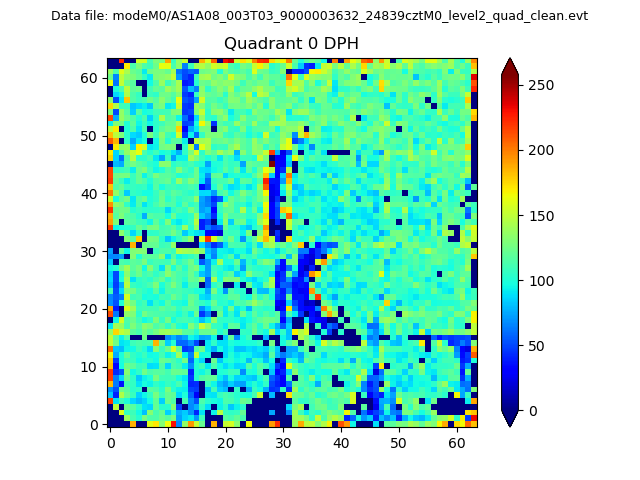 |
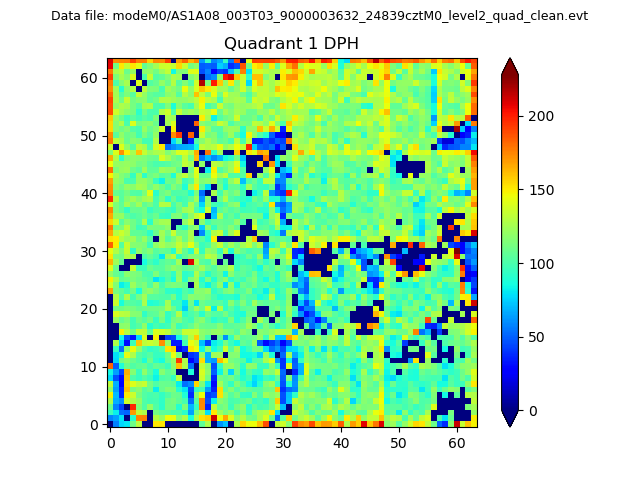 |
Quadrant B |
|---|---|---|---|
| Quadrant D | 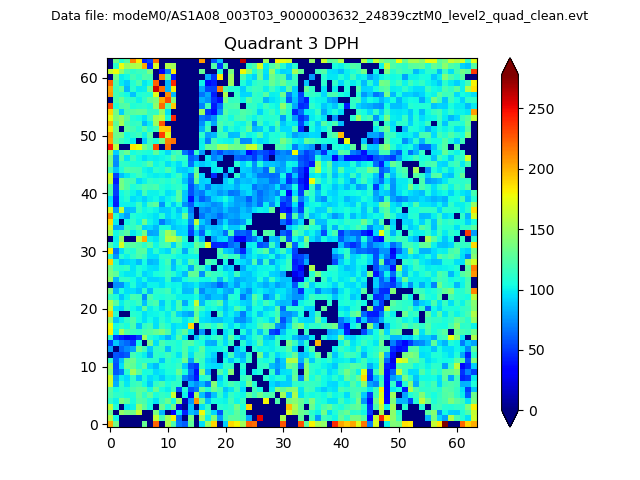 |
 |
Quadrant C |
| Plot type | Count rate plots | Images |
|---|---|---|
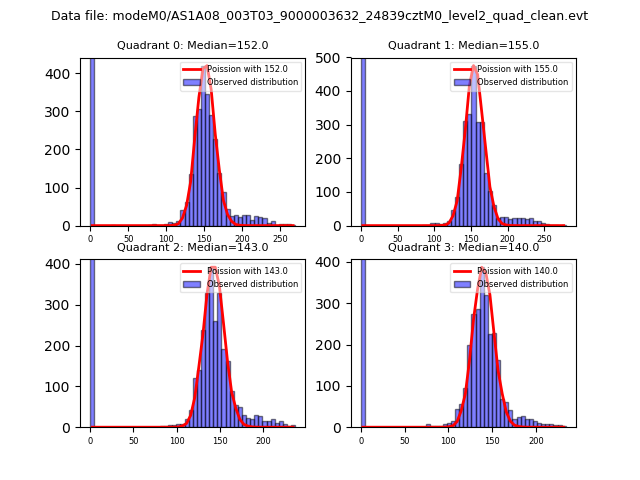
| Comparison with Poisson distribution Blue bars denote a histogram of data divided into 1 sec bins. Red curve is a Poisson curve with rate = median count rate of data. |
 |
 |
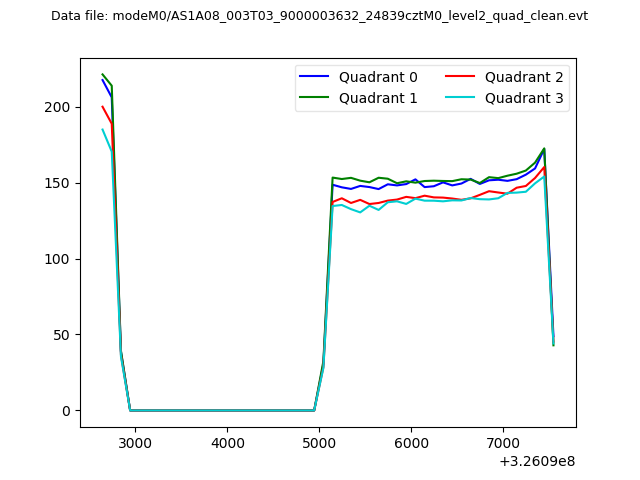
| Quadrant-wise count rates Data is divided into 100 sec bins |
 |
|
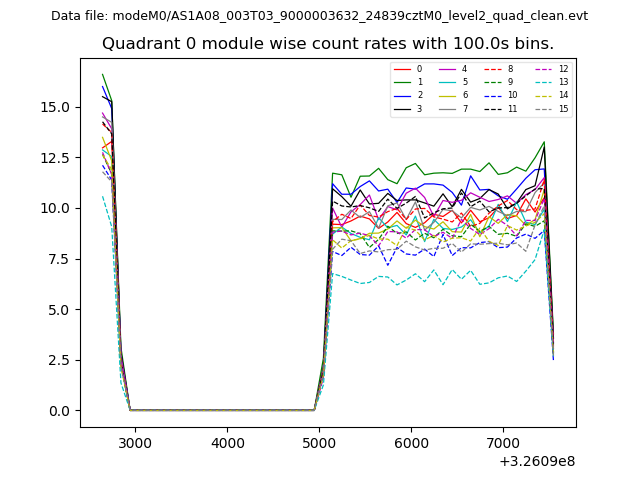
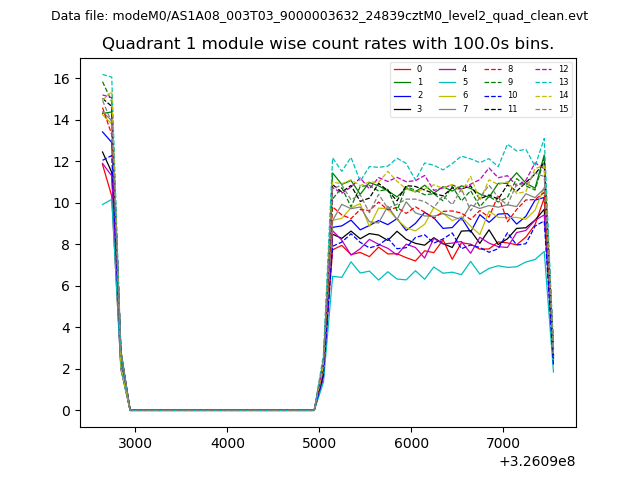
| Module-wise count rates for Quadrant A Data is divided into 100 sec bins |
 |
 |
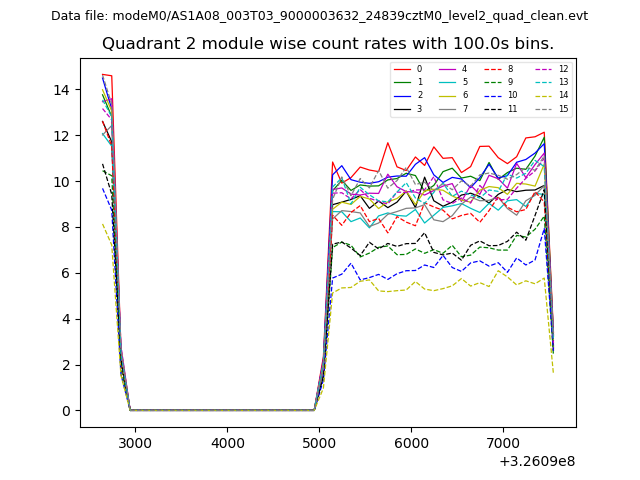
| Module-wise count rates for Quadrant B Data is divided into 100 sec bins |
 |
 |
| Module-wise count rates for Quadrant C Data is divided into 100 sec bins |
 |
 |
| Module-wise count rates for Quadrant D Data is divided into 100 sec bins |
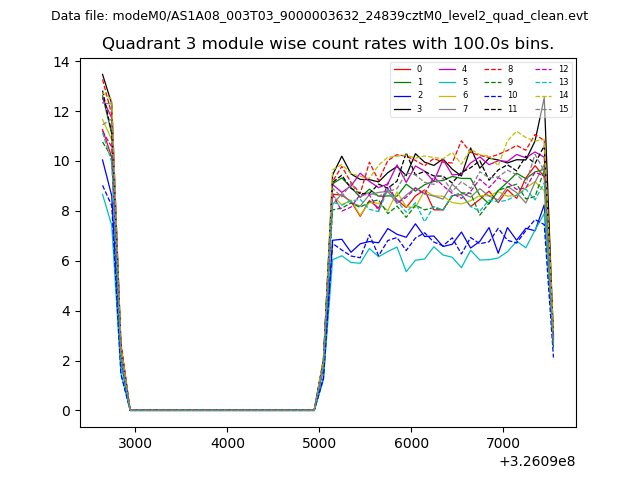 |
 |
| Parameter | Plot |
|---|---|
| CZT HV Monitor | 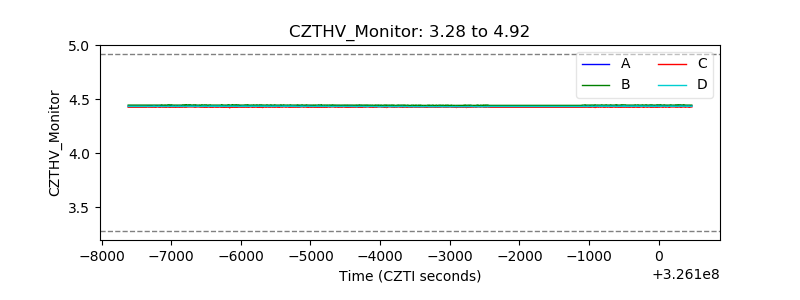 |
| D_VDD | 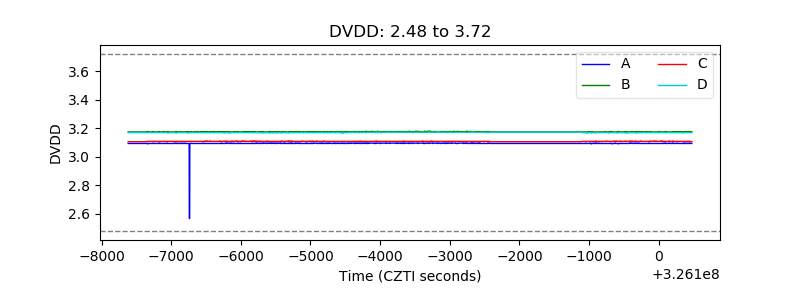 |
| Temperature 1 | 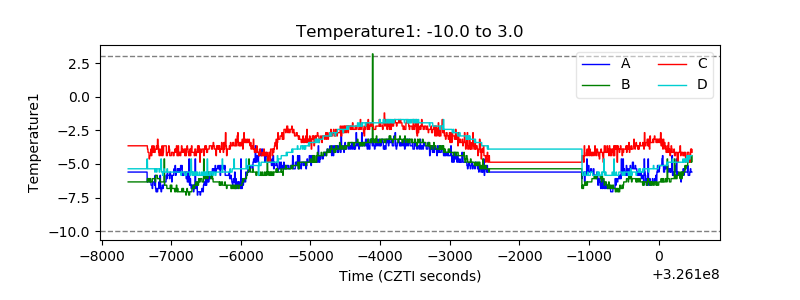 |
| Veto HV Monitor |  |
| Veto LLD | 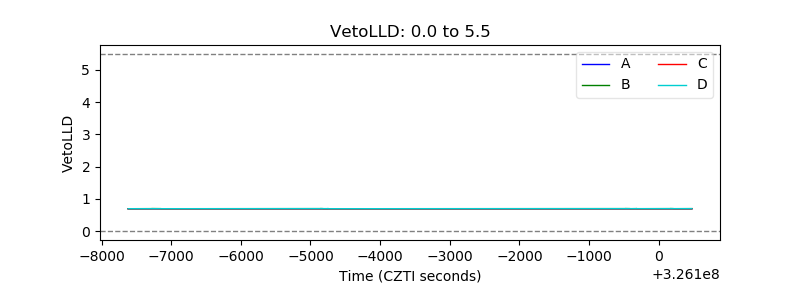 |
| Alpha Counter | 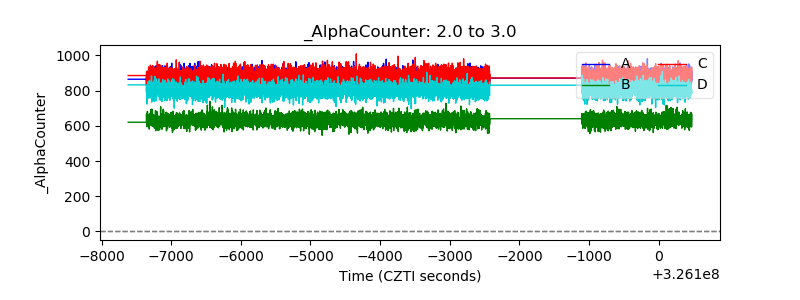 |
| _CPM_Rate | 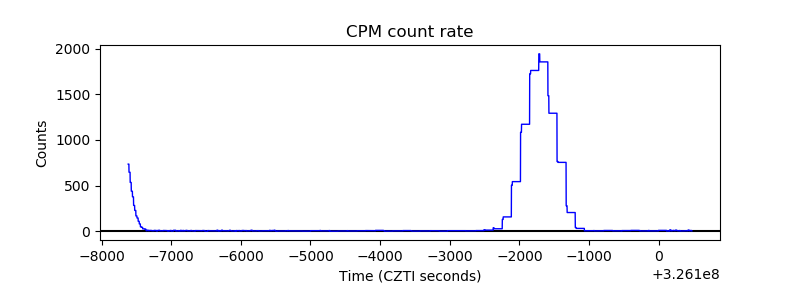 |
| CZT Counter | 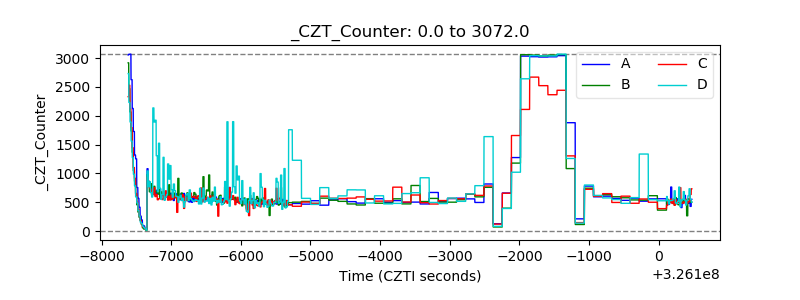 |
| +2.5 Volts monitor |  |
| +5 Volts monitor |  |
| _ROLL_ROT | 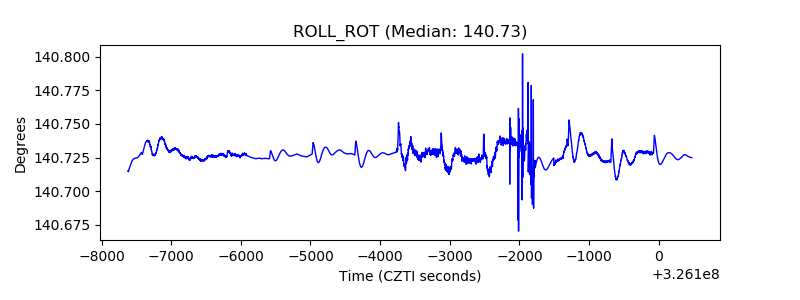 |
| _Roll_DEC | 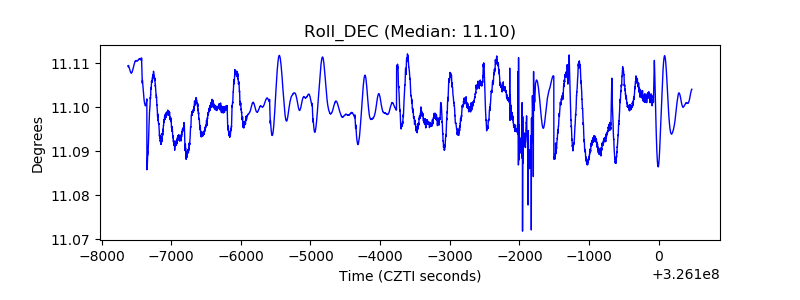 |
| _Roll_RA | 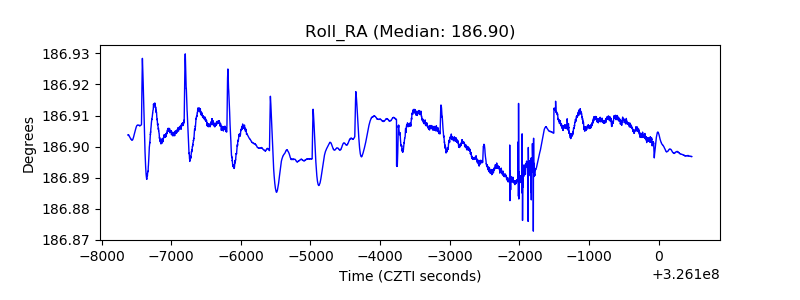 |
| Veto Counter | 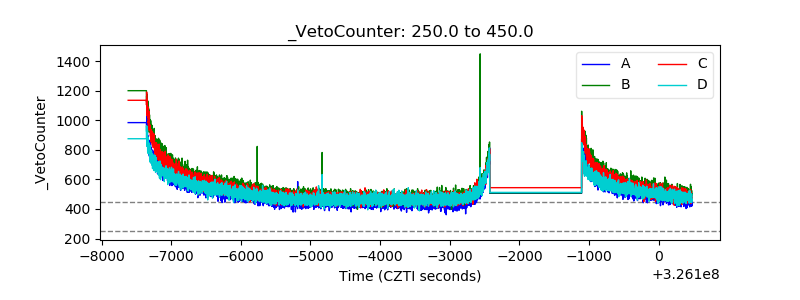 |