| Param | Original file | Final file |
|---|---|---|
| Filename | modeM0/AS1A08_003T03_9000003632_24840cztM0_level2.evt | modeM0/AS1A08_003T03_9000003632_24840cztM0_level2_quad_clean.evt |
| Size (bytes) | 485,976,960 | 70,292,160 |
| Size | 463.5 MB | 67.0 MB |
| Events in quadrant A | 3,496,662 | 431,827 |
| Events in quadrant B | 3,479,261 | 438,557 |
| Events in quadrant C | 3,390,309 | 407,013 |
| Events in quadrant D | 3,913,176 | 400,190 |
| Mode M0 | |||
|---|---|---|---|
| Quadrant | BADHDUFLAG | Total packets | Discarded packets |
| A | 0 | 13989 | 3 |
| B | 0 | 13953 | 2 |
| C | 0 | 13628 | 2 |
| D | 0 | 15554 | 2 |
| Mode M9 | |||
|---|---|---|---|
| Quadrant | BADHDUFLAG | Total packets | Discarded packets |
| A | 0 | 12 | 0 |
| B | 0 | 13 | 0 |
| C | 0 | 13 | 0 |
| D | 0 | 13 | 0 |
| Mode SS | |||
|---|---|---|---|
| Quadrant | BADHDUFLAG | Total packets | Discarded packets |
| A | 0 | 132 | 0 |
| B | 0 | 132 | 0 |
| C | 0 | 132 | 0 |
| D | 0 | 132 | 0 |
| Quadrant | Total seconds | Saturated seconds | Saturation percentage |
|---|---|---|---|
| A | 6458 | 41 | 0.634871% |
| B | 6458 | 65 | 1.006504% |
| C | 6458 | 73 | 1.130381% |
| D | 6458 | 143 | 2.214308% |
Noise dominated data is calculated using 1-second bins in cleaned event files. If a bin has >2000 counts, and if more than 50% of those come from <1% of pixels, then it is considered to be noise-dominated and hence unusable.
| Quadrant | # 1 sec bins | Bins with >0 counts | Bins with >2000 counts | High rate bins dominated by noise | Noise dominated (total time) | Noise dominated (detector-on time) | Marked lightcurve |
|---|---|---|---|---|---|---|---|
| A | 7698 | 6459 | 1 | 1 | 0.01% | 0.02% | 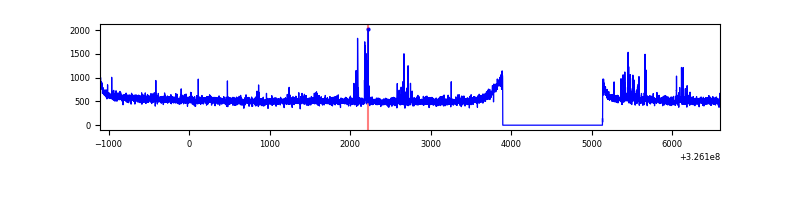 |
| B | 7698 | 6459 | 2 | 2 | 0.03% | 0.03% | 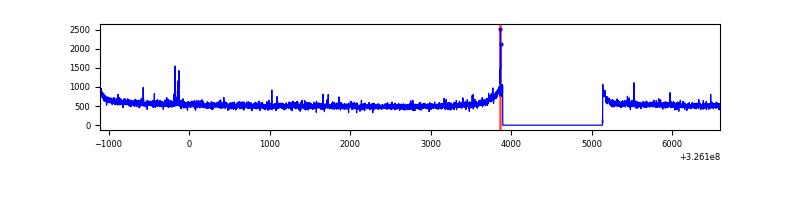 |
| C | 7698 | 6459 | 0 | 0 | 0.00% | 0.00% | 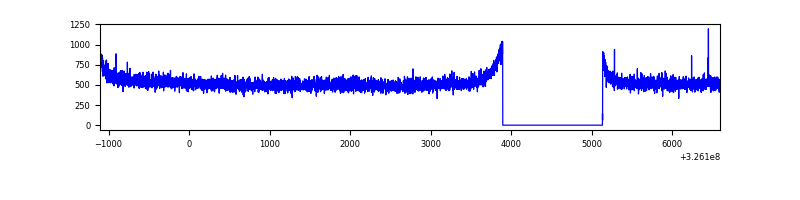 |
| D | 7698 | 6459 | 97 | 97 | 1.26% | 1.50% | 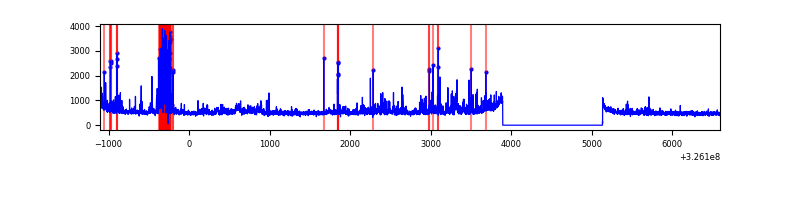 |
Top three noisy pixels from each quadrant. If the there are fewer than three noisy pixels in the level2.evt file, extra rows are filled as -1
| Pixel properties | Quadrant properties | ||||||
|---|---|---|---|---|---|---|---|
| Quadrant | DetID | PixID | Counts | Sigma | Mean | Median | Sigma |
| A | 6 | 16 | 77142 | 431.34 | 887 | 874 | 176.8 |
| A | 13 | 254 | 9448 | 48.49 | 887 | 874 | 176.8 |
| A | 3 | 137 | 7854 | 39.48 | 887 | 874 | 176.8 |
| B | 12 | 111 | 19863 | 113.04 | 879 | 861 | 168.1 |
| B | 11 | 111 | 18536 | 105.14 | 879 | 861 | 168.1 |
| B | 14 | 111 | 17289 | 97.73 | 879 | 861 | 168.1 |
| C | 14 | 238 | 134396 | 696.69 | 830 | 836 | 191.7 |
| C | 7 | 247 | 12351 | 60.07 | 830 | 836 | 191.7 |
| C | 13 | 61 | 5845 | 26.13 | 830 | 836 | 191.7 |
| D | 5 | 222 | 473707 | 2365.82 | 832 | 809 | 199.9 |
| D | 1 | 52 | 204767 | 1020.36 | 832 | 809 | 199.9 |
| D | 8 | 195 | 75706 | 374.7 | 832 | 809 | 199.9 |
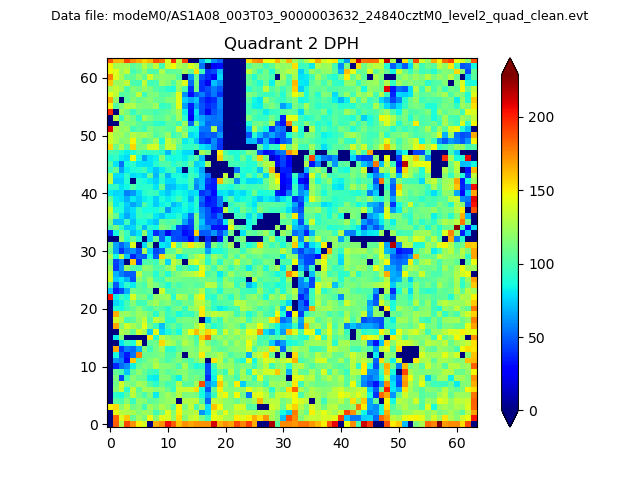
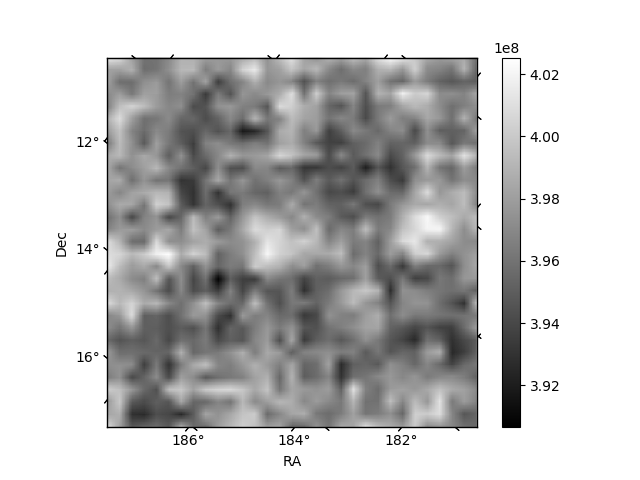
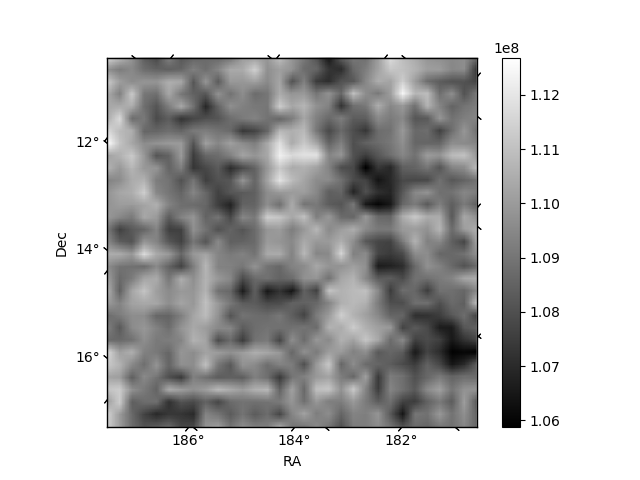
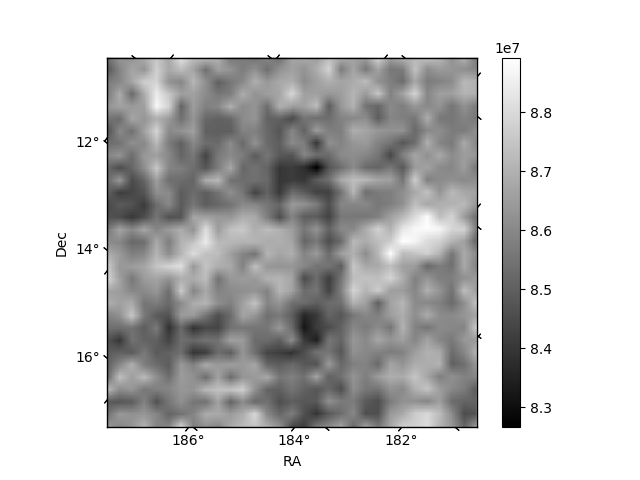
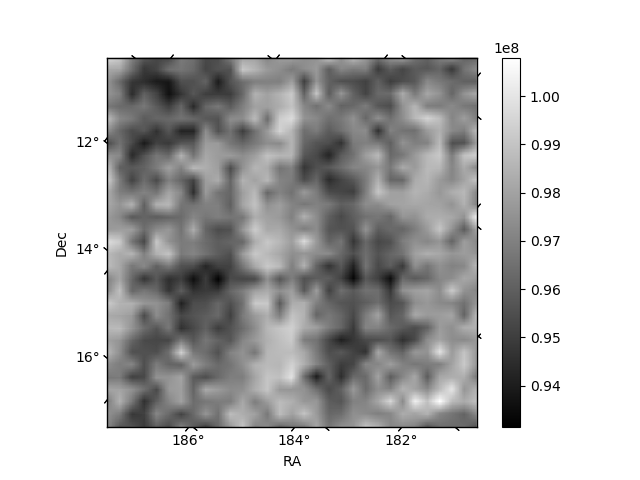
Histogram calculated using DETX and DETY for each event in the final _common_clean file
| Quadrant A | 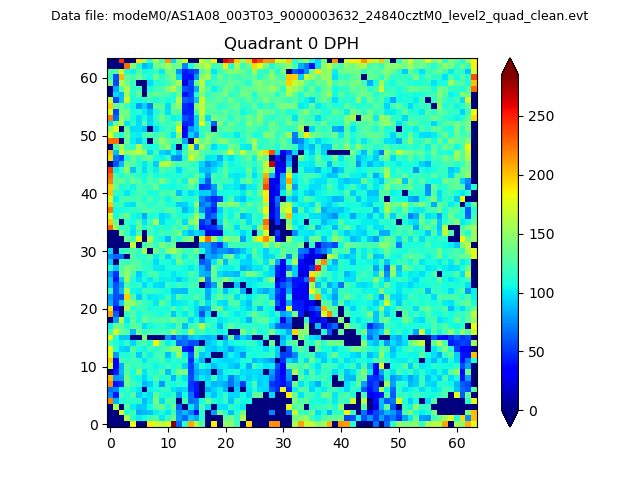 |
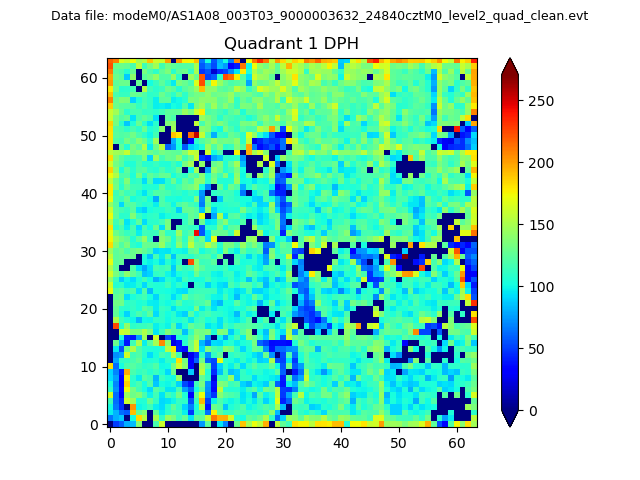 |
Quadrant B |
|---|---|---|---|
| Quadrant D | 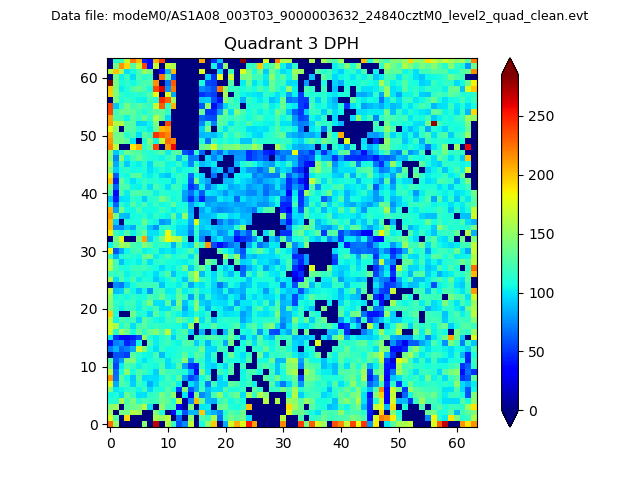 |
 |
Quadrant C |
| Plot type | Count rate plots | Images |
|---|---|---|
| Comparison with Poisson distribution Blue bars denote a histogram of data divided into 1 sec bins. Red curve is a Poisson curve with rate = median count rate of data. |
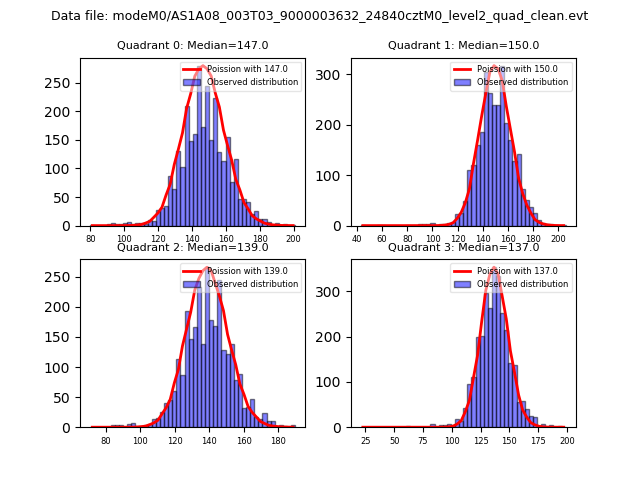 |
 |
| Quadrant-wise count rates Data is divided into 100 sec bins |
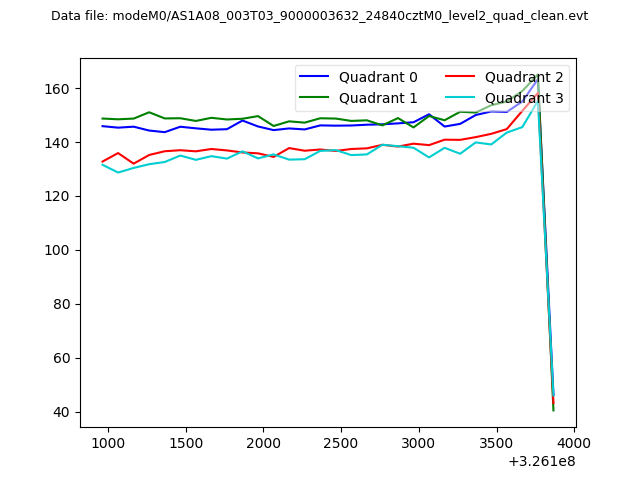 |
|
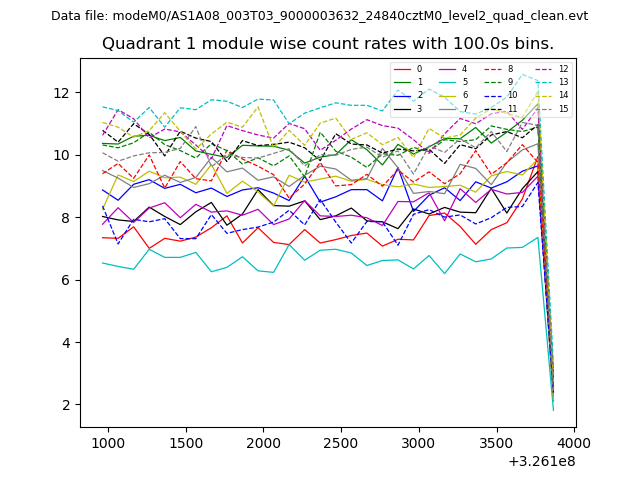
| Module-wise count rates for Quadrant A Data is divided into 100 sec bins |
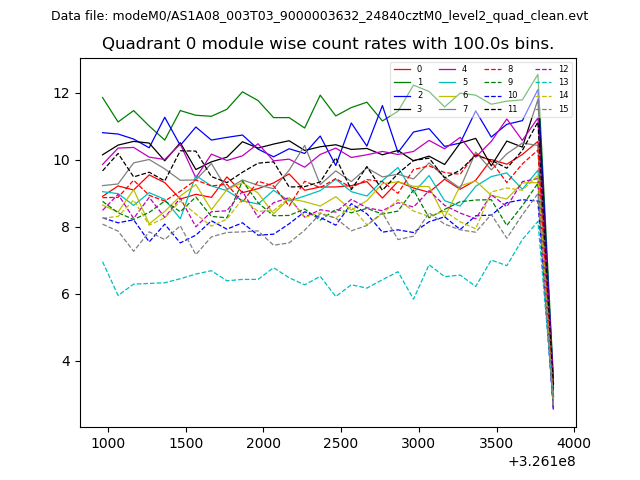 |
 |
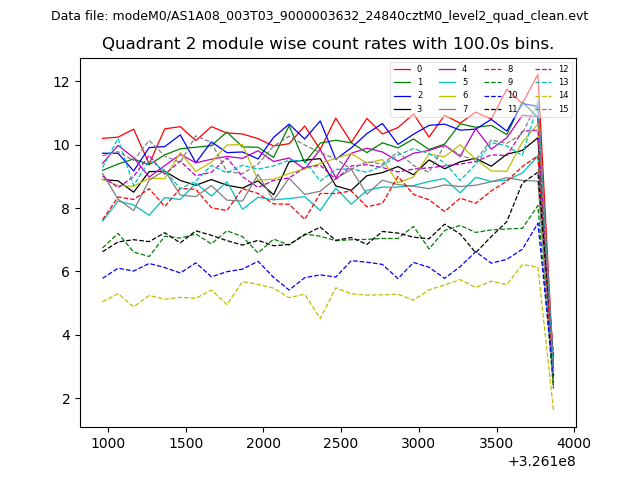
| Module-wise count rates for Quadrant B Data is divided into 100 sec bins |
 |
 |
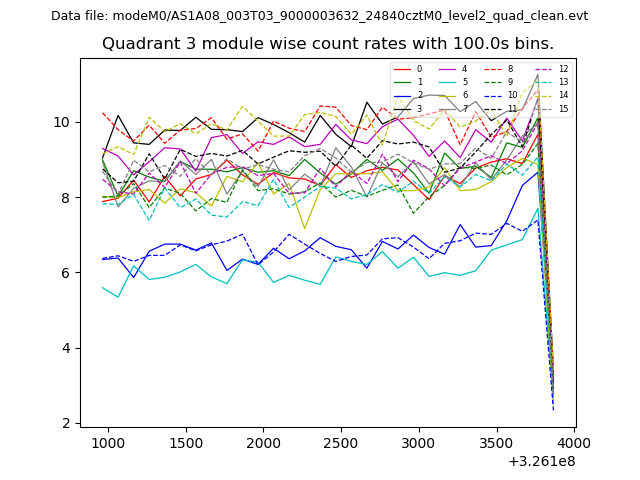
| Module-wise count rates for Quadrant C Data is divided into 100 sec bins |
 |
 |
| Module-wise count rates for Quadrant D Data is divided into 100 sec bins |
 |
 |
| Parameter | Plot |
|---|---|
| CZT HV Monitor |  |
| D_VDD | 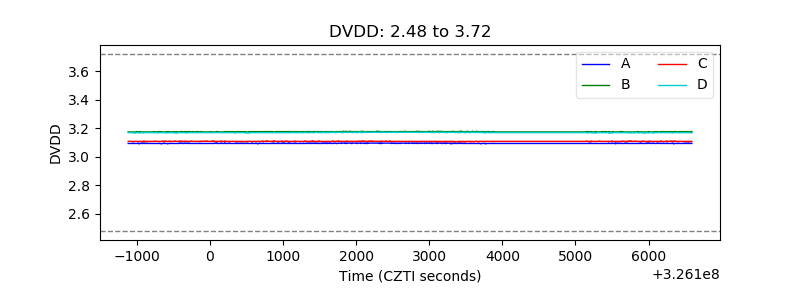 |
| Temperature 1 | 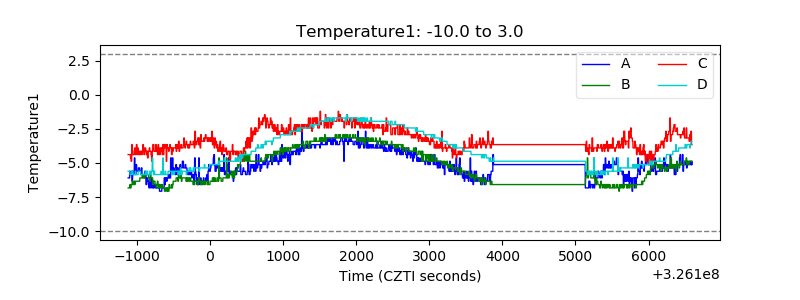 |
| Veto HV Monitor | 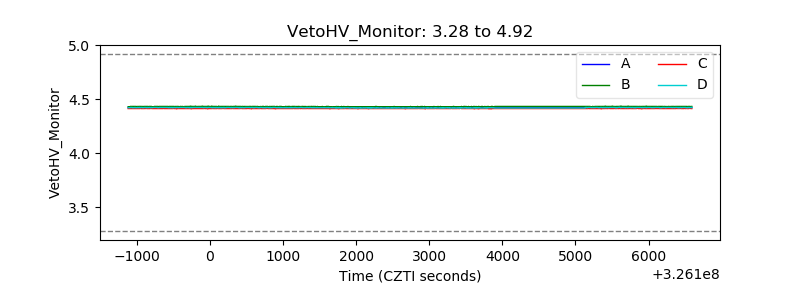 |
| Veto LLD | 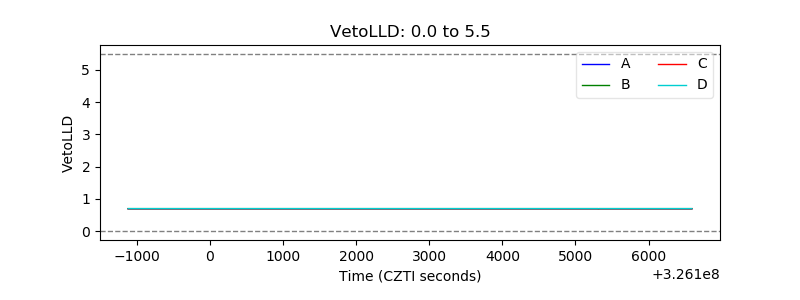 |
| Alpha Counter | 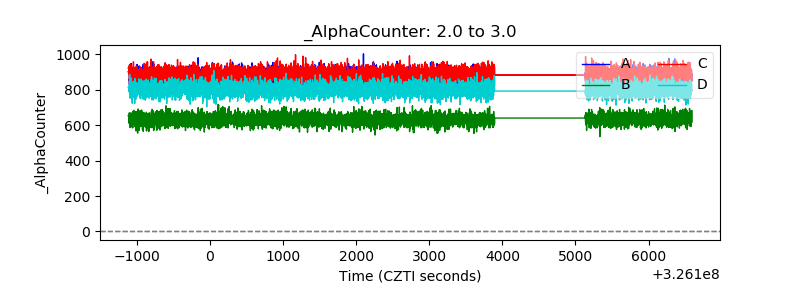 |
| _CPM_Rate | 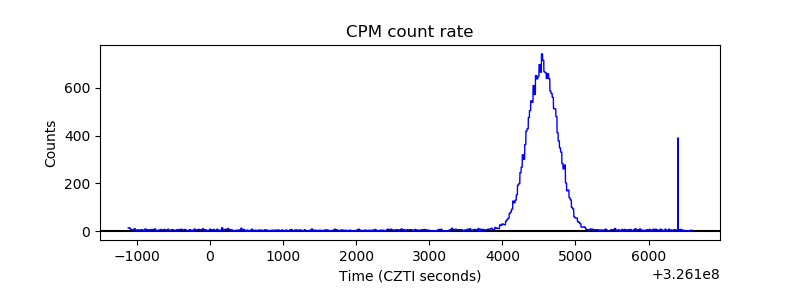 |
| CZT Counter | 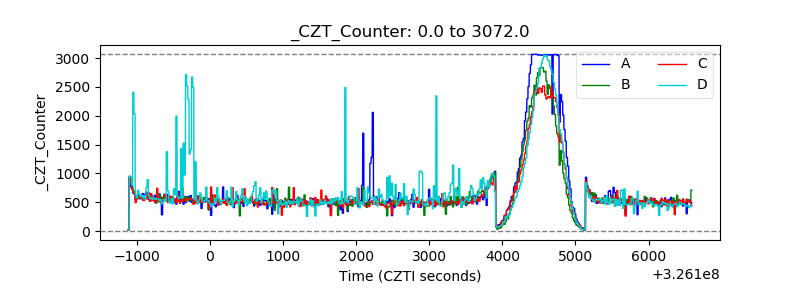 |
| +2.5 Volts monitor |  |
| +5 Volts monitor |  |
| _ROLL_ROT | 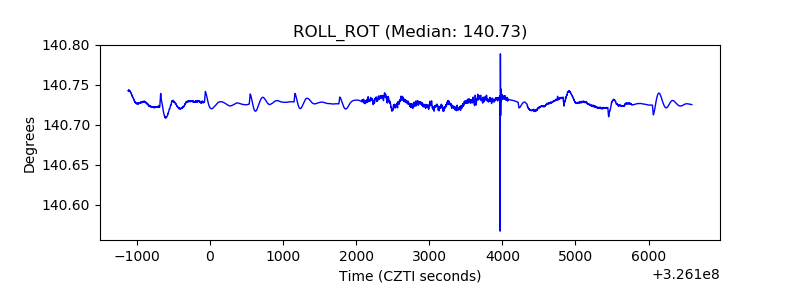 |
| _Roll_DEC | 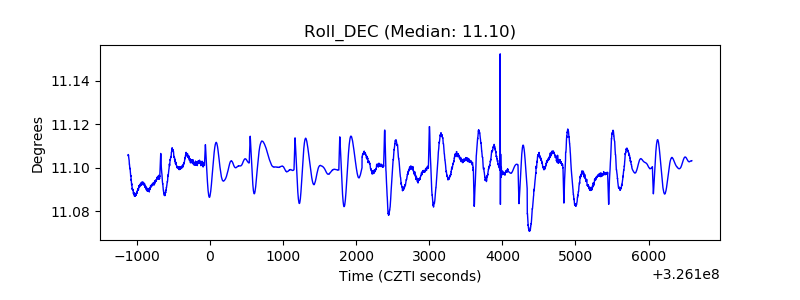 |
| _Roll_RA | 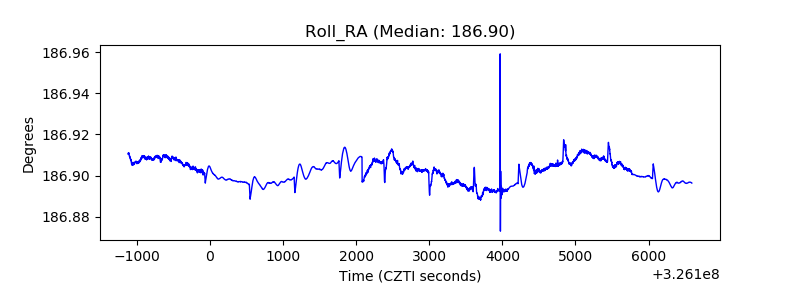 |
| Veto Counter | 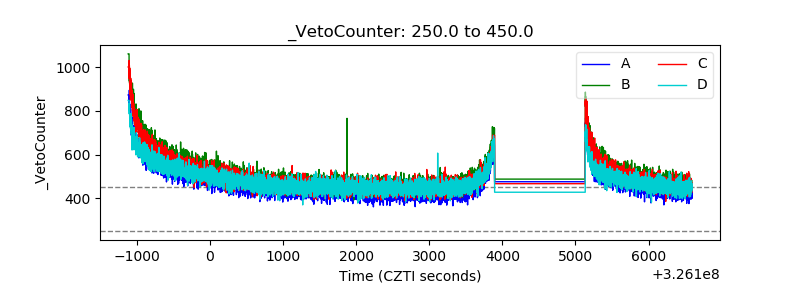 |