| Param | Original file | Final file |
|---|---|---|
| Filename | modeM0/AS1A08_003T03_9000003632_24841cztM0_level2.evt | modeM0/AS1A08_003T03_9000003632_24841cztM0_level2_quad_clean.evt |
| Size (bytes) | 512,262,720 | 88,214,400 |
| Size | 488.5 MB | 84.1 MB |
| Events in quadrant A | 3,749,674 | 558,687 |
| Events in quadrant B | 3,604,071 | 568,197 |
| Events in quadrant C | 3,563,753 | 531,840 |
| Events in quadrant D | 4,118,586 | 522,661 |
| Mode M0 | |||
|---|---|---|---|
| Quadrant | BADHDUFLAG | Total packets | Discarded packets |
| A | 0 | 15210 | 2 |
| B | 0 | 14715 | 2 |
| C | 0 | 14627 | 2 |
| D | 0 | 16581 | 2 |
| Mode M9 | |||
|---|---|---|---|
| Quadrant | BADHDUFLAG | Total packets | Discarded packets |
| A | 0 | 22 | 0 |
| B | 0 | 22 | 0 |
| C | 0 | 22 | 0 |
| D | 0 | 22 | 0 |
| Mode SS | |||
|---|---|---|---|
| Quadrant | BADHDUFLAG | Total packets | Discarded packets |
| A | 0 | 144 | 0 |
| B | 0 | 144 | 0 |
| C | 0 | 144 | 0 |
| D | 0 | 144 | 0 |
| Quadrant | Total seconds | Saturated seconds | Saturation percentage |
|---|---|---|---|
| A | 7039 | 141 | 2.003125% |
| B | 7039 | 141 | 2.003125% |
| C | 7039 | 138 | 1.960506% |
| D | 7040 | 154 | 2.187500% |
Noise dominated data is calculated using 1-second bins in cleaned event files. If a bin has >2000 counts, and if more than 50% of those come from <1% of pixels, then it is considered to be noise-dominated and hence unusable.
| Quadrant | # 1 sec bins | Bins with >0 counts | Bins with >2000 counts | High rate bins dominated by noise | Noise dominated (total time) | Noise dominated (detector-on time) | Marked lightcurve |
|---|---|---|---|---|---|---|---|
| A | 9209 | 7041 | 23 | 23 | 0.25% | 0.33% | 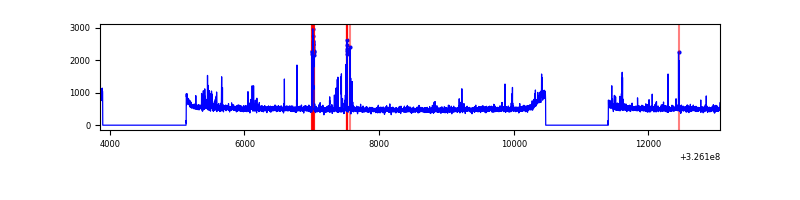 |
| B | 9209 | 7041 | 2 | 2 | 0.02% | 0.03% | 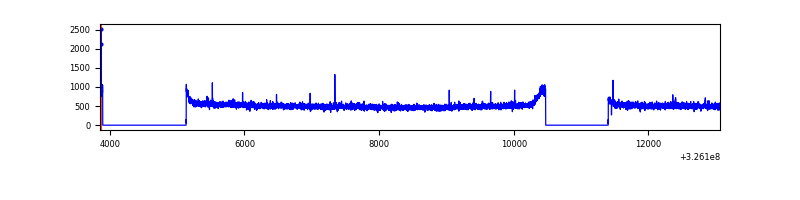 |
| C | 9209 | 7041 | 0 | 0 | 0.00% | 0.00% | 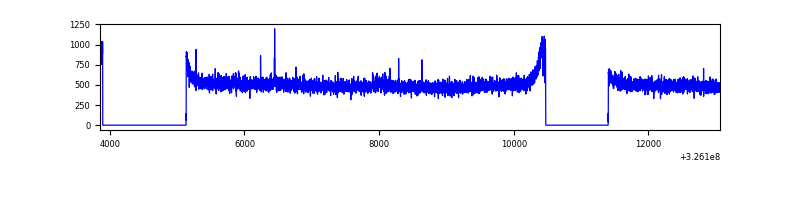 |
| D | 9210 | 7042 | 74 | 74 | 0.80% | 1.05% | 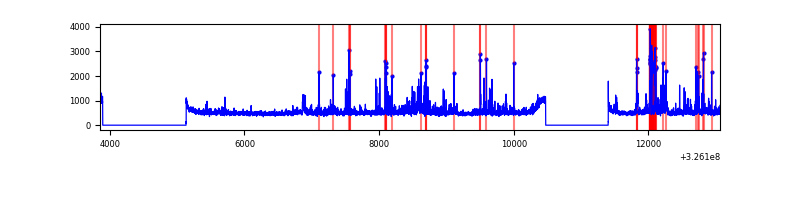 |
Top three noisy pixels from each quadrant. If the there are fewer than three noisy pixels in the level2.evt file, extra rows are filled as -1
| Pixel properties | Quadrant properties | ||||||
|---|---|---|---|---|---|---|---|
| Quadrant | DetID | PixID | Counts | Sigma | Mean | Median | Sigma |
| A | 6 | 16 | 175496 | 937.81 | 927 | 912 | 186.2 |
| A | 13 | 254 | 10579 | 51.93 | 927 | 912 | 186.2 |
| A | 3 | 137 | 8676 | 41.71 | 927 | 912 | 186.2 |
| B | 12 | 111 | 21683 | 117.85 | 914 | 891 | 176.4 |
| B | 11 | 111 | 19873 | 107.59 | 914 | 891 | 176.4 |
| B | 14 | 111 | 18765 | 101.31 | 914 | 891 | 176.4 |
| C | 14 | 238 | 137645 | 670.86 | 873 | 878 | 203.9 |
| C | 2 | 16 | 16538 | 76.81 | 873 | 878 | 203.9 |
| C | 7 | 247 | 9467 | 42.13 | 873 | 878 | 203.9 |
| D | 1 | 52 | 423666 | 1973.84 | 883 | 860 | 214.2 |
| D | 8 | 195 | 168209 | 781.26 | 883 | 860 | 214.2 |
| D | 5 | 222 | 152602 | 708.4 | 883 | 860 | 214.2 |
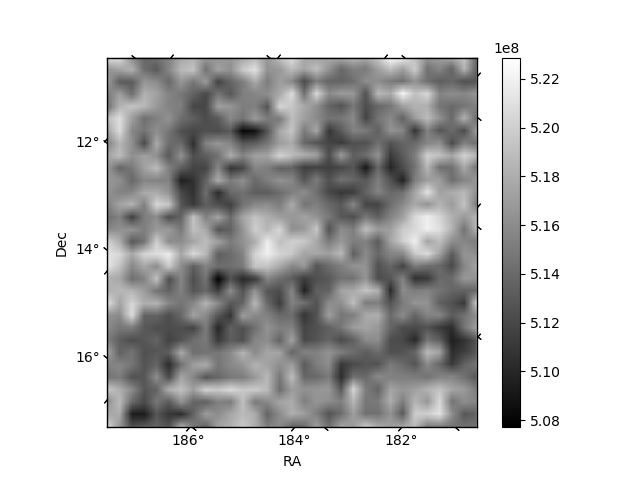
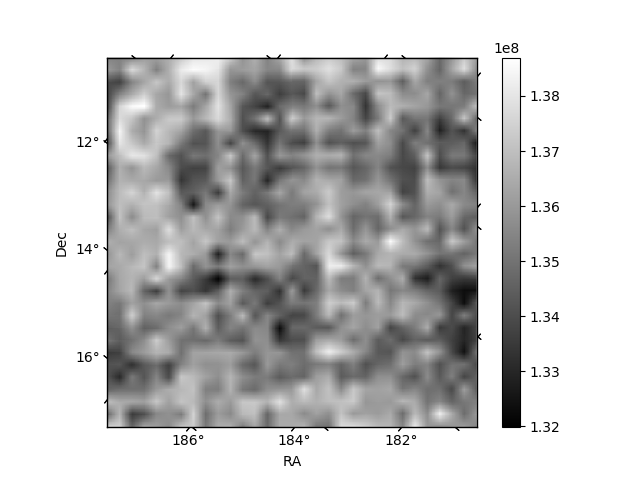
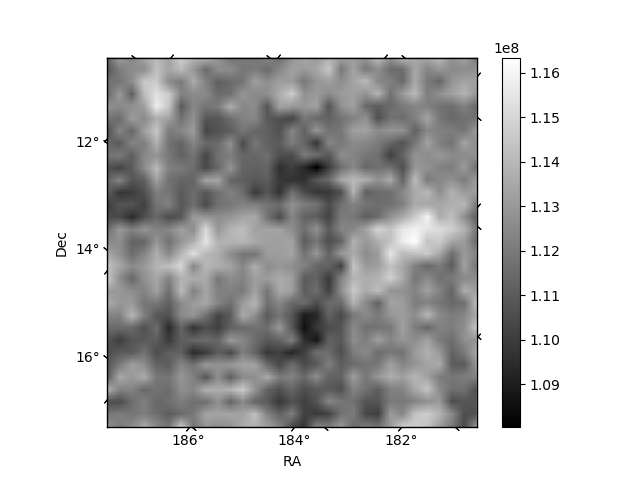
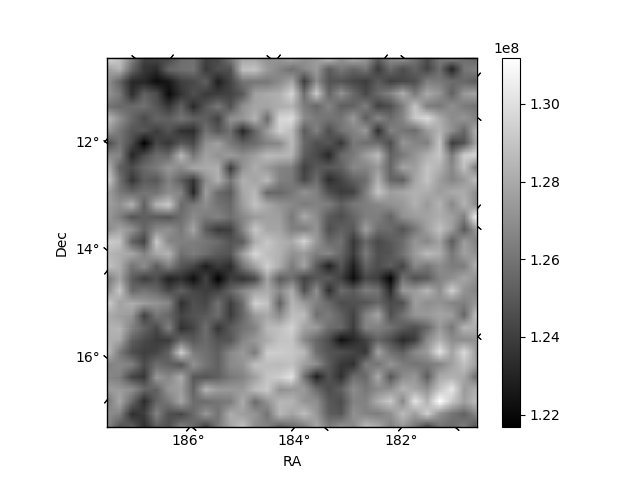
Histogram calculated using DETX and DETY for each event in the final _common_clean file
| Quadrant A | 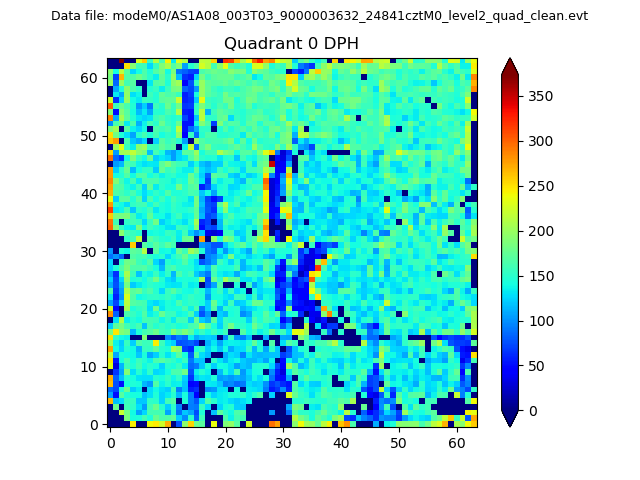 |
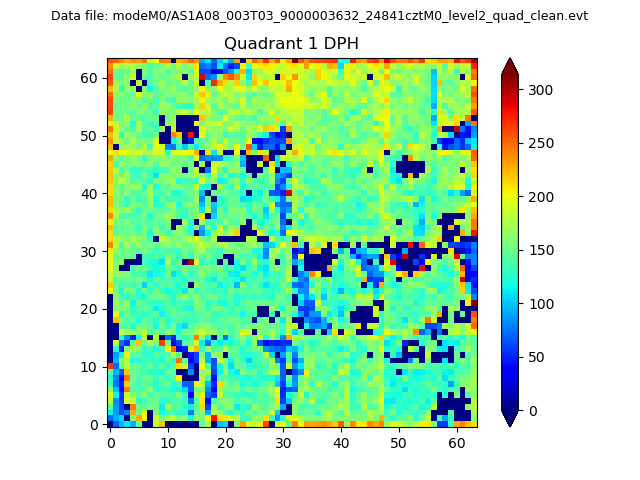 |
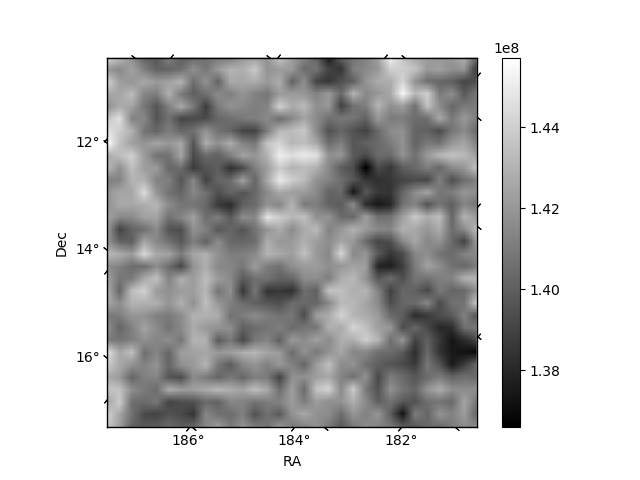
Quadrant B |
|---|---|---|---|
| Quadrant D | 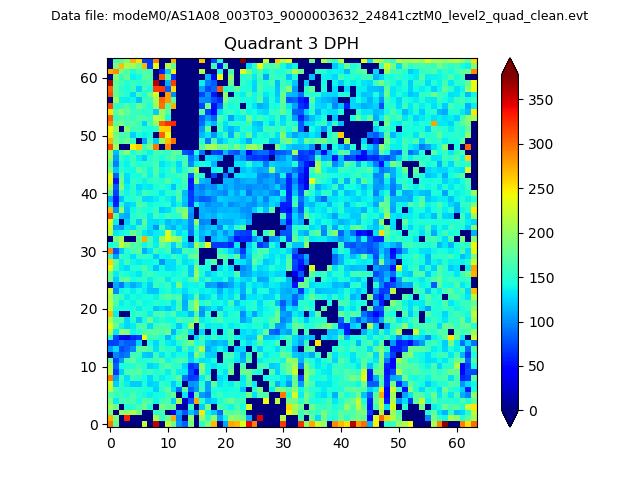 |
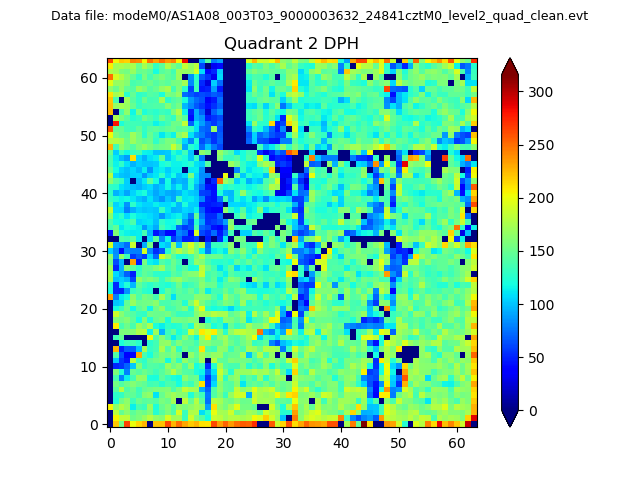 |
Quadrant C |
| Plot type | Count rate plots | Images |
|---|---|---|
| Comparison with Poisson distribution Blue bars denote a histogram of data divided into 1 sec bins. Red curve is a Poisson curve with rate = median count rate of data. |
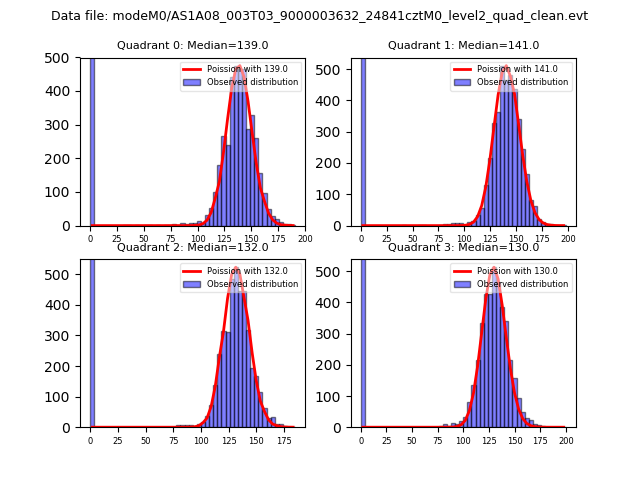 |
 |
| Quadrant-wise count rates Data is divided into 100 sec bins |
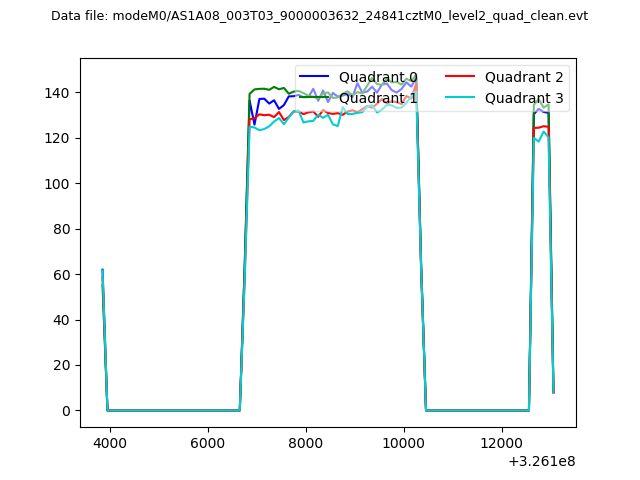 |
|
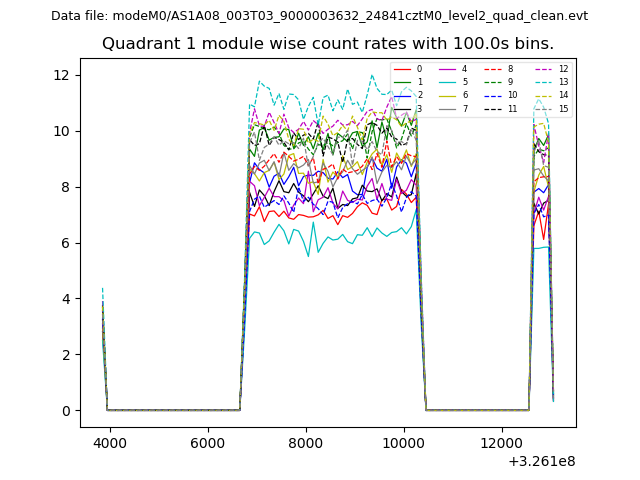
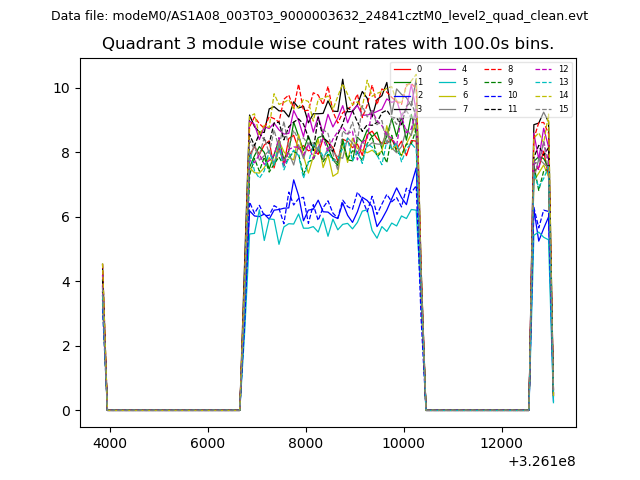
| Module-wise count rates for Quadrant A Data is divided into 100 sec bins |
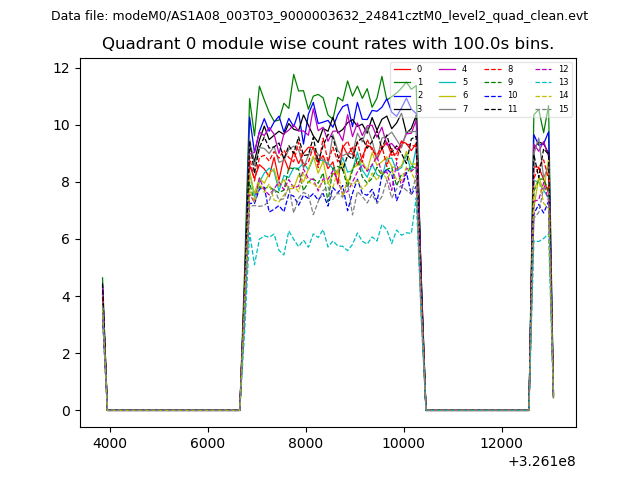 |
 |
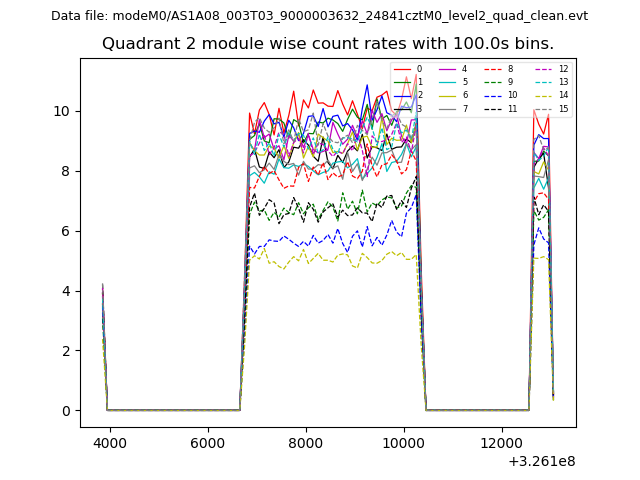
| Module-wise count rates for Quadrant B Data is divided into 100 sec bins |
 |
 |
| Module-wise count rates for Quadrant C Data is divided into 100 sec bins |
 |
 |
| Module-wise count rates for Quadrant D Data is divided into 100 sec bins |
 |
 |
| Parameter | Plot |
|---|---|
| CZT HV Monitor | 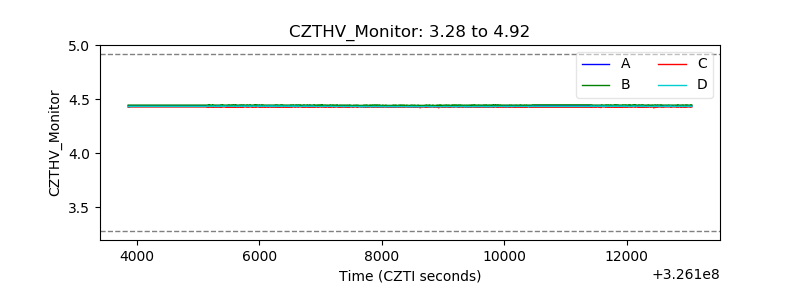 |
| D_VDD | 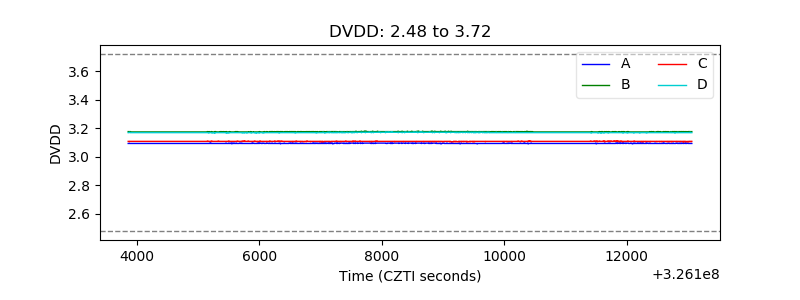 |
| Temperature 1 | 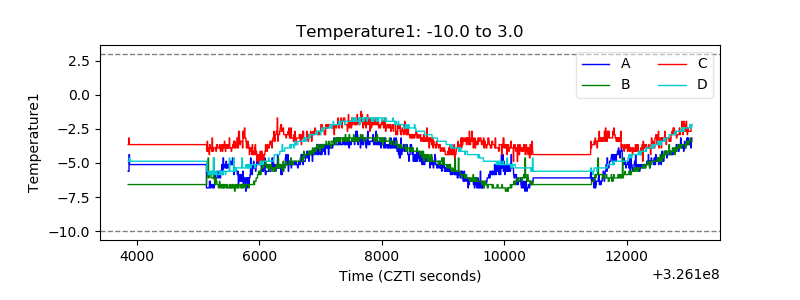 |
| Veto HV Monitor | 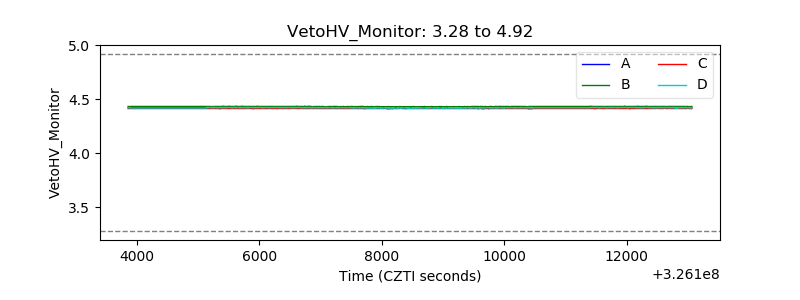 |
| Veto LLD | 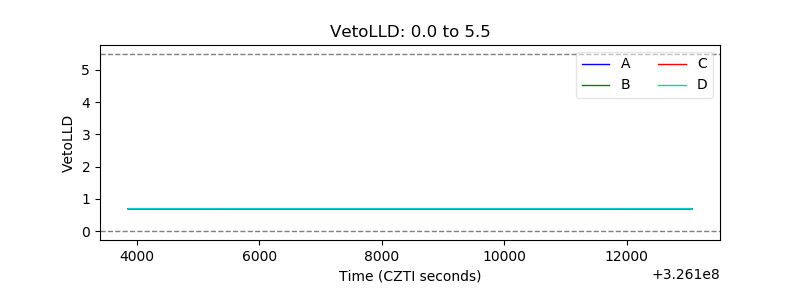 |
| Alpha Counter | 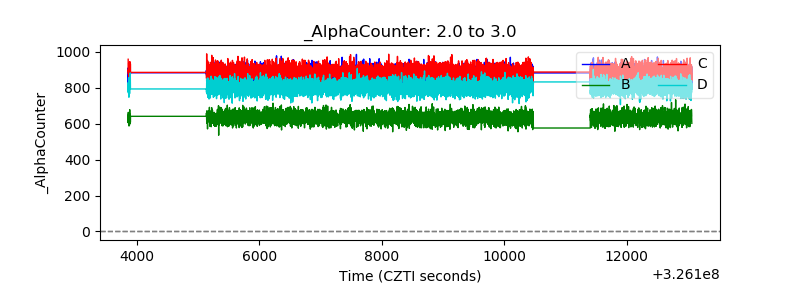 |
| _CPM_Rate | 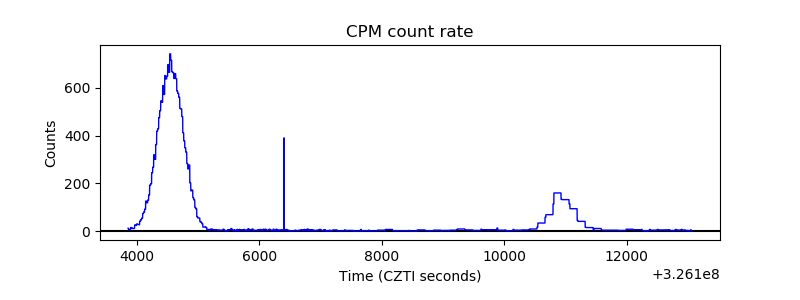 |
| CZT Counter | 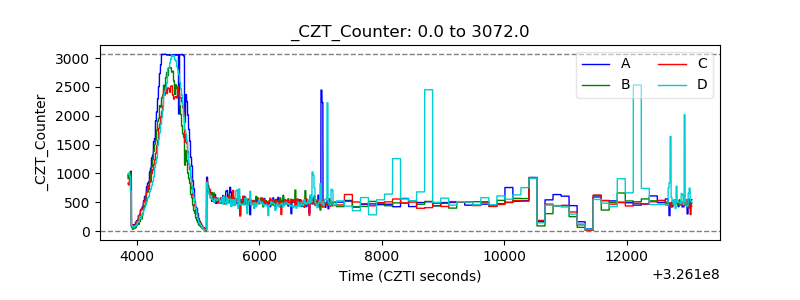 |
| +2.5 Volts monitor | 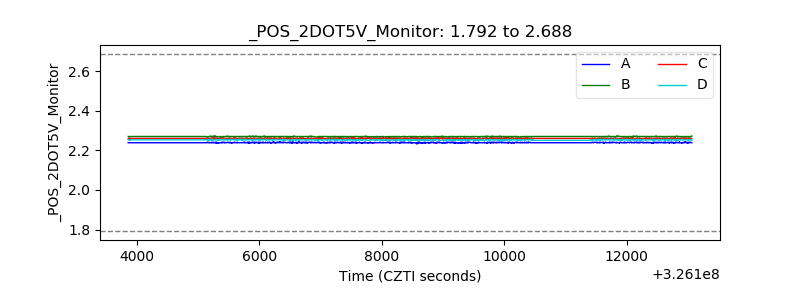 |
| +5 Volts monitor | 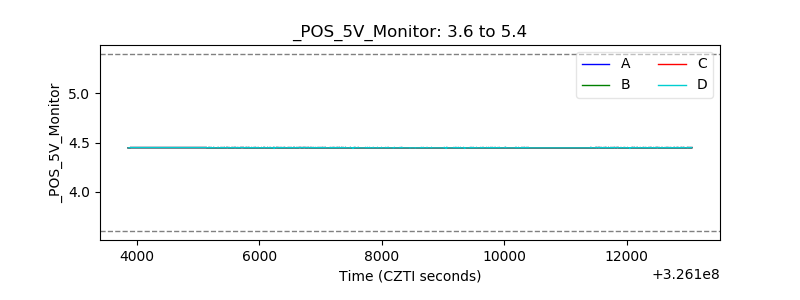 |
| _ROLL_ROT | 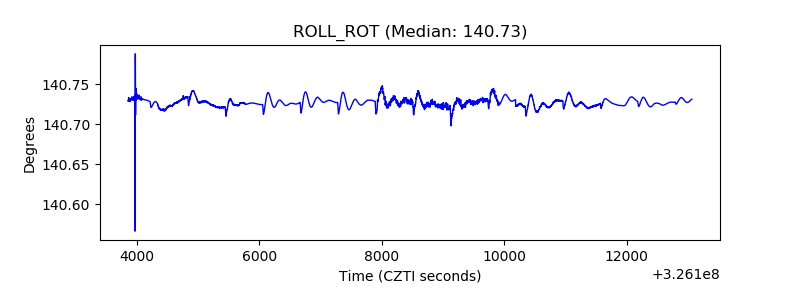 |
| _Roll_DEC | 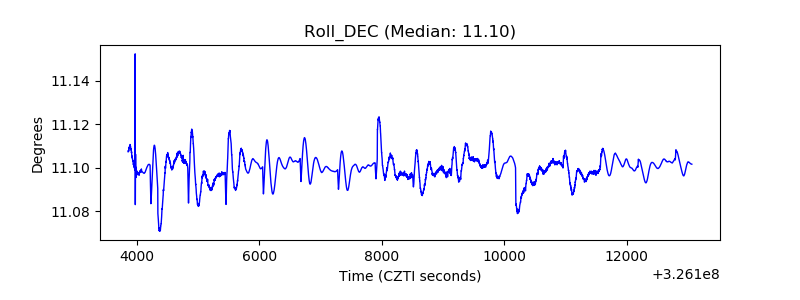 |
| _Roll_RA |  |
| Veto Counter | 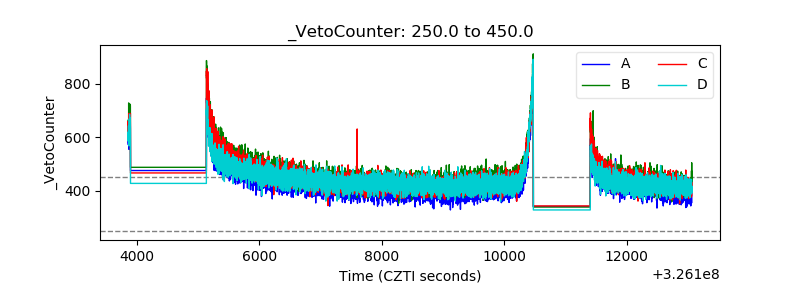 |