| Param | Original file | Final file |
|---|---|---|
| Filename | modeM0/AS1A08_003T03_9000003632_24842cztM0_level2.evt | modeM0/AS1A08_003T03_9000003632_24842cztM0_level2_quad_clean.evt |
| Size (bytes) | 523,866,240 | 90,642,240 |
| Size | 499.6 MB | 86.4 MB |
| Events in quadrant A | 3,709,057 | 573,687 |
| Events in quadrant B | 3,657,794 | 580,007 |
| Events in quadrant C | 3,589,877 | 545,096 |
| Events in quadrant D | 4,407,930 | 533,135 |
| Mode M0 | |||
|---|---|---|---|
| Quadrant | BADHDUFLAG | Total packets | Discarded packets |
| A | 0 | 15415 | 2 |
| B | 0 | 15276 | 2 |
| C | 0 | 15134 | 2 |
| D | 0 | 17693 | 2 |
| Mode M9 | |||
|---|---|---|---|
| Quadrant | BADHDUFLAG | Total packets | Discarded packets |
| A | 0 | 11 | 0 |
| B | 0 | 12 | 0 |
| C | 0 | 12 | 0 |
| D | 0 | 12 | 0 |
| Mode SS | |||
|---|---|---|---|
| Quadrant | BADHDUFLAG | Total packets | Discarded packets |
| A | 0 | 150 | 0 |
| B | 0 | 150 | 0 |
| C | 0 | 150 | 0 |
| D | 0 | 150 | 0 |
| Quadrant | Total seconds | Saturated seconds | Saturation percentage |
|---|---|---|---|
| A | 7376 | 116 | 1.572668% |
| B | 7376 | 133 | 1.803145% |
| C | 7376 | 148 | 2.006508% |
| D | 7376 | 180 | 2.440347% |
Noise dominated data is calculated using 1-second bins in cleaned event files. If a bin has >2000 counts, and if more than 50% of those come from <1% of pixels, then it is considered to be noise-dominated and hence unusable.
| Quadrant | # 1 sec bins | Bins with >0 counts | Bins with >2000 counts | High rate bins dominated by noise | Noise dominated (total time) | Noise dominated (detector-on time) | Marked lightcurve |
|---|---|---|---|---|---|---|---|
| A | 7856 | 7378 | 6 | 6 | 0.08% | 0.08% |  |
| B | 7856 | 7378 | 1 | 1 | 0.01% | 0.01% |  |
| C | 7856 | 7378 | 0 | 0 | 0.00% | 0.00% |  |
| D | 7856 | 7378 | 100 | 100 | 1.27% | 1.36% |  |
Top three noisy pixels from each quadrant. If the there are fewer than three noisy pixels in the level2.evt file, extra rows are filled as -1
| Pixel properties | Quadrant properties | ||||||
|---|---|---|---|---|---|---|---|
| Quadrant | DetID | PixID | Counts | Sigma | Mean | Median | Sigma |
| A | 6 | 16 | 119437 | 634.55 | 931 | 913 | 186.8 |
| A | 13 | 254 | 9905 | 48.14 | 931 | 913 | 186.8 |
| A | 3 | 137 | 8751 | 41.96 | 931 | 913 | 186.8 |
| B | 12 | 111 | 22564 | 122.03 | 922 | 898 | 177.6 |
| B | 11 | 111 | 20430 | 110.01 | 922 | 898 | 177.6 |
| B | 14 | 111 | 18830 | 101.0 | 922 | 898 | 177.6 |
| C | 14 | 238 | 140493 | 676.08 | 883 | 890 | 206.5 |
| C | 13 | 61 | 6155 | 25.5 | 883 | 890 | 206.5 |
| C | 7 | 247 | 5120 | 20.49 | 883 | 890 | 206.5 |
| D | 1 | 52 | 469520 | 2148.72 | 891 | 864 | 218.1 |
| D | 8 | 195 | 308051 | 1408.41 | 891 | 864 | 218.1 |
| D | 5 | 222 | 220608 | 1007.5 | 891 | 864 | 218.1 |
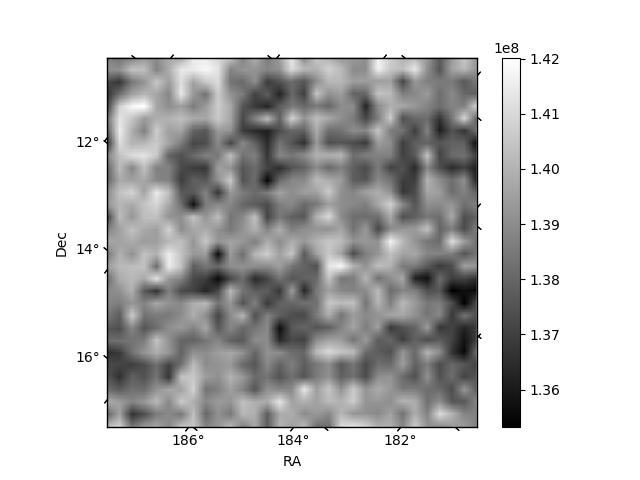
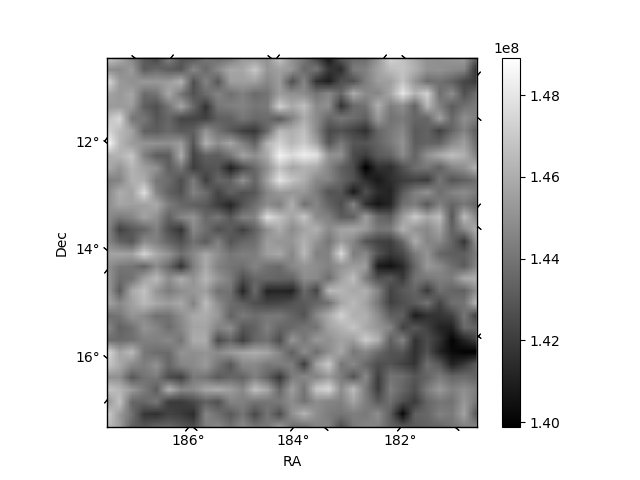
Histogram calculated using DETX and DETY for each event in the final _common_clean file
| Quadrant A | 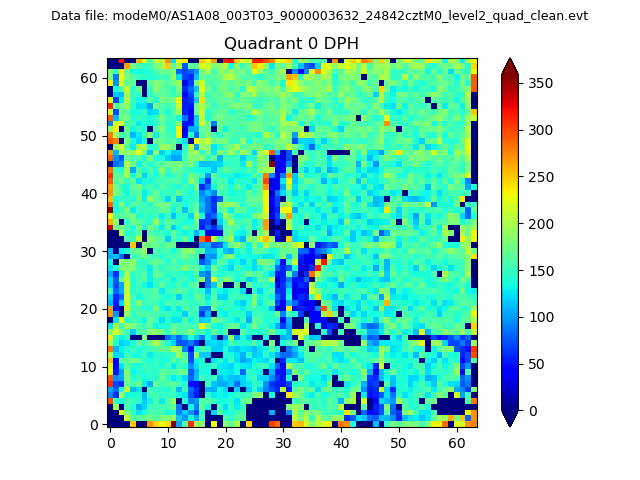 |
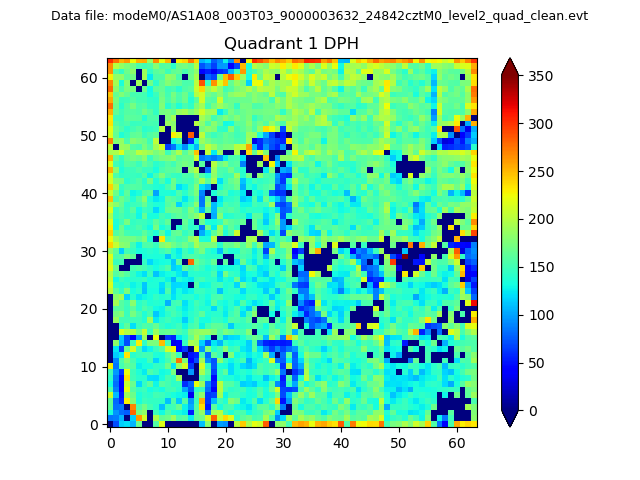 |
Quadrant B |
|---|---|---|---|
| Quadrant D | 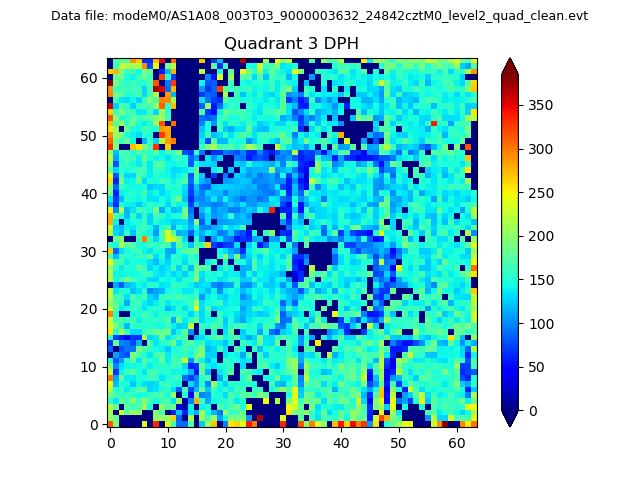 |
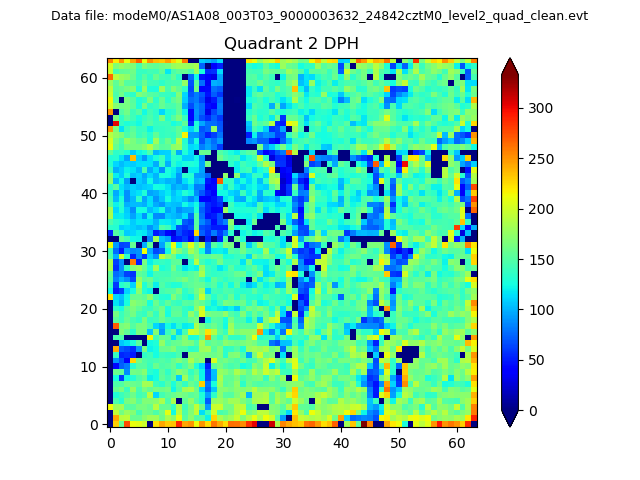 |
Quadrant C |
| Plot type | Count rate plots | Images |
|---|---|---|
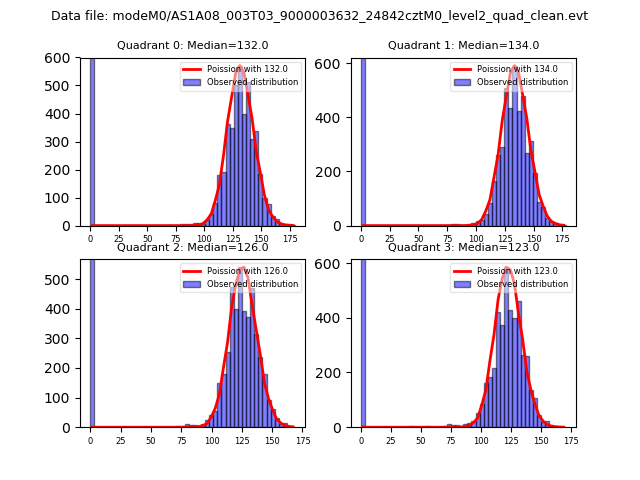
| Comparison with Poisson distribution Blue bars denote a histogram of data divided into 1 sec bins. Red curve is a Poisson curve with rate = median count rate of data. |
 |
 |
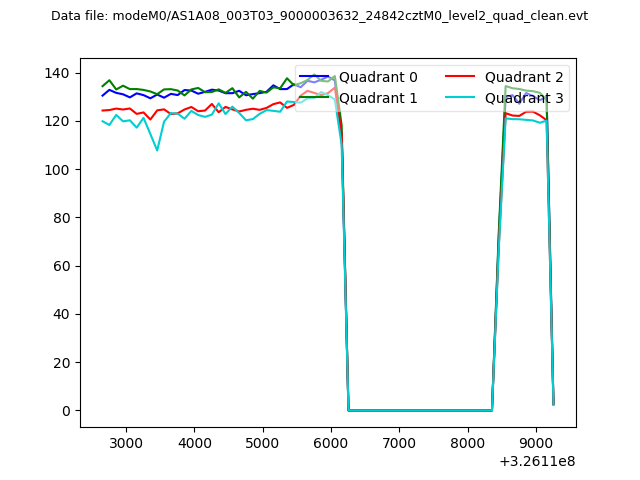
| Quadrant-wise count rates Data is divided into 100 sec bins |
 |
|
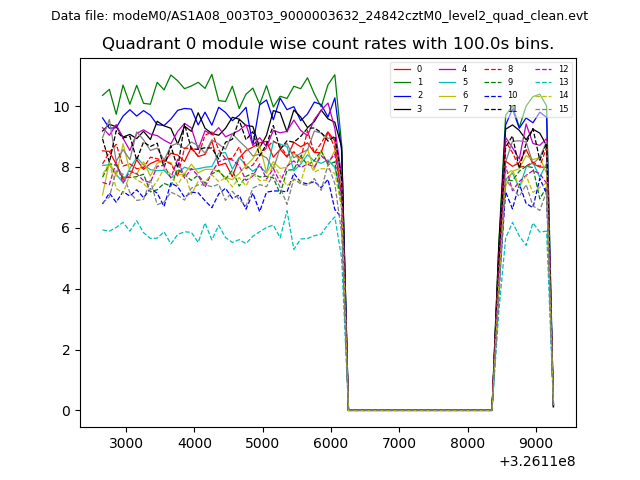
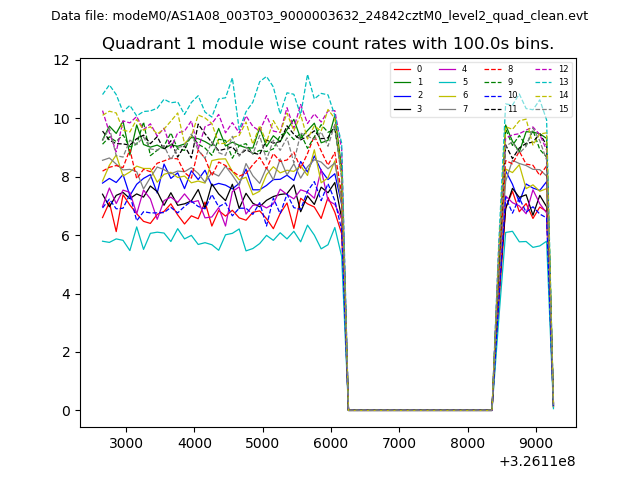
| Module-wise count rates for Quadrant A Data is divided into 100 sec bins |
 |
 |
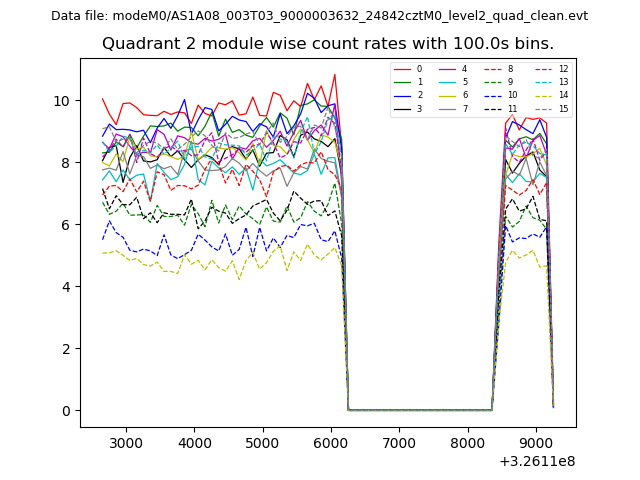
| Module-wise count rates for Quadrant B Data is divided into 100 sec bins |
 |
 |
| Module-wise count rates for Quadrant C Data is divided into 100 sec bins |
 |
 |
| Module-wise count rates for Quadrant D Data is divided into 100 sec bins |
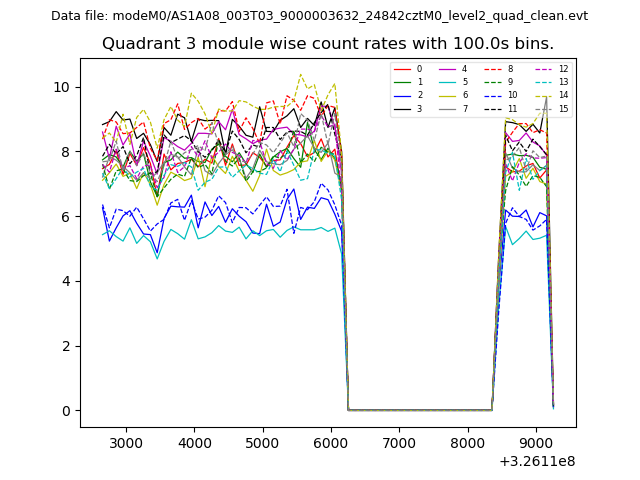 |
 |
| Parameter | Plot |
|---|---|
| CZT HV Monitor | 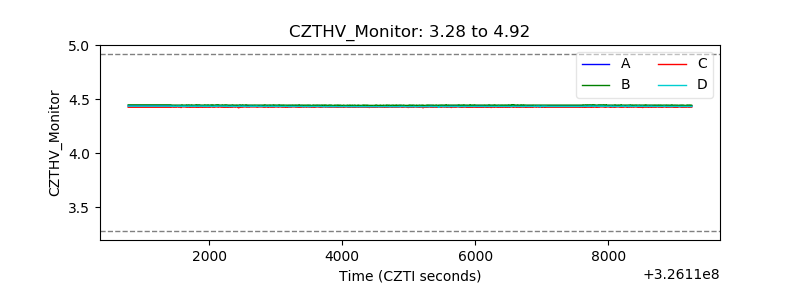 |
| D_VDD | 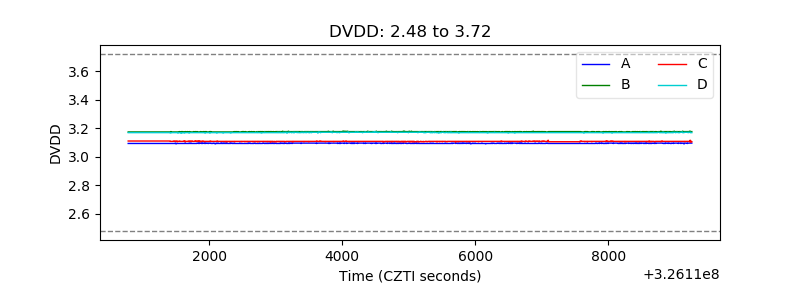 |
| Temperature 1 | 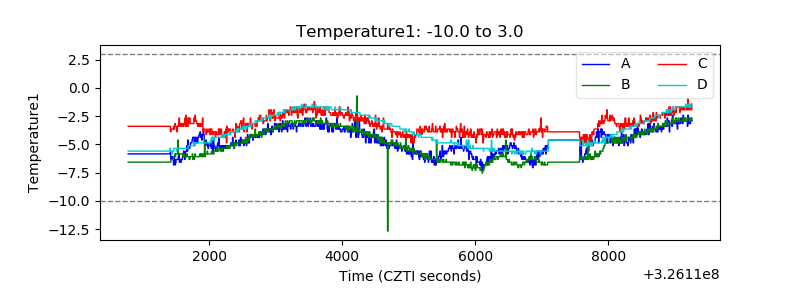 |
| Veto HV Monitor | 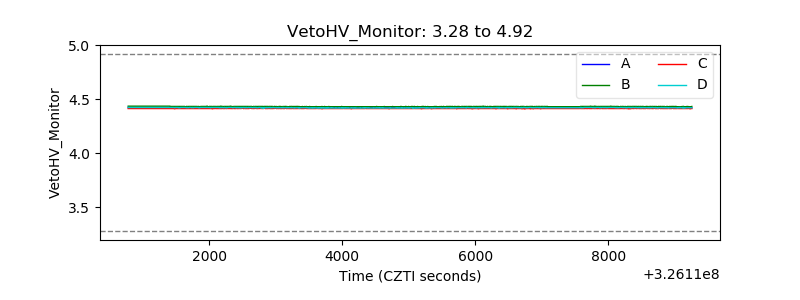 |
| Veto LLD | 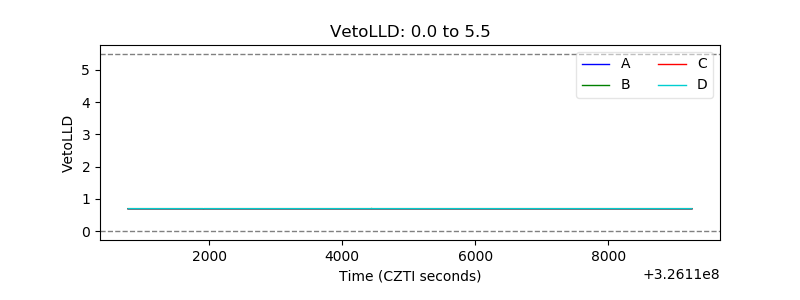 |
| Alpha Counter | 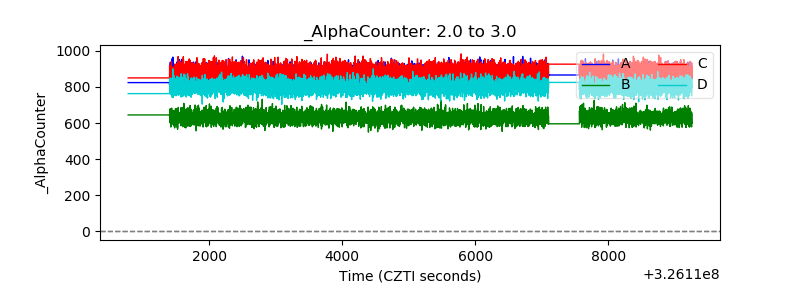 |
| _CPM_Rate | 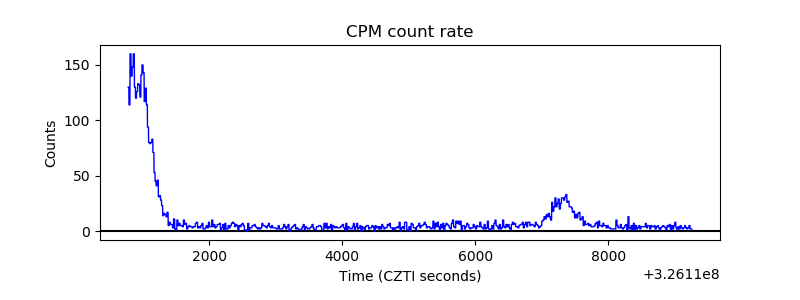 |
| CZT Counter | 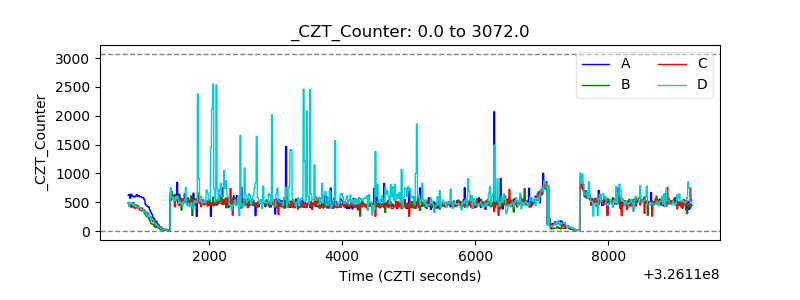 |
| +2.5 Volts monitor | 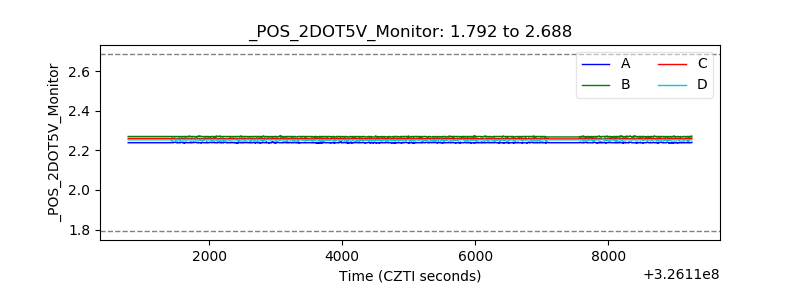 |
| +5 Volts monitor |  |
| _ROLL_ROT |  |
| _Roll_DEC | 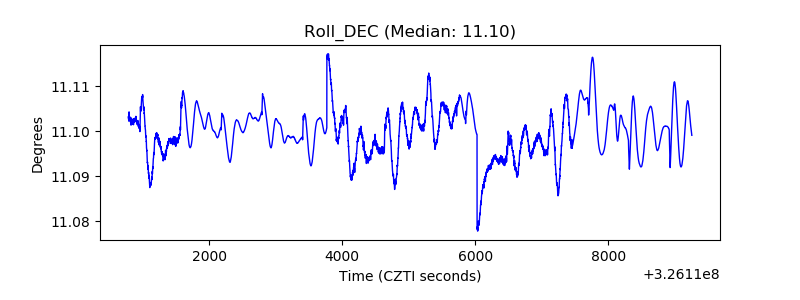 |
| _Roll_RA | 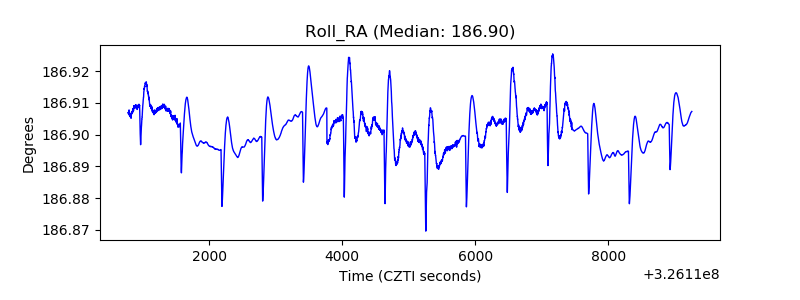 |
| Veto Counter | 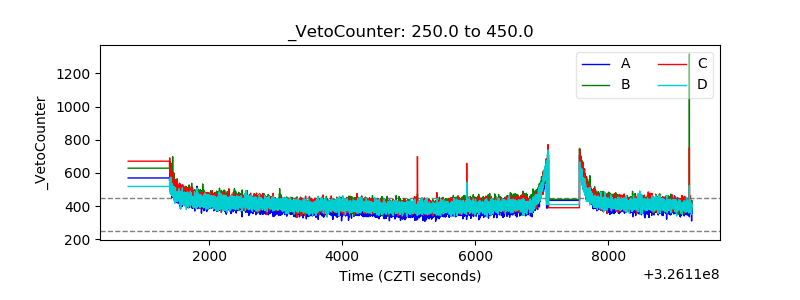 |