| Param | Original file | Final file |
|---|---|---|
| Filename | modeM0/AS1A08_003T03_9000003632_24843cztM0_level2.evt | modeM0/AS1A08_003T03_9000003632_24843cztM0_level2_quad_clean.evt |
| Size (bytes) | 206,801,280 | 52,715,520 |
| Size | 197.2 MB | 50.3 MB |
| Events in quadrant A | 1,409,443 | 353,569 |
| Events in quadrant B | 1,433,901 | 357,380 |
| Events in quadrant C | 1,417,534 | 335,627 |
| Events in quadrant D | 1,791,006 | 330,605 |
| Mode M0 | |||
|---|---|---|---|
| Quadrant | BADHDUFLAG | Total packets | Discarded packets |
| A | 0 | 6178 | 0 |
| B | 0 | 6245 | 0 |
| C | 0 | 6182 | 0 |
| D | 0 | 7264 | 0 |
| Mode SS | |||
|---|---|---|---|
| Quadrant | BADHDUFLAG | Total packets | Discarded packets |
| A | 0 | 60 | 0 |
| B | 0 | 60 | 0 |
| C | 0 | 60 | 0 |
| D | 0 | 60 | 0 |
| Quadrant | Total seconds | Saturated seconds | Saturation percentage |
|---|---|---|---|
| A | 3080 | 2 | 0.064935% |
| B | 3080 | 4 | 0.129870% |
| C | 3081 | 15 | 0.486855% |
| D | 3081 | 11 | 0.357027% |
Noise dominated data is calculated using 1-second bins in cleaned event files. If a bin has >2000 counts, and if more than 50% of those come from <1% of pixels, then it is considered to be noise-dominated and hence unusable.
| Quadrant | # 1 sec bins | Bins with >0 counts | Bins with >2000 counts | High rate bins dominated by noise | Noise dominated (total time) | Noise dominated (detector-on time) | Marked lightcurve |
|---|---|---|---|---|---|---|---|
| A | 3080 | 3080 | 0 | 0 | 0.00% | 0.00% | 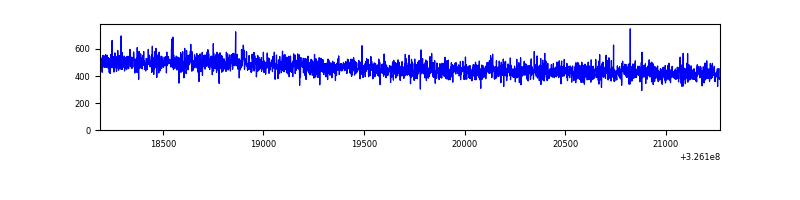 |
| B | 3080 | 3080 | 0 | 0 | 0.00% | 0.00% | 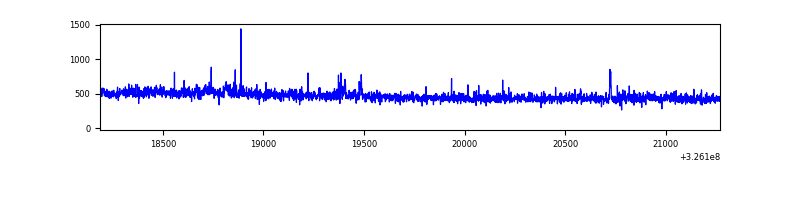 |
| C | 3081 | 3081 | 0 | 0 | 0.00% | 0.00% | 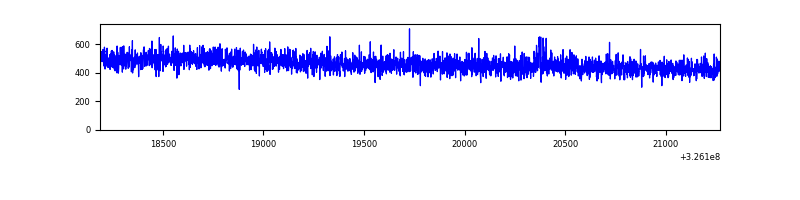 |
| D | 3081 | 3081 | 8 | 8 | 0.26% | 0.26% | 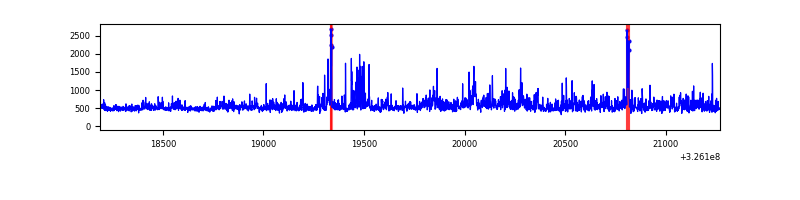 |
Top three noisy pixels from each quadrant. If the there are fewer than three noisy pixels in the level2.evt file, extra rows are filled as -1
| Pixel properties | Quadrant properties | ||||||
|---|---|---|---|---|---|---|---|
| Quadrant | DetID | PixID | Counts | Sigma | Mean | Median | Sigma |
| A | 13 | 254 | 4215 | 51.5 | 364 | 355 | 74.9 |
| A | 3 | 137 | 3240 | 38.49 | 364 | 355 | 74.9 |
| A | 0 | 226 | 3125 | 36.95 | 364 | 355 | 74.9 |
| B | 0 | 189 | 12666 | 175.12 | 358 | 350 | 70.3 |
| B | 12 | 111 | 8270 | 112.62 | 358 | 350 | 70.3 |
| B | 11 | 111 | 7606 | 103.17 | 358 | 350 | 70.3 |
| C | 14 | 238 | 56286 | 680.92 | 346 | 348 | 82.2 |
| C | 7 | 247 | 6259 | 71.95 | 346 | 348 | 82.2 |
| C | 8 | 128 | 4304 | 48.16 | 346 | 348 | 82.2 |
| D | 8 | 195 | 278528 | 3173.6 | 354 | 343 | 87.7 |
| D | 1 | 52 | 100745 | 1145.41 | 354 | 343 | 87.7 |
| D | 12 | 218 | 36250 | 409.64 | 354 | 343 | 87.7 |
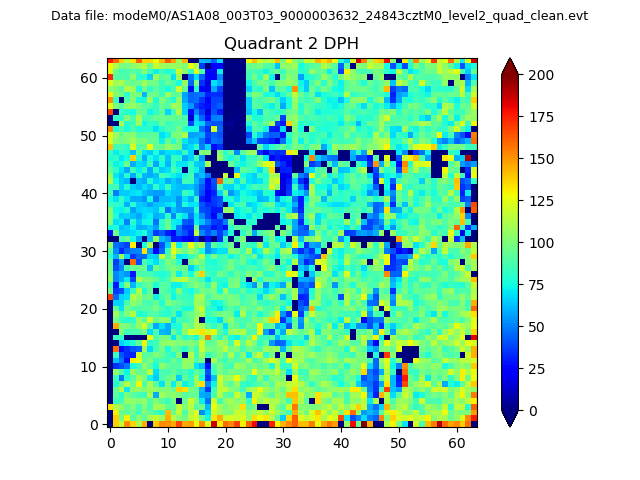
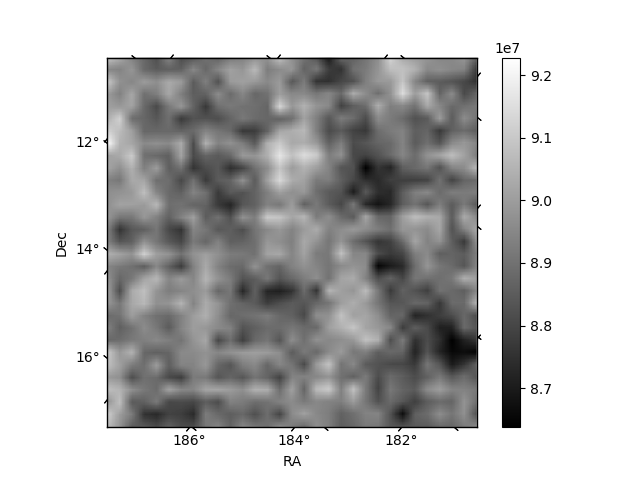
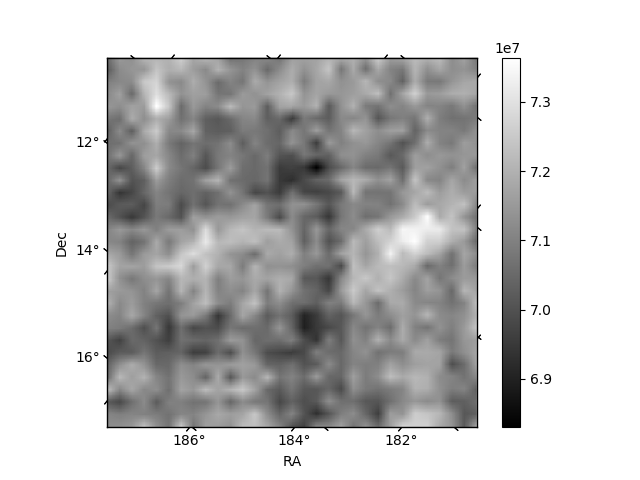
Histogram calculated using DETX and DETY for each event in the final _common_clean file
| Quadrant A | 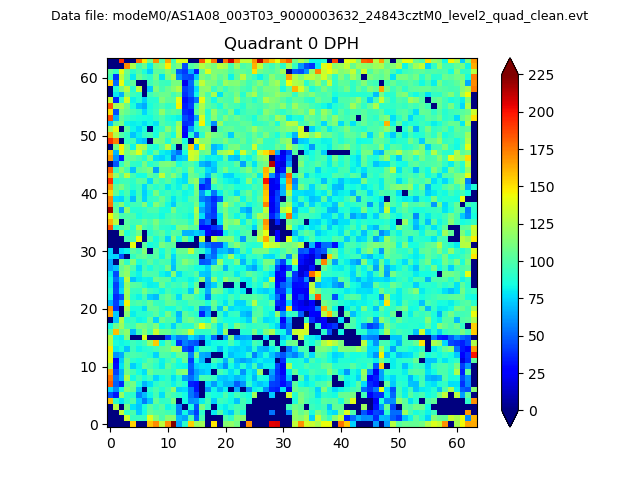 |
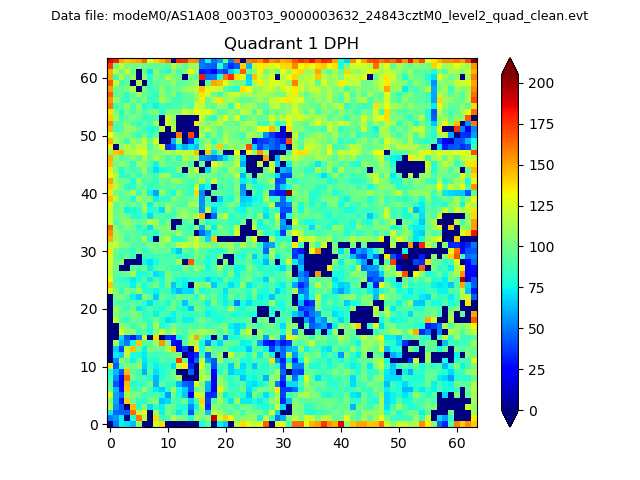 |
Quadrant B |
|---|---|---|---|
| Quadrant D | 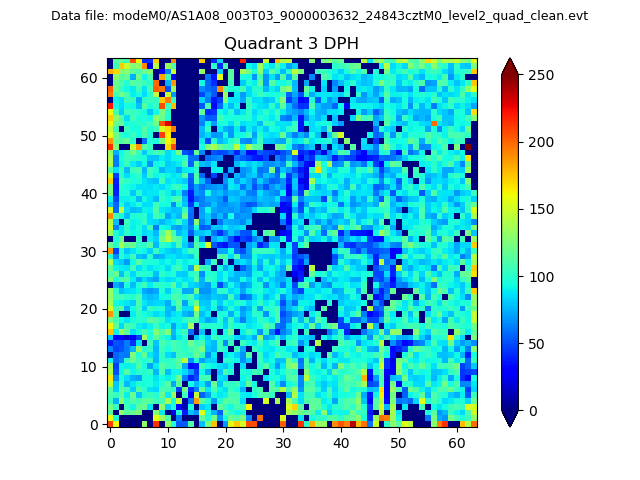 |
 |
Quadrant C |
| Plot type | Count rate plots | Images |
|---|---|---|
| Comparison with Poisson distribution Blue bars denote a histogram of data divided into 1 sec bins. Red curve is a Poisson curve with rate = median count rate of data. |
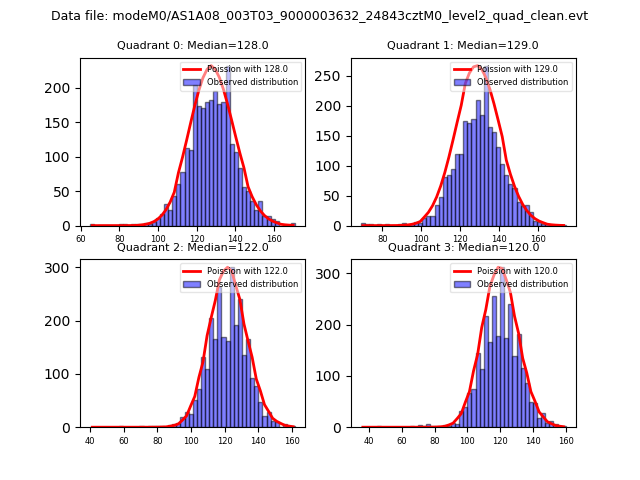 |
 |
| Quadrant-wise count rates Data is divided into 100 sec bins |
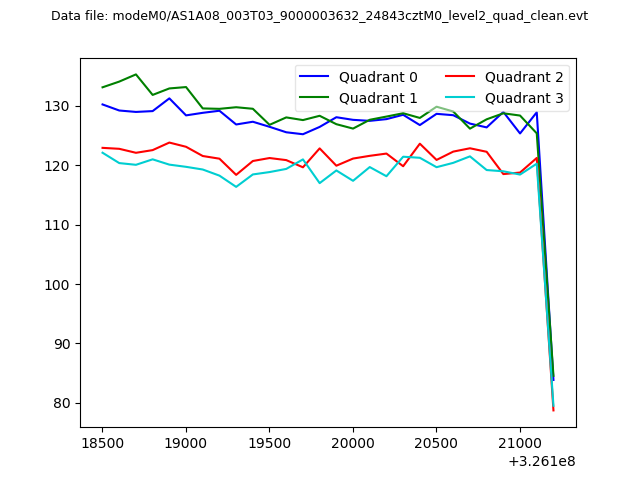 |
|
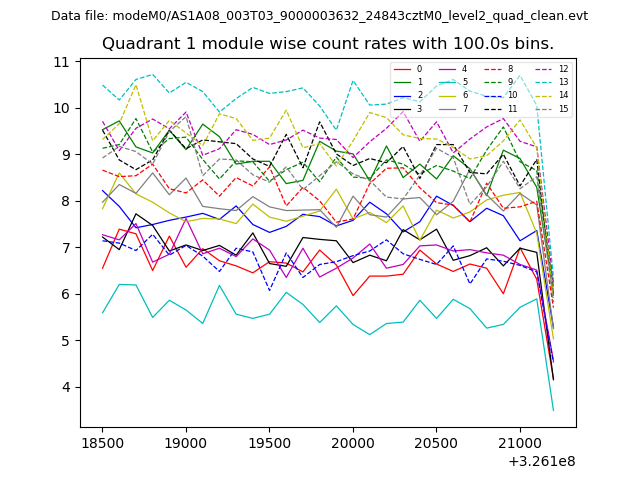
| Module-wise count rates for Quadrant A Data is divided into 100 sec bins |
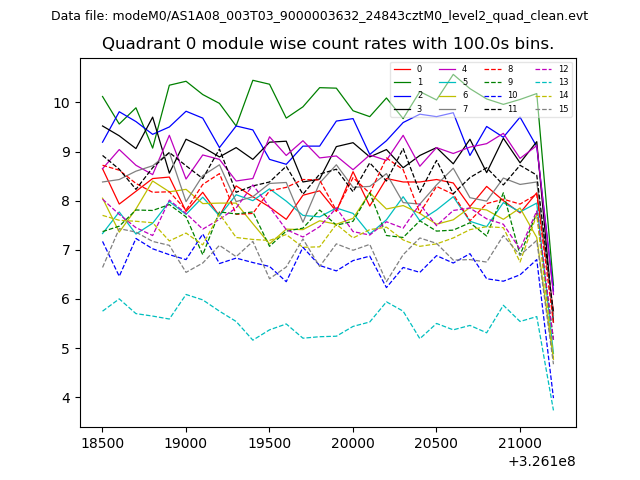 |
 |
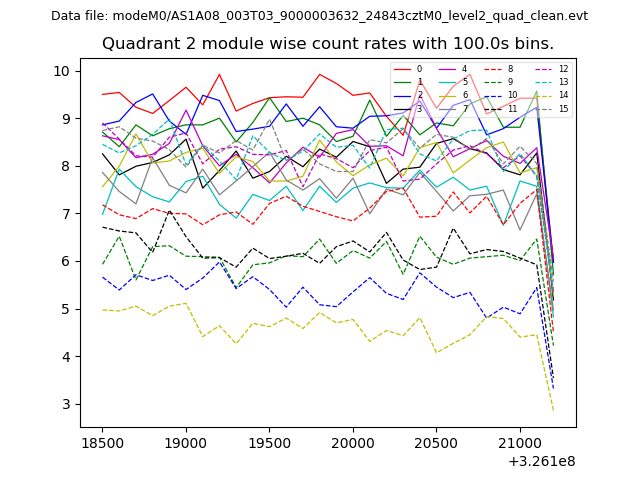
| Module-wise count rates for Quadrant B Data is divided into 100 sec bins |
 |
 |
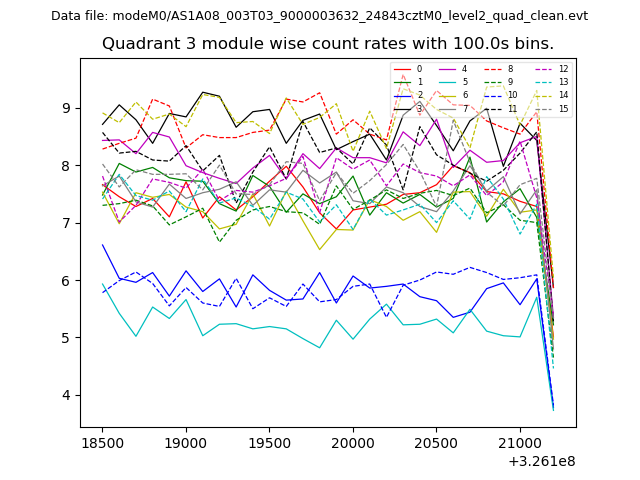
| Module-wise count rates for Quadrant C Data is divided into 100 sec bins |
 |
 |
| Module-wise count rates for Quadrant D Data is divided into 100 sec bins |
 |
 |
| Parameter | Plot |
|---|---|
| CZT HV Monitor | 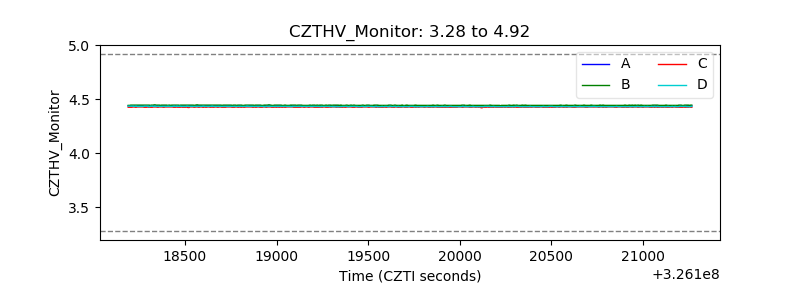 |
| D_VDD | 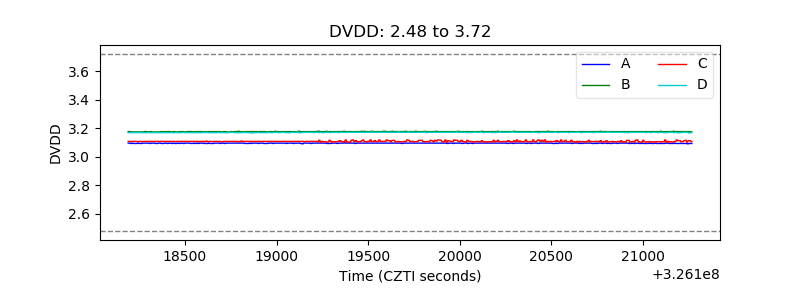 |
| Temperature 1 | 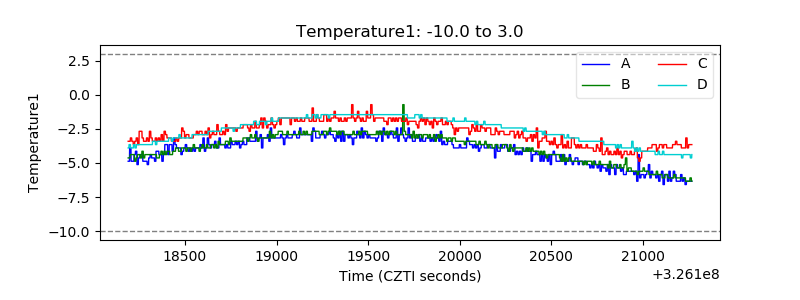 |
| Veto HV Monitor | 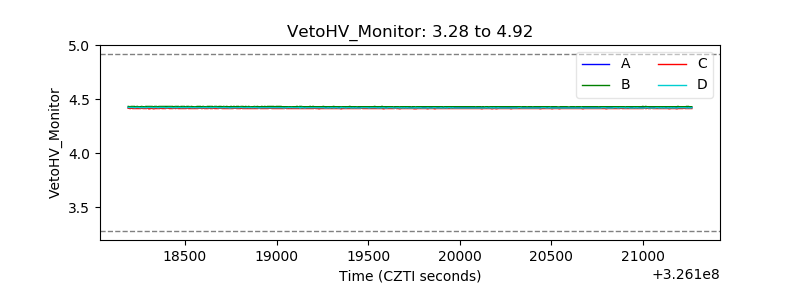 |
| Veto LLD | 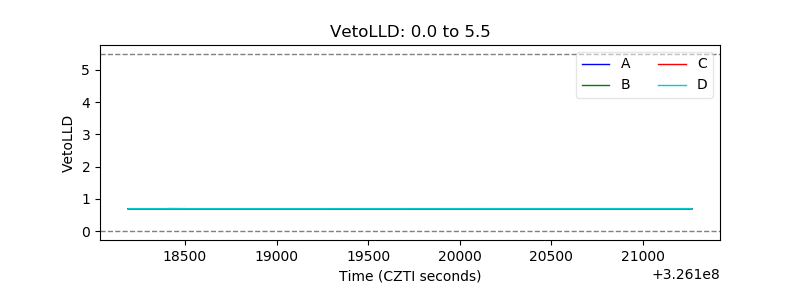 |
| Alpha Counter |  |
| _CPM_Rate | 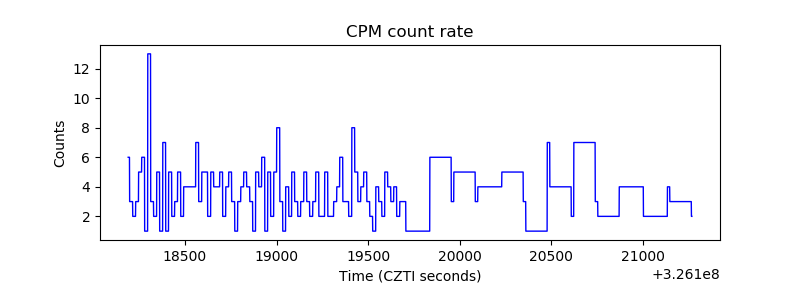 |
| CZT Counter | 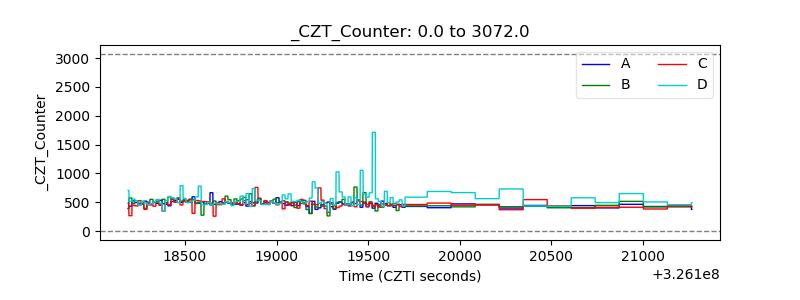 |
| +2.5 Volts monitor |  |
| +5 Volts monitor |  |
| _ROLL_ROT | 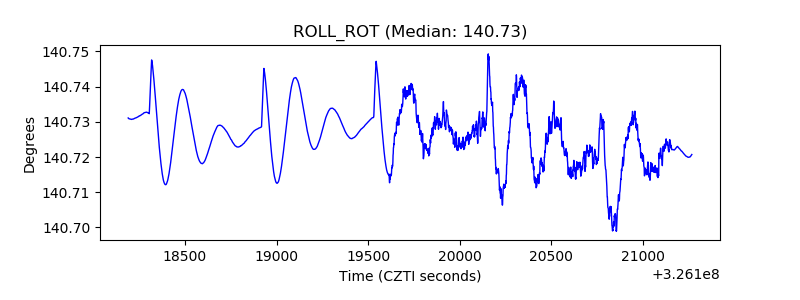 |
| _Roll_DEC | 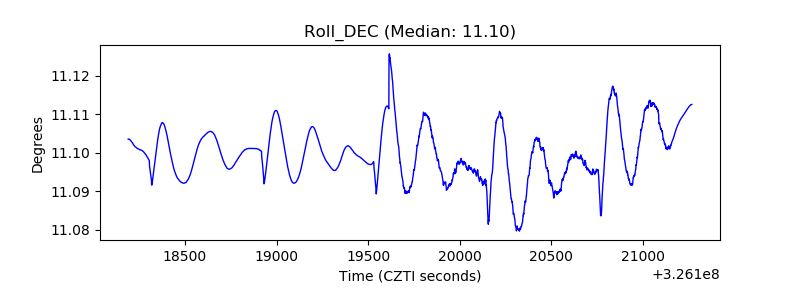 |
| _Roll_RA | 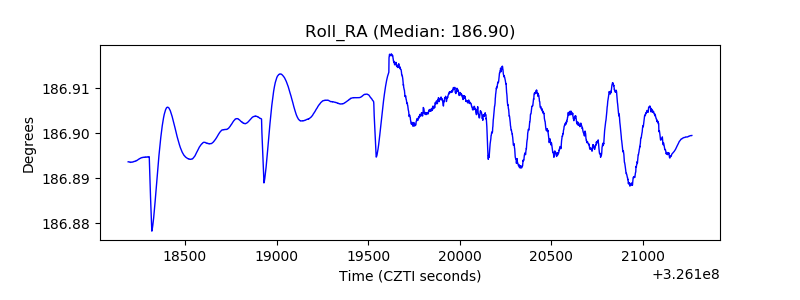 |
| Veto Counter | 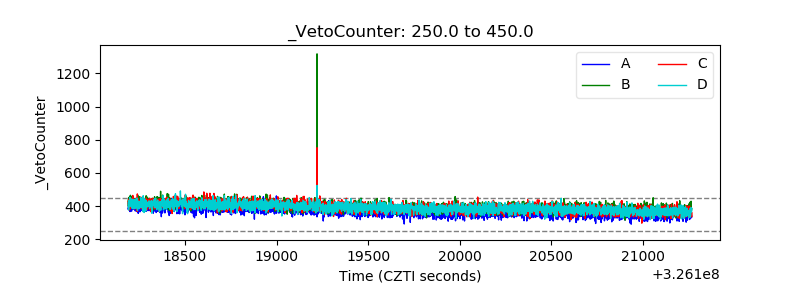 |