| Param | Original file | Final file |
|---|---|---|
| Filename | modeM0/AS1A08_003T04_9000003634cztM0_level2.fits | modeM0/AS1A08_003T04_9000003634cztM0_level2_quad_clean.evt |
| Size (bytes) | 248,414,400 | 225,668,160 |
| Size | 236.9 MB | 215.2 MB |
| Events in quadrant A | 1,516,914 | 1,344,186 |
| Events in quadrant B | 1,470,686 | 1,354,000 |
| Events in quadrant C | 1,470,120 | 1,266,844 |
| Events in quadrant D | 1,270,692 | 1,074,720 |
| Mode M0 | |||
|---|---|---|---|
| Quadrant | BADHDUFLAG | Total packets | Discarded packets |
| A | 0 | 58576 | 0 |
| B | 0 | 54666 | 0 |
| C | 0 | 55930 | 0 |
| D | 0 | 65899 | 0 |
| Mode M9 | |||
|---|---|---|---|
| Quadrant | BADHDUFLAG | Total packets | Discarded packets |
| A | 0 | 24 | 0 |
| B | 0 | 24 | 0 |
| C | 0 | 24 | 0 |
| D | 0 | 24 | 0 |
| Mode SS | |||
|---|---|---|---|
| Quadrant | BADHDUFLAG | Total packets | Discarded packets |
| A | 0 | 530 | 0 |
| B | 0 | 530 | 0 |
| C | 0 | 530 | 0 |
| D | 0 | 530 | 0 |
| Quadrant | Total seconds | Saturated seconds | Saturation percentage |
|---|---|---|---|
| A | 26080 | 743 | 2.848926% |
| B | 26080 | 584 | 2.239264% |
| C | 26080 | 694 | 2.661043% |
| D | 26080 | 1689 | 6.476227% |
Noise dominated data is calculated using 1-second bins in cleaned event files. If a bin has >2000 counts, and if more than 50% of those come from <1% of pixels, then it is considered to be noise-dominated and hence unusable.
| Quadrant | # 1 sec bins | Bins with >0 counts | Bins with >2000 counts | High rate bins dominated by noise | Noise dominated (total time) | Noise dominated (detector-on time) | Marked lightcurve |
|---|---|---|---|---|---|---|---|
| A | 28465 | 26079 | 0 | 0 | 0.00% | 0.00% |  |
| B | 28465 | 26078 | 0 | 0 | 0.00% | 0.00% | 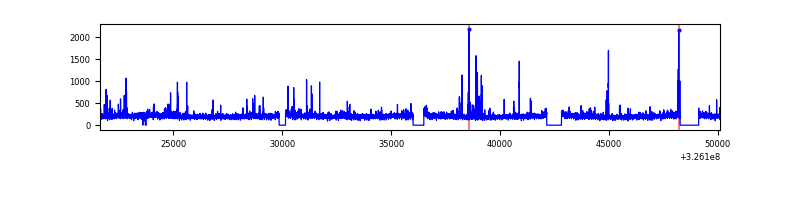 |
| C | 28464 | 26080 | 0 | 0 | 0.00% | 0.00% |  |
| D | 28465 | 26074 | 0 | 0 | 0.00% | 0.00% |  |
Top three noisy pixels from each quadrant. If the there are fewer than three noisy pixels in the level2.evt file, extra rows are filled as -1
| Pixel properties | Quadrant properties | ||||||
|---|---|---|---|---|---|---|---|
| Quadrant | DetID | PixID | Counts | Sigma | Mean | Median | Sigma |
| A | 0 | 29 | 1370 | 10.04 | 394 | 368 | 99.8 |
| A | 7 | 110 | 1232 | 8.66 | 394 | 368 | 99.8 |
| A | 9 | 19 | 1130 | 7.63 | 394 | 368 | 99.8 |
| B | 2 | 9 | 1241 | 11.03 | 387 | 368 | 79.1 |
| B | 2 | 8 | 1006 | 8.06 | 387 | 368 | 79.1 |
| B | 5 | 128 | 988 | 7.83 | 387 | 368 | 79.1 |
| C | 12 | 241 | 1035 | 6.68 | 388 | 360 | 101.0 |
| C | 3 | 158 | 1002 | 6.36 | 388 | 360 | 101.0 |
| C | 7 | 111 | 987 | 6.21 | 388 | 360 | 101.0 |
| D | 7 | 3 | 933 | 6.16 | 362 | 327 | 98.4 |
| D | 3 | 14 | 925 | 6.08 | 362 | 327 | 98.4 |
| D | 1 | 3 | 879 | 5.61 | 362 | 327 | 98.4 |
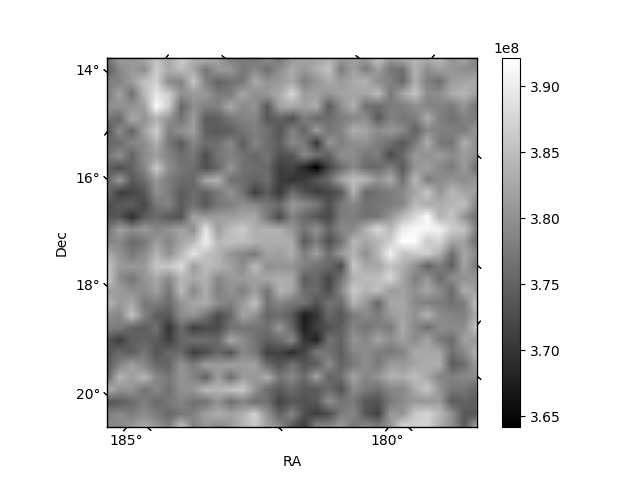
Histogram calculated using DETX and DETY for each event in the final _common_clean file
| Quadrant A |  |
 |
Quadrant B |
|---|---|---|---|
| Quadrant D |  |
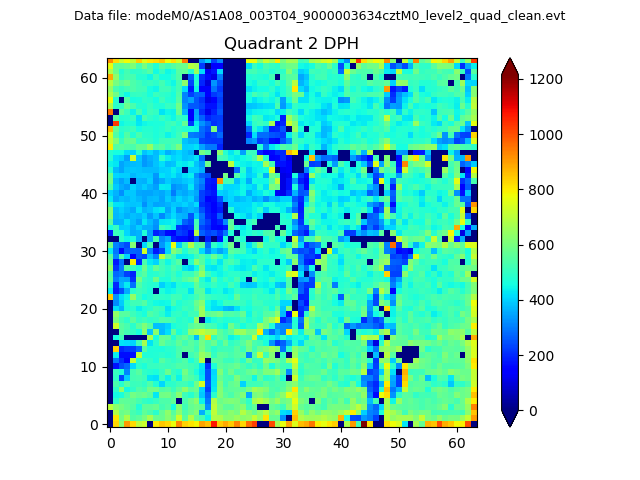 |
Quadrant C |
| Plot type | Count rate plots | Images |
|---|---|---|
| Comparison with Poisson distribution Blue bars denote a histogram of data divided into 1 sec bins. Red curve is a Poisson curve with rate = median count rate of data. |
 |
 |
| Quadrant-wise count rates Data is divided into 100 sec bins |
 |
|
| Module-wise count rates for Quadrant A Data is divided into 100 sec bins |
 |
 |
| Module-wise count rates for Quadrant B Data is divided into 100 sec bins |
 |
 |
| Module-wise count rates for Quadrant C Data is divided into 100 sec bins |
 |
 |
| Module-wise count rates for Quadrant D Data is divided into 100 sec bins |
 |
 |
| Parameter | Plot |
|---|---|
| CZT HV Monitor |  |
| D_VDD |  |
| Temperature 1 | 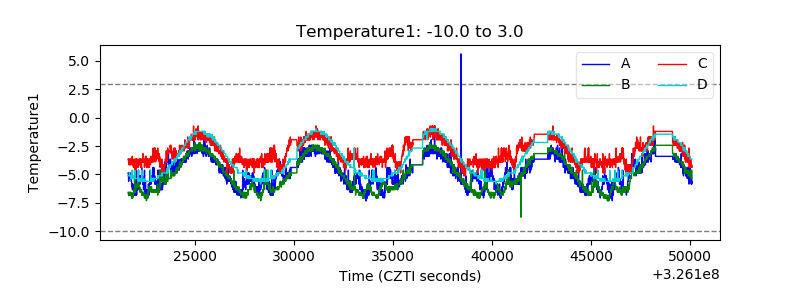 |
| Veto HV Monitor |  |
| Veto LLD |  |
| Alpha Counter |  |
| _CPM_Rate |  |
| CZT Counter |  |
| +2.5 Volts monitor | 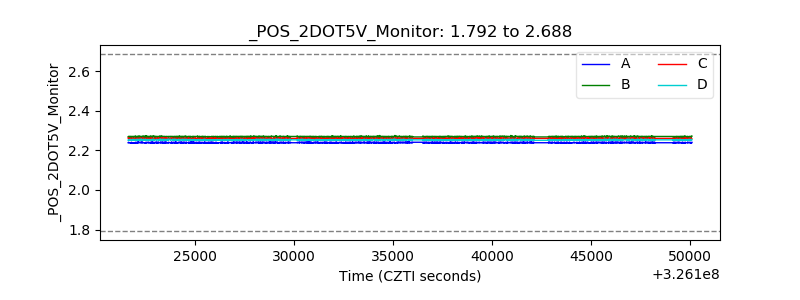 |
| +5 Volts monitor | 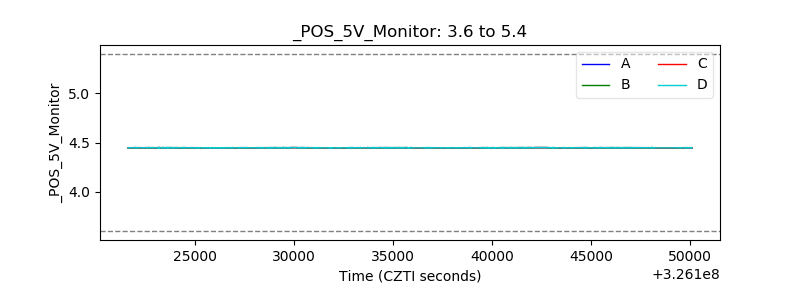 |
| _ROLL_ROT |  |
| _Roll_DEC | 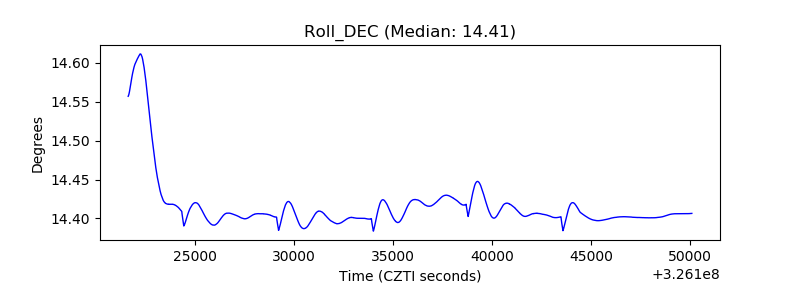 |
| _Roll_RA |  |
| Veto Counter |  |