| Param | Original file | Final file |
|---|---|---|
| Filename | modeM0/AS1A08_003T04_9000003634_24843cztM0_level2.evt | modeM0/AS1A08_003T04_9000003634_24843cztM0_level2_quad_clean.evt |
| Size (bytes) | 331,479,360 | 31,942,080 |
| Size | 316.1 MB | 30.5 MB |
| Events in quadrant A | 1,929,614 | 195,976 |
| Events in quadrant B | 1,991,009 | 199,118 |
| Events in quadrant C | 1,963,158 | 186,755 |
| Events in quadrant D | 3,901,946 | 122,653 |
| Mode M0 | |||
|---|---|---|---|
| Quadrant | BADHDUFLAG | Total packets | Discarded packets |
| A | 0 | 7927 | 2 |
| B | 0 | 8104 | 2 |
| C | 0 | 8001 | 2 |
| D | 0 | 13961 | 3 |
| Mode SS | |||
|---|---|---|---|
| Quadrant | BADHDUFLAG | Total packets | Discarded packets |
| A | 0 | 76 | 0 |
| B | 0 | 76 | 0 |
| C | 0 | 76 | 0 |
| D | 0 | 76 | 0 |
| Quadrant | Total seconds | Saturated seconds | Saturation percentage |
|---|---|---|---|
| A | 3694 | 259 | 7.011370% |
| B | 3694 | 291 | 7.877639% |
| C | 3694 | 281 | 7.606930% |
| D | 3693 | 1100 | 29.786082% |
Noise dominated data is calculated using 1-second bins in cleaned event files. If a bin has >2000 counts, and if more than 50% of those come from <1% of pixels, then it is considered to be noise-dominated and hence unusable.
| Quadrant | # 1 sec bins | Bins with >0 counts | Bins with >2000 counts | High rate bins dominated by noise | Noise dominated (total time) | Noise dominated (detector-on time) | Marked lightcurve |
|---|---|---|---|---|---|---|---|
| A | 3754 | 3696 | 0 | 0 | 0.00% | 0.00% | 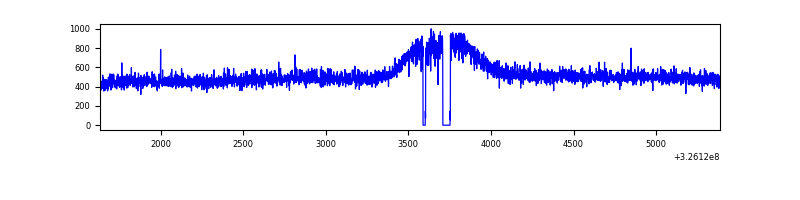 |
| B | 3754 | 3696 | 0 | 0 | 0.00% | 0.00% | 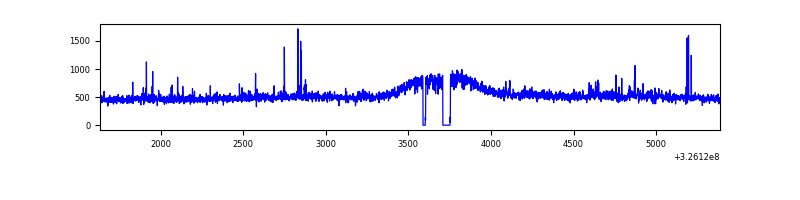 |
| C | 3754 | 3696 | 0 | 0 | 0.00% | 0.00% | 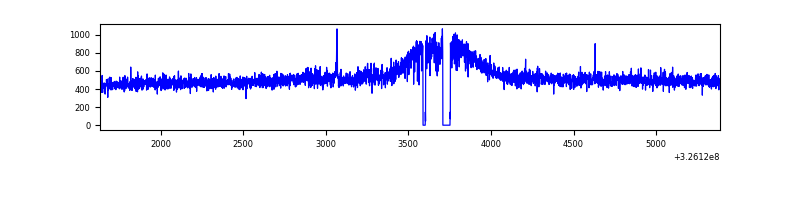 |
| D | 3753 | 3695 | 844 | 844 | 22.49% | 22.84% | 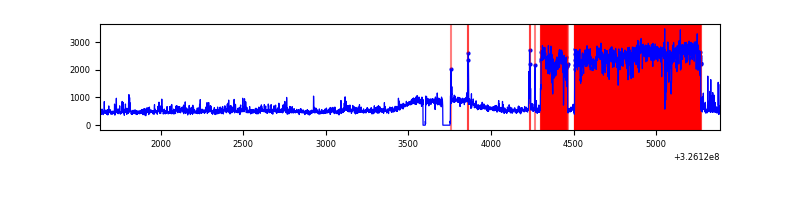 |
Top three noisy pixels from each quadrant. If the there are fewer than three noisy pixels in the level2.evt file, extra rows are filled as -1
| Pixel properties | Quadrant properties | ||||||
|---|---|---|---|---|---|---|---|
| Quadrant | DetID | PixID | Counts | Sigma | Mean | Median | Sigma |
| A | 13 | 254 | 5233 | 45.75 | 500 | 487 | 103.7 |
| A | 3 | 137 | 5072 | 44.2 | 500 | 487 | 103.7 |
| A | 0 | 226 | 4269 | 36.46 | 500 | 487 | 103.7 |
| B | 0 | 189 | 22448 | 221.7 | 495 | 482 | 99.1 |
| B | 12 | 111 | 12529 | 121.59 | 495 | 482 | 99.1 |
| B | 11 | 111 | 11763 | 113.86 | 495 | 482 | 99.1 |
| C | 14 | 238 | 73944 | 645.63 | 476 | 477 | 113.8 |
| C | 2 | 16 | 14834 | 126.17 | 476 | 477 | 113.8 |
| C | 8 | 128 | 8620 | 71.56 | 476 | 477 | 113.8 |
| D | 1 | 52 | 2054845 | 19110.13 | 433 | 418 | 107.5 |
| D | 8 | 195 | 167989 | 1558.73 | 433 | 418 | 107.5 |
| D | 5 | 222 | 25190 | 230.42 | 433 | 418 | 107.5 |
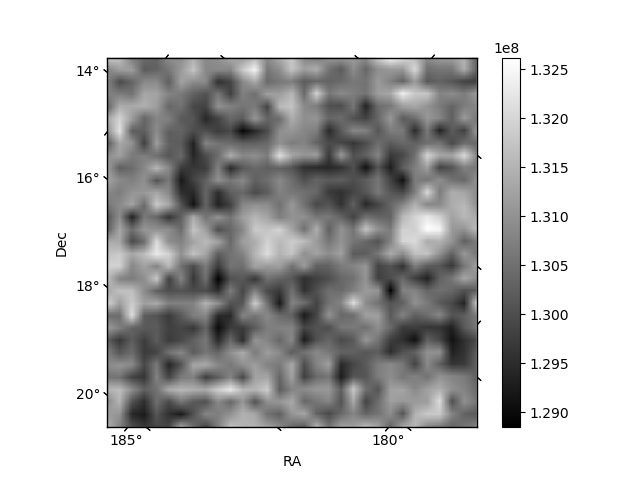
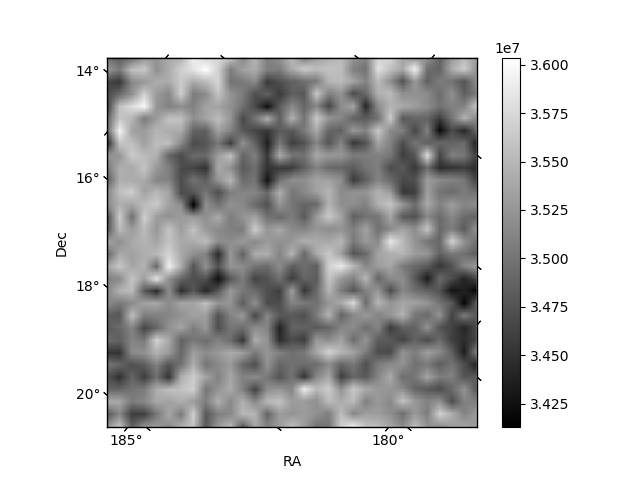
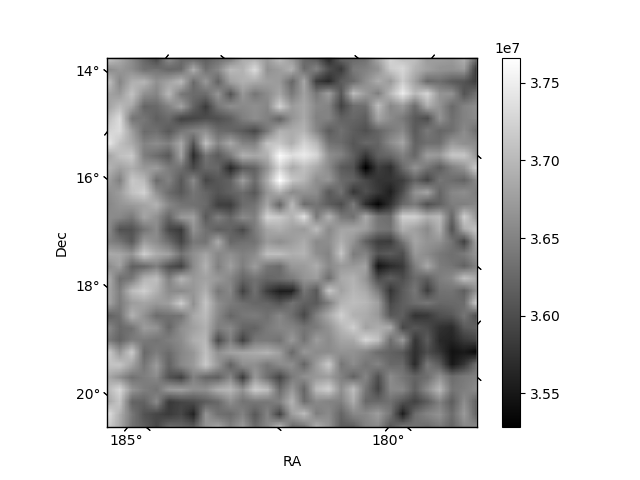
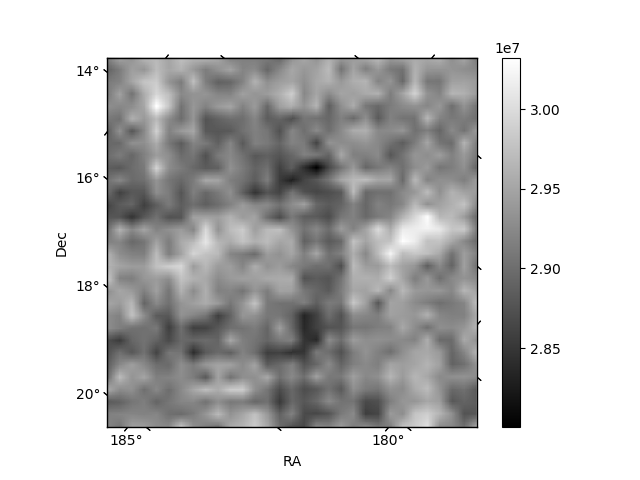
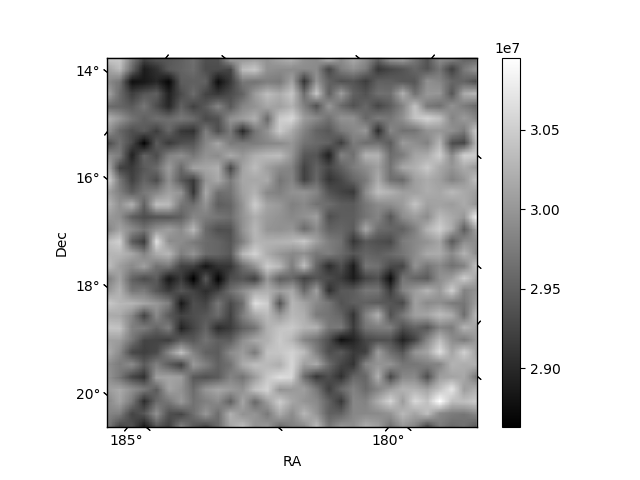
Histogram calculated using DETX and DETY for each event in the final _common_clean file
| Quadrant A | 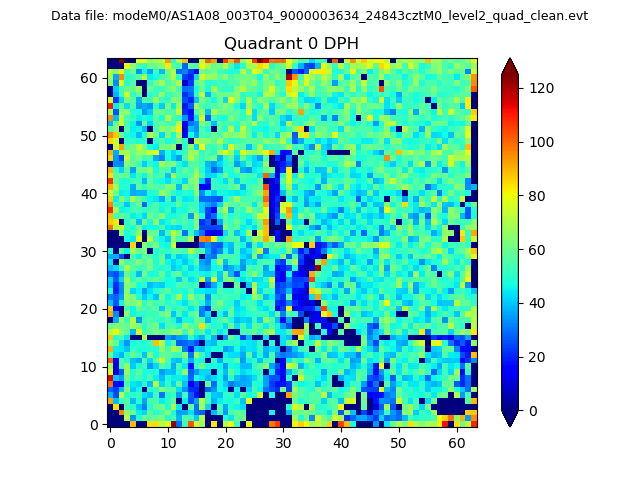 |
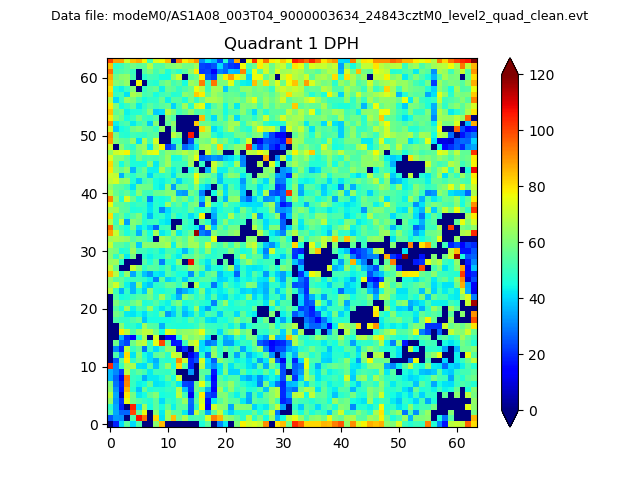 |
Quadrant B |
|---|---|---|---|
| Quadrant D |  |
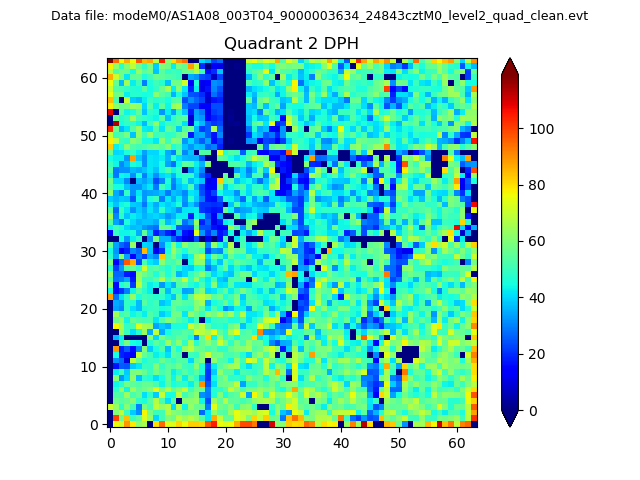 |
Quadrant C |
| Plot type | Count rate plots | Images |
|---|---|---|
| Comparison with Poisson distribution Blue bars denote a histogram of data divided into 1 sec bins. Red curve is a Poisson curve with rate = median count rate of data. |
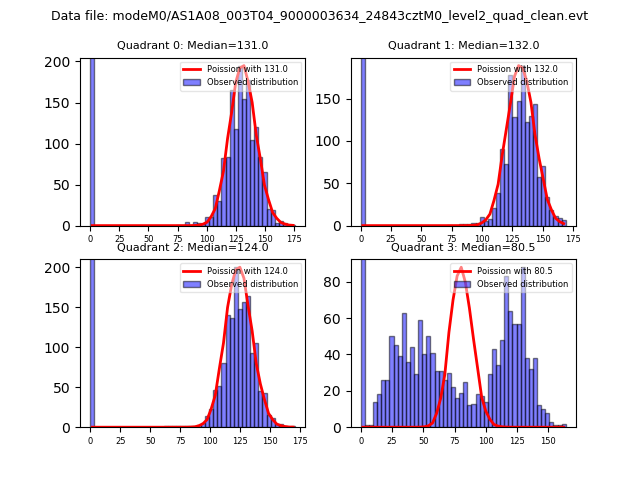 |
 |
| Quadrant-wise count rates Data is divided into 100 sec bins |
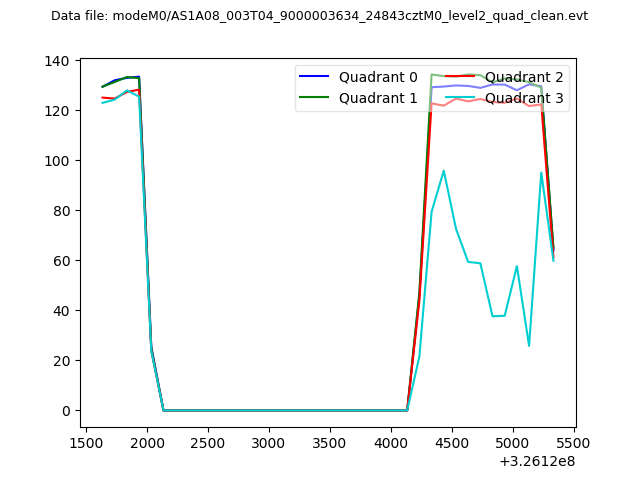 |
|
| Module-wise count rates for Quadrant A Data is divided into 100 sec bins |
 |
 |
| Module-wise count rates for Quadrant B Data is divided into 100 sec bins |
 |
 |
| Module-wise count rates for Quadrant C Data is divided into 100 sec bins |
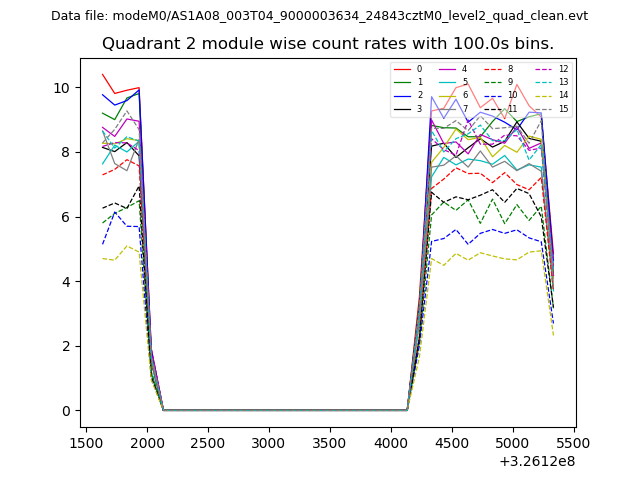 |
 |
| Module-wise count rates for Quadrant D Data is divided into 100 sec bins |
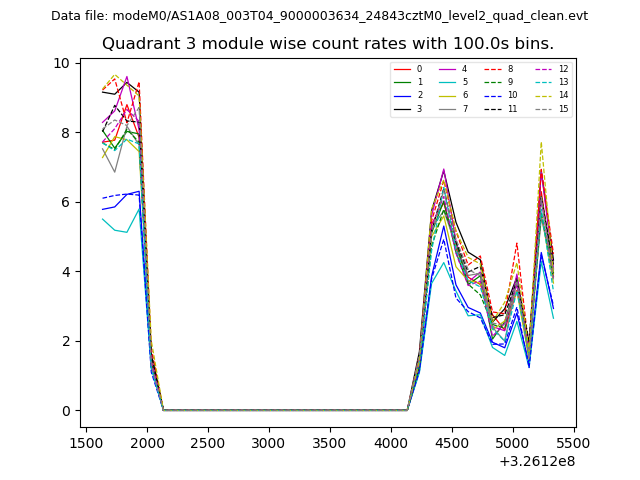 |
 |
| Parameter | Plot |
|---|---|
| CZT HV Monitor |  |
| D_VDD | 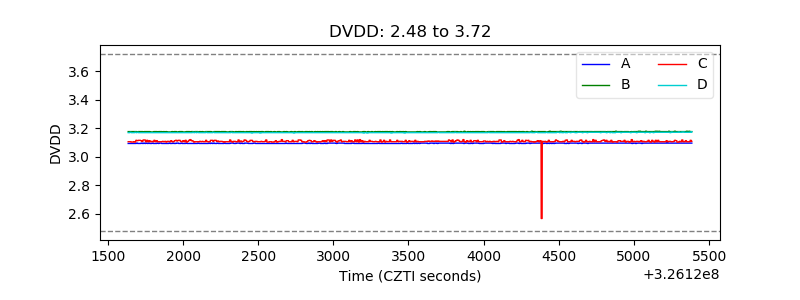 |
| Temperature 1 | 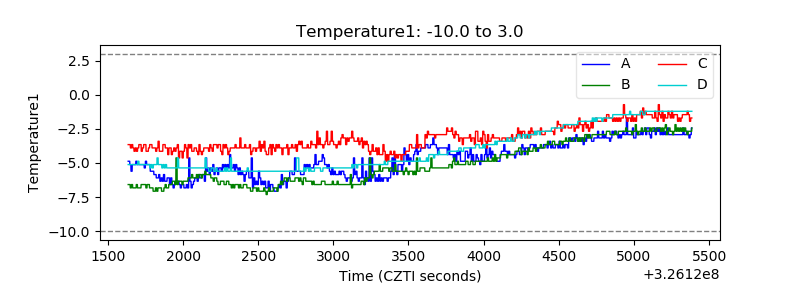 |
| Veto HV Monitor | 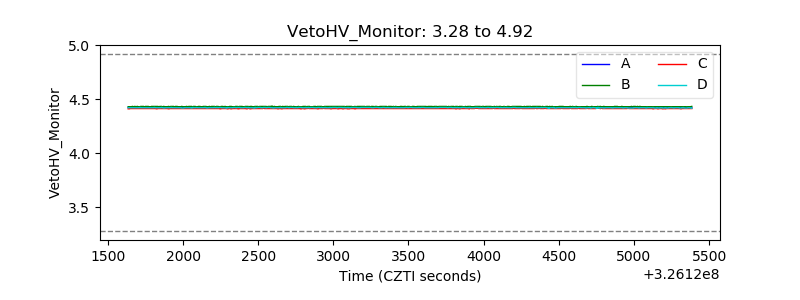 |
| Veto LLD |  |
| Alpha Counter | 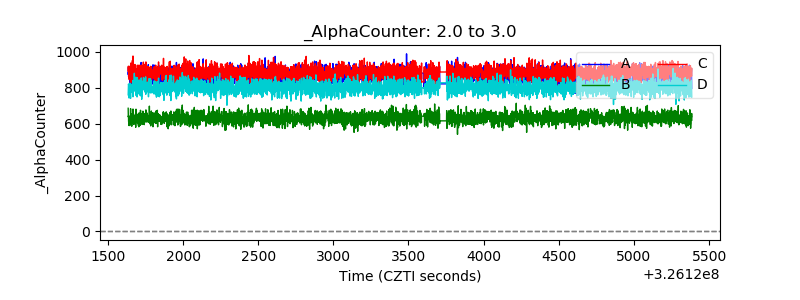 |
| _CPM_Rate | 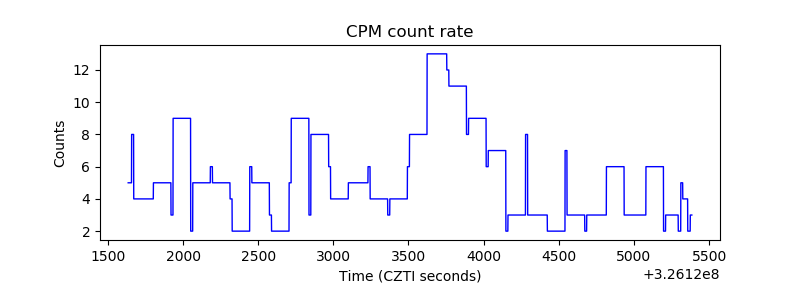 |
| CZT Counter | 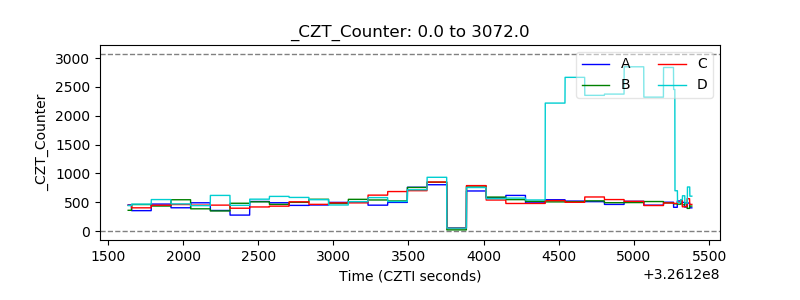 |
| +2.5 Volts monitor |  |
| +5 Volts monitor |  |
| _ROLL_ROT | 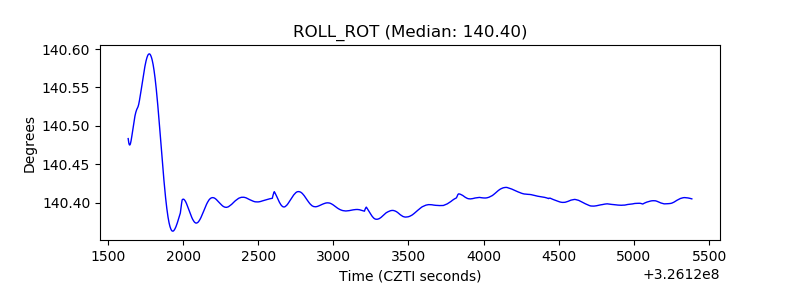 |
| _Roll_DEC | 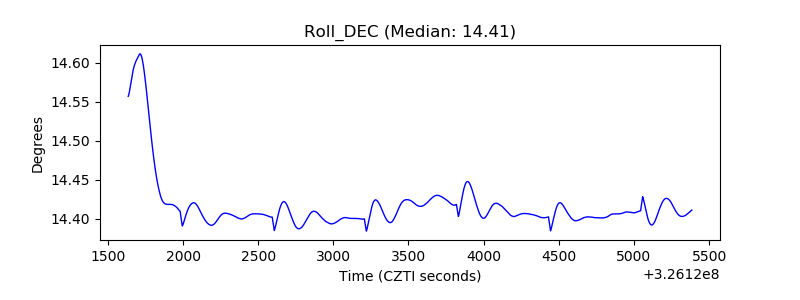 |
| _Roll_RA | 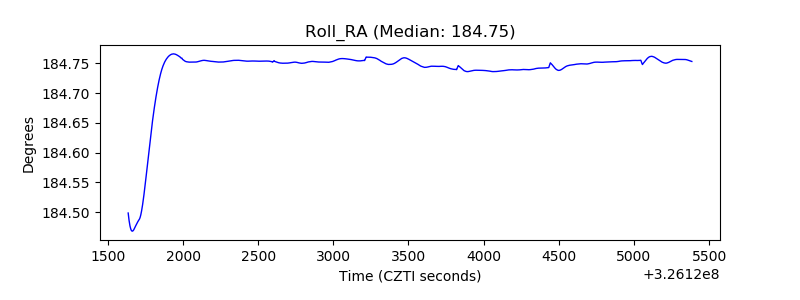 |
| Veto Counter | 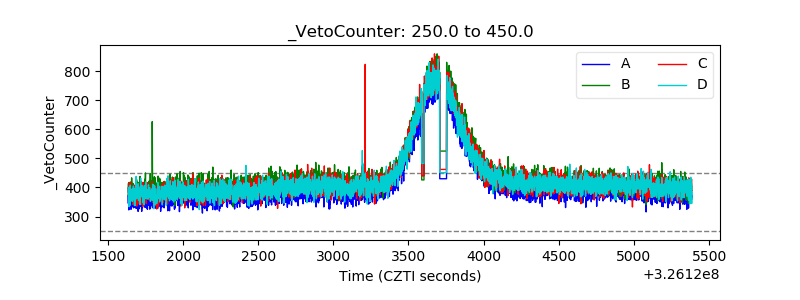 |