| Param | Original file | Final file |
|---|---|---|
| Filename | modeM0/AS1A08_003T04_9000003634_24844cztM0_level2.evt | modeM0/AS1A08_003T04_9000003634_24844cztM0_level2_quad_clean.evt |
| Size (bytes) | 547,721,280 | 95,388,480 |
| Size | 522.3 MB | 91.0 MB |
| Events in quadrant A | 3,357,013 | 632,967 |
| Events in quadrant B | 3,391,663 | 639,946 |
| Events in quadrant C | 3,333,067 | 603,822 |
| Events in quadrant D | 6,037,250 | 530,601 |
| Mode M0 | |||
|---|---|---|---|
| Quadrant | BADHDUFLAG | Total packets | Discarded packets |
| A | 0 | 14328 | 1 |
| B | 0 | 14431 | 1 |
| C | 0 | 14226 | 1 |
| D | 0 | 22551 | 3 |
| Mode M9 | |||
|---|---|---|---|
| Quadrant | BADHDUFLAG | Total packets | Discarded packets |
| A | 0 | 3 | 0 |
| B | 0 | 3 | 0 |
| C | 0 | 3 | 0 |
| D | 0 | 3 | 0 |
| Mode SS | |||
|---|---|---|---|
| Quadrant | BADHDUFLAG | Total packets | Discarded packets |
| A | 0 | 140 | 0 |
| B | 0 | 140 | 0 |
| C | 0 | 140 | 0 |
| D | 0 | 140 | 0 |
| Quadrant | Total seconds | Saturated seconds | Saturation percentage |
|---|---|---|---|
| A | 6905 | 103 | 1.491673% |
| B | 6906 | 124 | 1.795540% |
| C | 6906 | 130 | 1.882421% |
| D | 6905 | 1051 | 15.220854% |
Noise dominated data is calculated using 1-second bins in cleaned event files. If a bin has >2000 counts, and if more than 50% of those come from <1% of pixels, then it is considered to be noise-dominated and hence unusable.
| Quadrant | # 1 sec bins | Bins with >0 counts | Bins with >2000 counts | High rate bins dominated by noise | Noise dominated (total time) | Noise dominated (detector-on time) | Marked lightcurve |
|---|---|---|---|---|---|---|---|
| A | 7200 | 6906 | 5 | 5 | 0.07% | 0.07% | 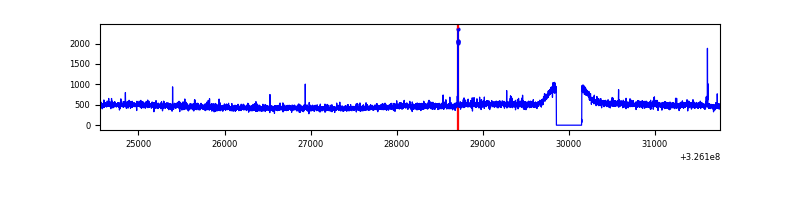 |
| B | 7201 | 6907 | 0 | 0 | 0.00% | 0.00% | 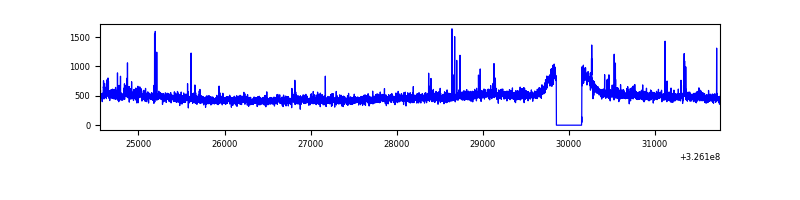 |
| C | 7201 | 6907 | 0 | 0 | 0.00% | 0.00% | 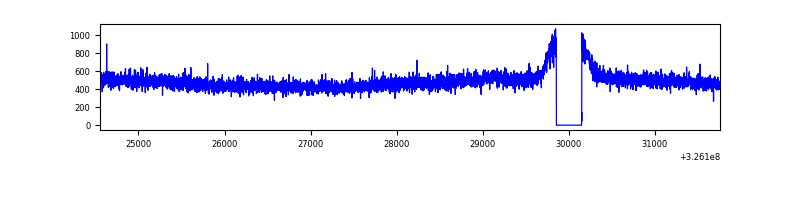 |
| D | 7200 | 6906 | 992 | 992 | 13.78% | 14.36% | 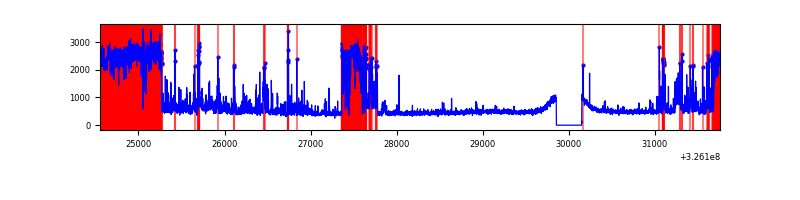 |
Top three noisy pixels from each quadrant. If the there are fewer than three noisy pixels in the level2.evt file, extra rows are filled as -1
| Pixel properties | Quadrant properties | ||||||
|---|---|---|---|---|---|---|---|
| Quadrant | DetID | PixID | Counts | Sigma | Mean | Median | Sigma |
| A | 6 | 16 | 50893 | 285.95 | 856 | 837 | 175.1 |
| A | 13 | 254 | 10010 | 52.4 | 856 | 837 | 175.1 |
| A | 3 | 137 | 8183 | 41.96 | 856 | 837 | 175.1 |
| B | 0 | 189 | 32584 | 191.94 | 845 | 823 | 165.5 |
| B | 12 | 111 | 20436 | 118.53 | 845 | 823 | 165.5 |
| B | 11 | 111 | 18735 | 108.25 | 845 | 823 | 165.5 |
| C | 14 | 238 | 128558 | 662.39 | 816 | 818 | 192.8 |
| C | 8 | 128 | 11443 | 55.1 | 816 | 818 | 192.8 |
| C | 8 | 112 | 5965 | 26.69 | 816 | 818 | 192.8 |
| D | 1 | 52 | 2755782 | 14352.52 | 778 | 754 | 192.0 |
| D | 8 | 195 | 194226 | 1007.91 | 778 | 754 | 192.0 |
| D | 5 | 222 | 54621 | 280.62 | 778 | 754 | 192.0 |
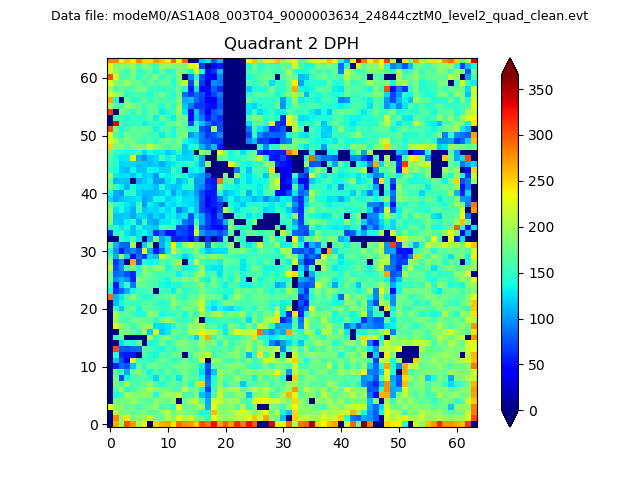
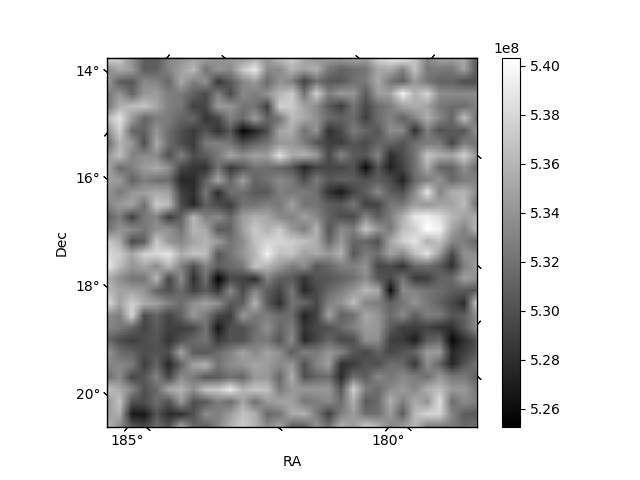
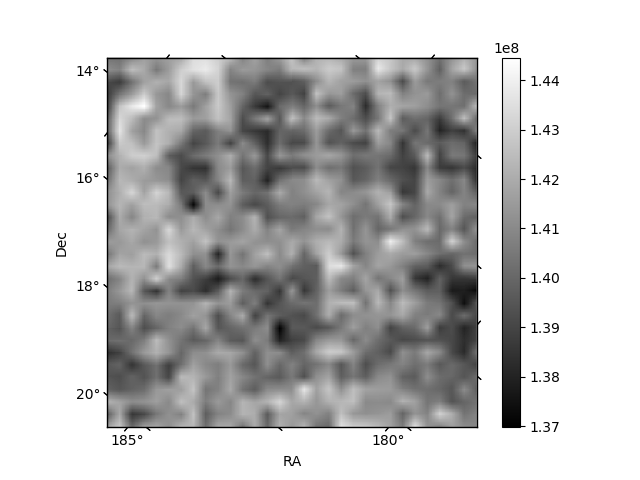
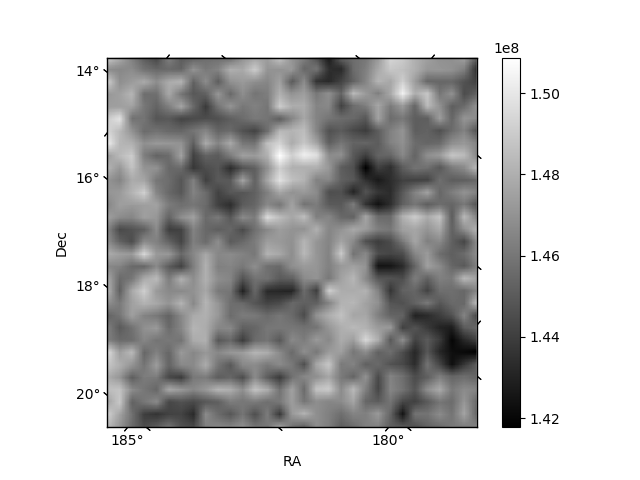
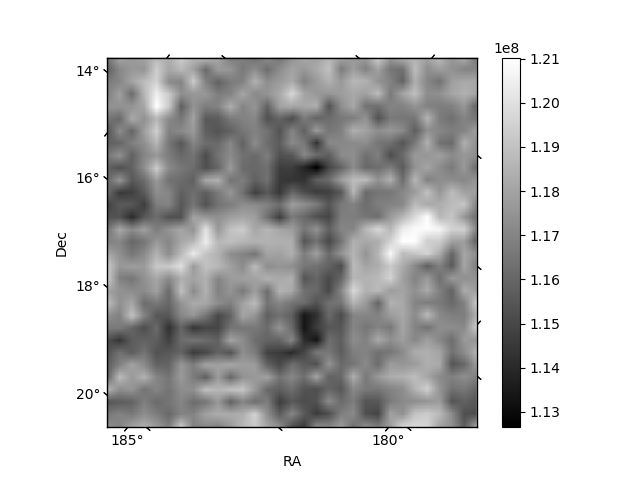
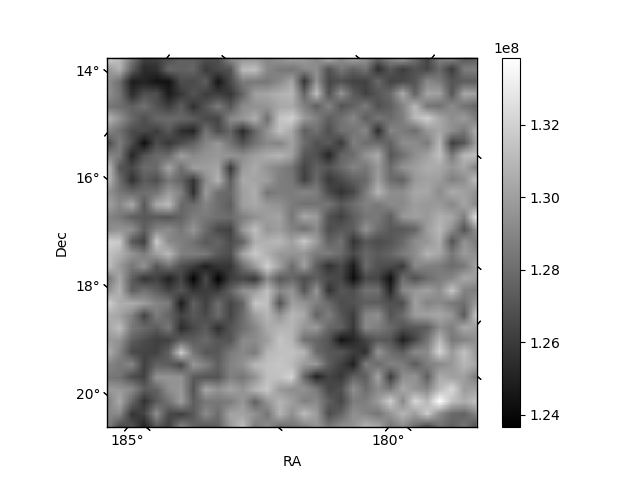
Histogram calculated using DETX and DETY for each event in the final _common_clean file
| Quadrant A | 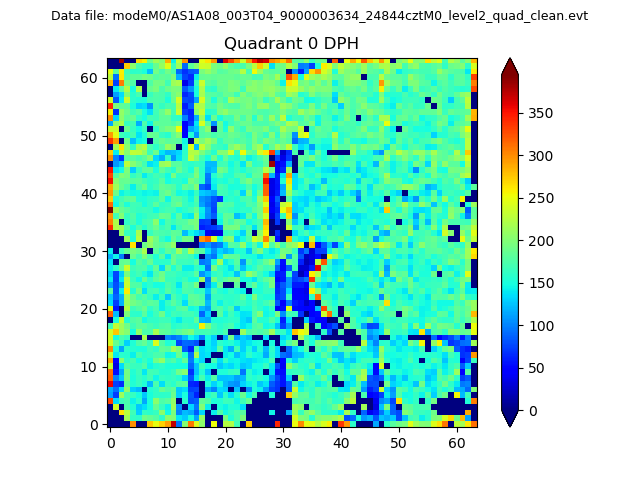 |
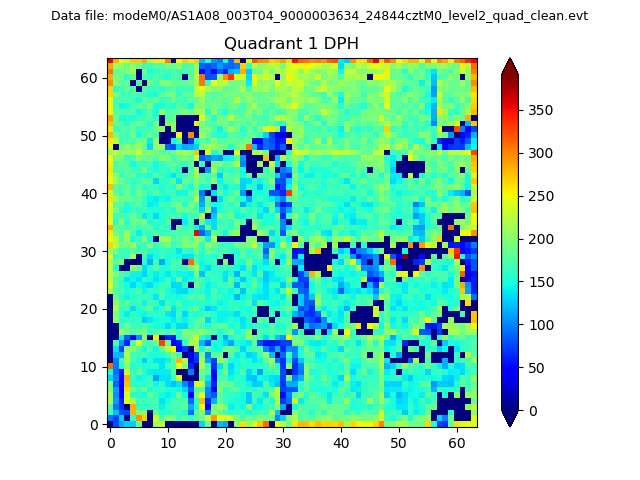 |
Quadrant B |
|---|---|---|---|
| Quadrant D | 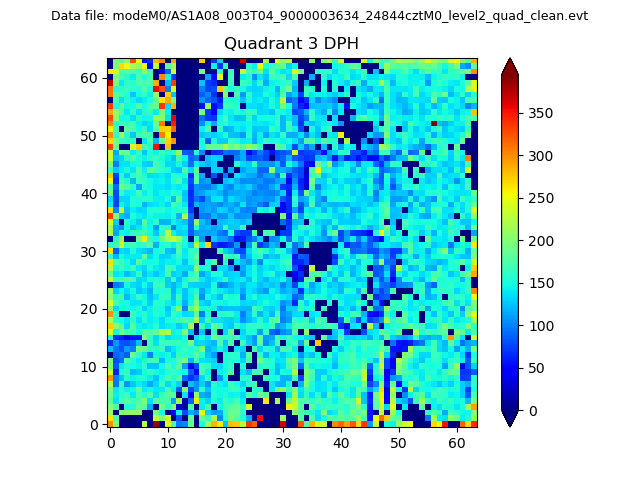 |
 |
Quadrant C |
| Plot type | Count rate plots | Images |
|---|---|---|
| Comparison with Poisson distribution Blue bars denote a histogram of data divided into 1 sec bins. Red curve is a Poisson curve with rate = median count rate of data. |
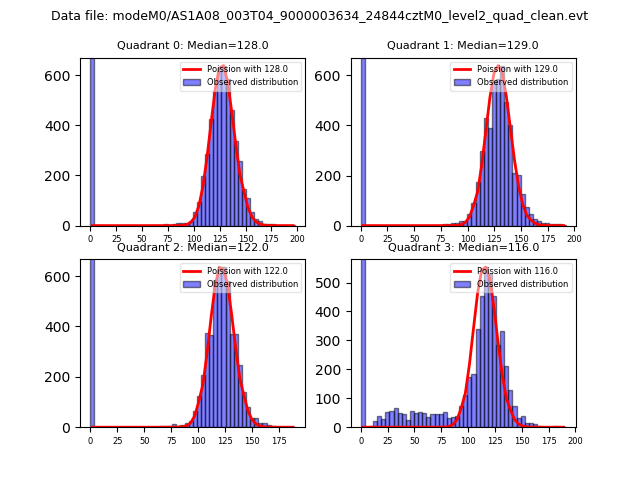 |
 |
| Quadrant-wise count rates Data is divided into 100 sec bins |
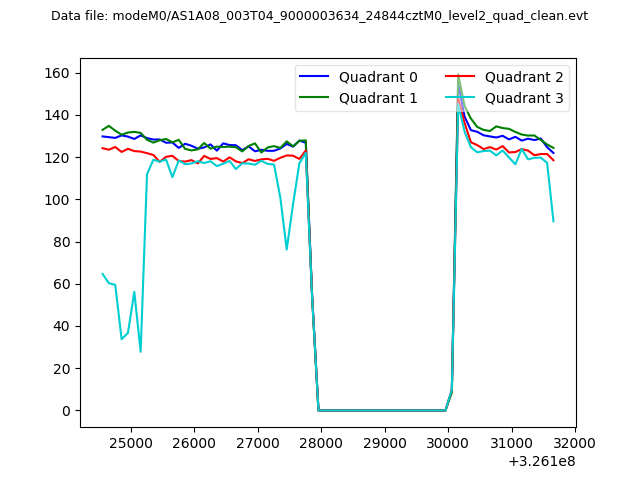 |
|
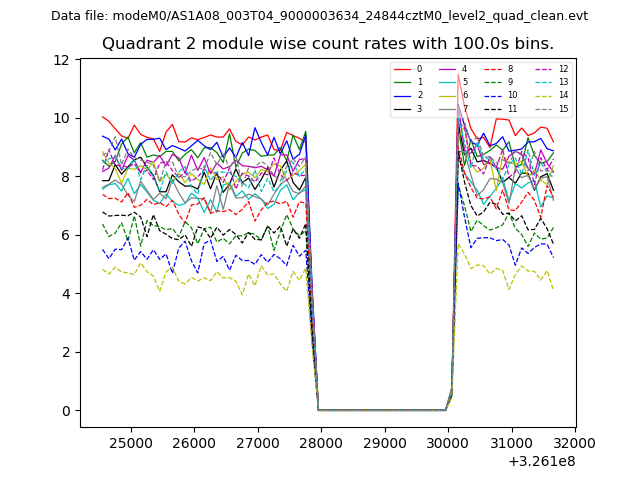
| Module-wise count rates for Quadrant A Data is divided into 100 sec bins |
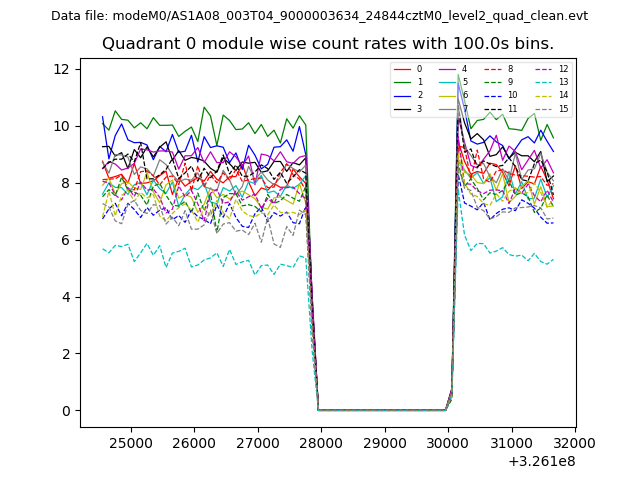 |
 |
| Module-wise count rates for Quadrant B Data is divided into 100 sec bins |
 |
 |
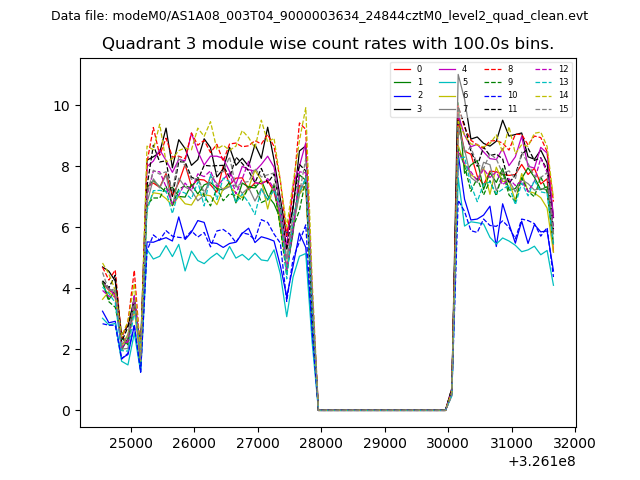
| Module-wise count rates for Quadrant C Data is divided into 100 sec bins |
 |
 |
| Module-wise count rates for Quadrant D Data is divided into 100 sec bins |
 |
 |
| Parameter | Plot |
|---|---|
| CZT HV Monitor | 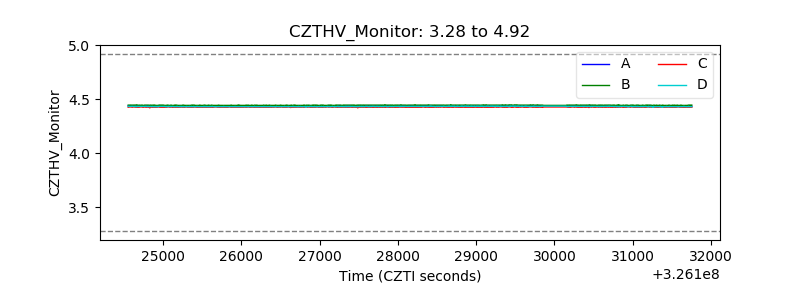 |
| D_VDD | 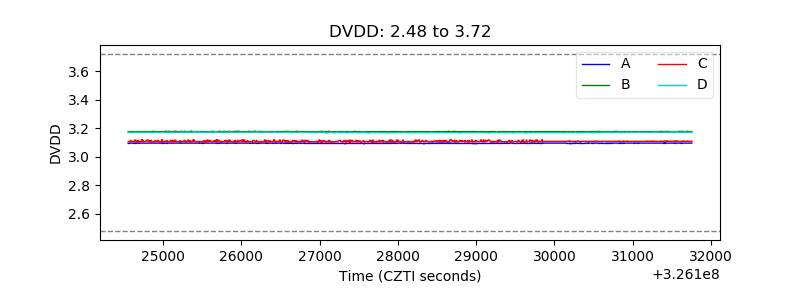 |
| Temperature 1 | 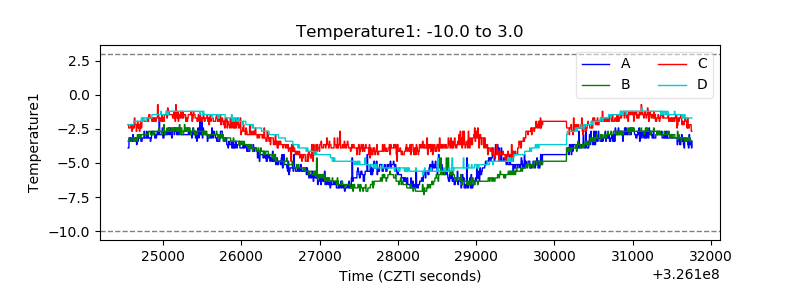 |
| Veto HV Monitor | 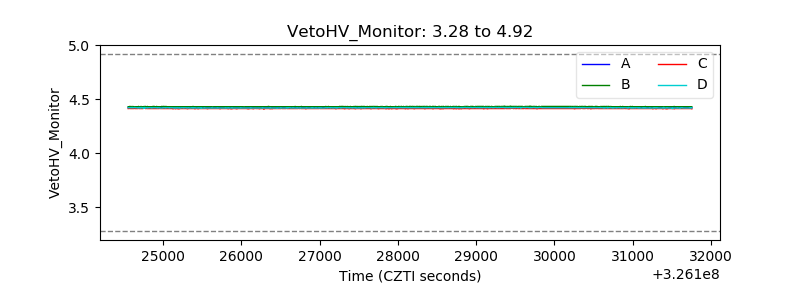 |
| Veto LLD | 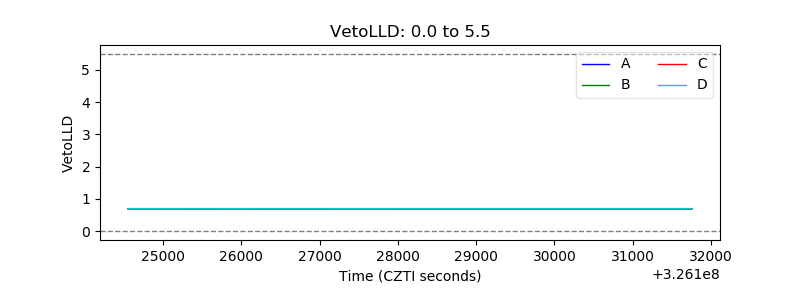 |
| Alpha Counter | 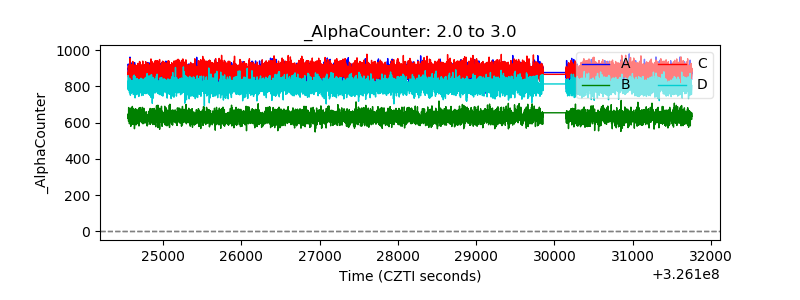 |
| _CPM_Rate | 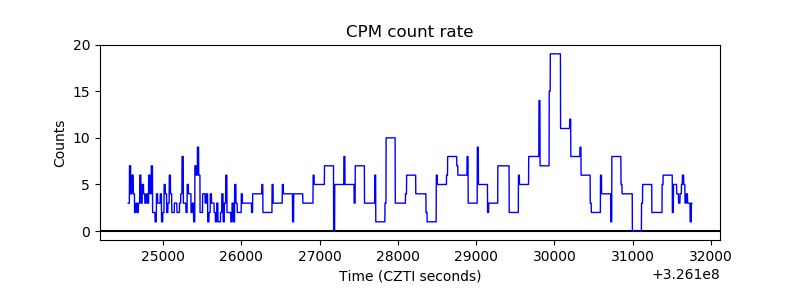 |
| CZT Counter |  |
| +2.5 Volts monitor | 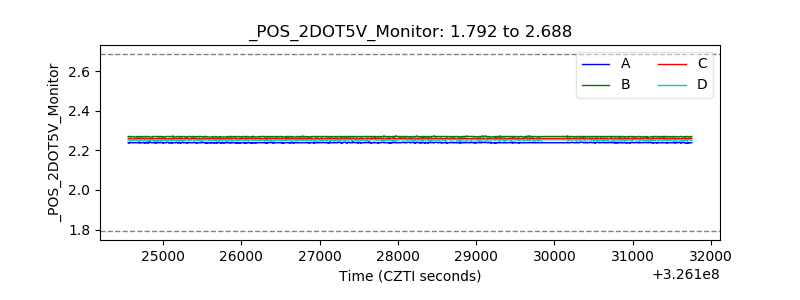 |
| +5 Volts monitor | 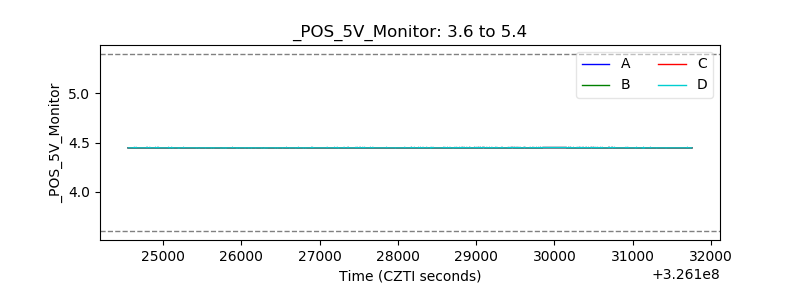 |
| _ROLL_ROT | 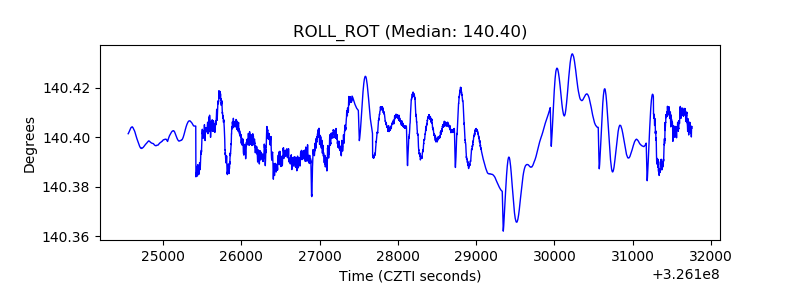 |
| _Roll_DEC | 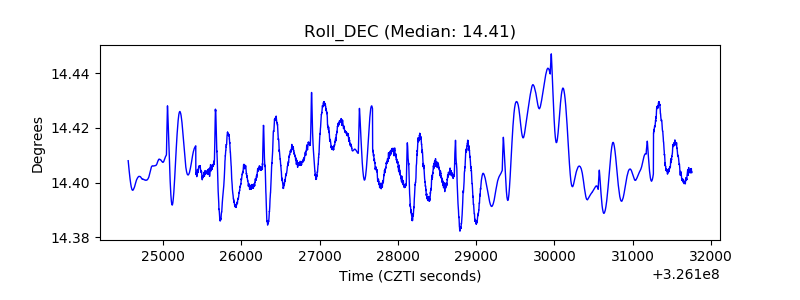 |
| _Roll_RA | 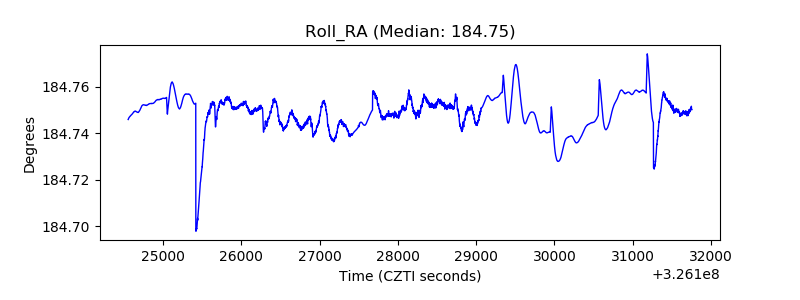 |
| Veto Counter | 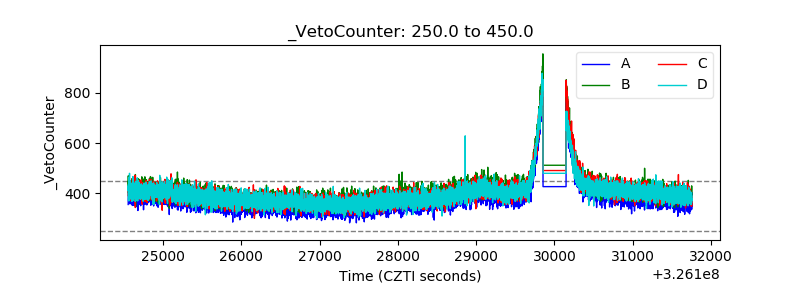 |