| Param | Original file | Final file |
|---|---|---|
| Filename | modeM0/AS1A08_003T04_9000003634_24847cztM0_level2.evt | modeM0/AS1A08_003T04_9000003634_24847cztM0_level2_quad_clean.evt |
| Size (bytes) | 1,228,383,360 | 214,902,720 |
| Size | 1.1 GB | 204.9 MB |
| Events in quadrant A | 9,732,123 | 1,351,173 |
| Events in quadrant B | 8,375,440 | 1,371,727 |
| Events in quadrant C | 8,860,496 | 1,303,426 |
| Events in quadrant D | 9,056,460 | 1,281,700 |
| Mode M0 | |||
|---|---|---|---|
| Quadrant | BADHDUFLAG | Total packets | Discarded packets |
| A | 0 | 40241 | 3 |
| B | 0 | 36142 | 3 |
| C | 0 | 37598 | 3 |
| D | 0 | 38828 | 3 |
| Mode M9 | |||
|---|---|---|---|
| Quadrant | BADHDUFLAG | Total packets | Discarded packets |
| A | 0 | 21 | 0 |
| B | 0 | 21 | 0 |
| C | 0 | 21 | 0 |
| D | 0 | 21 | 0 |
| Mode SS | |||
|---|---|---|---|
| Quadrant | BADHDUFLAG | Total packets | Discarded packets |
| A | 0 | 354 | 0 |
| B | 0 | 354 | 0 |
| C | 0 | 354 | 0 |
| D | 0 | 354 | 0 |
| Quadrant | Total seconds | Saturated seconds | Saturation percentage |
|---|---|---|---|
| A | 17413 | 384 | 2.205249% |
| B | 17414 | 169 | 0.970484% |
| C | 17414 | 293 | 1.682554% |
| D | 17414 | 327 | 1.877799% |
Noise dominated data is calculated using 1-second bins in cleaned event files. If a bin has >2000 counts, and if more than 50% of those come from <1% of pixels, then it is considered to be noise-dominated and hence unusable.
| Quadrant | # 1 sec bins | Bins with >0 counts | Bins with >2000 counts | High rate bins dominated by noise | Noise dominated (total time) | Noise dominated (detector-on time) | Marked lightcurve |
|---|---|---|---|---|---|---|---|
| A | 19443 | 17416 | 337 | 337 | 1.73% | 1.94% | 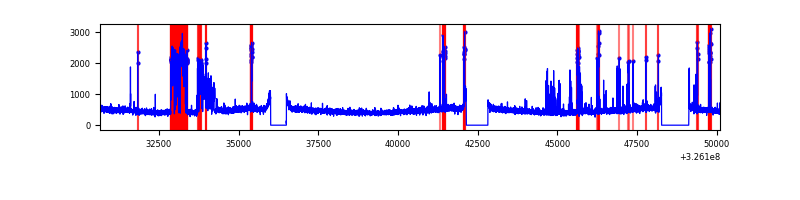 |
| B | 19444 | 17417 | 5 | 5 | 0.03% | 0.03% | 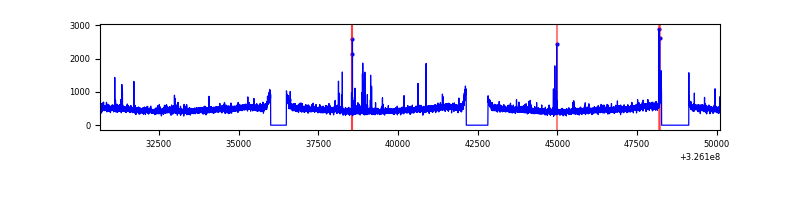 |
| C | 19444 | 17417 | 11 | 11 | 0.06% | 0.06% | 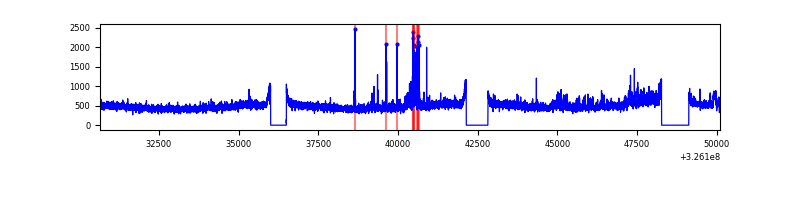 |
| D | 19444 | 17417 | 216 | 216 | 1.11% | 1.24% | 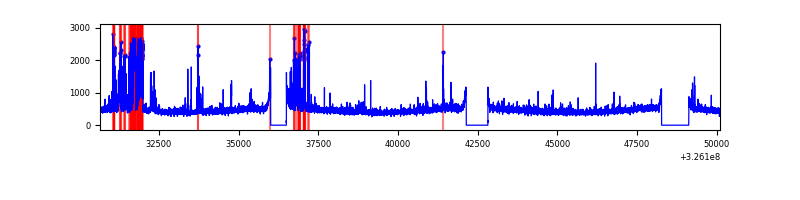 |
Top three noisy pixels from each quadrant. If the there are fewer than three noisy pixels in the level2.evt file, extra rows are filled as -1
| Pixel properties | Quadrant properties | ||||||
|---|---|---|---|---|---|---|---|
| Quadrant | DetID | PixID | Counts | Sigma | Mean | Median | Sigma |
| A | 6 | 16 | 1619163 | 3825.18 | 2101 | 2055 | 422.8 |
| A | 13 | 254 | 25506 | 55.47 | 2101 | 2055 | 422.8 |
| A | 3 | 137 | 19964 | 42.36 | 2101 | 2055 | 422.8 |
| B | 4 | 80 | 74474 | 180.37 | 2090 | 2035 | 401.6 |
| B | 0 | 189 | 64202 | 154.8 | 2090 | 2035 | 401.6 |
| B | 12 | 111 | 51419 | 122.97 | 2090 | 2035 | 401.6 |
| C | 7 | 247 | 445950 | 939.76 | 2014 | 2029 | 472.4 |
| C | 14 | 238 | 318855 | 670.7 | 2014 | 2029 | 472.4 |
| C | 2 | 16 | 243429 | 511.03 | 2014 | 2029 | 472.4 |
| D | 1 | 52 | 875134 | 1761.0 | 2041 | 1987 | 495.8 |
| D | 12 | 218 | 210690 | 420.92 | 2041 | 1987 | 495.8 |
| D | 8 | 195 | 161743 | 322.2 | 2041 | 1987 | 495.8 |
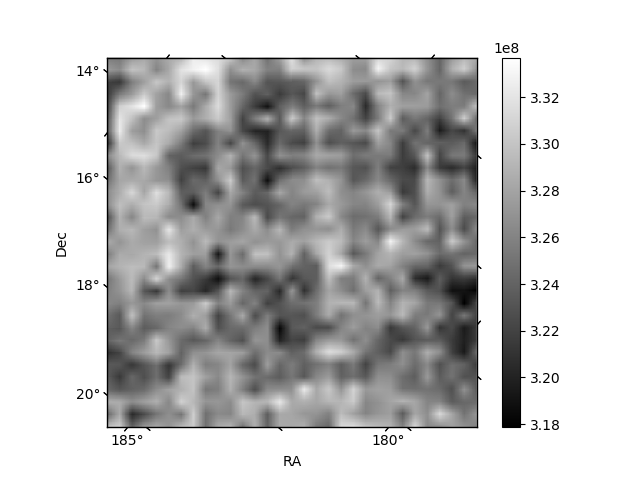
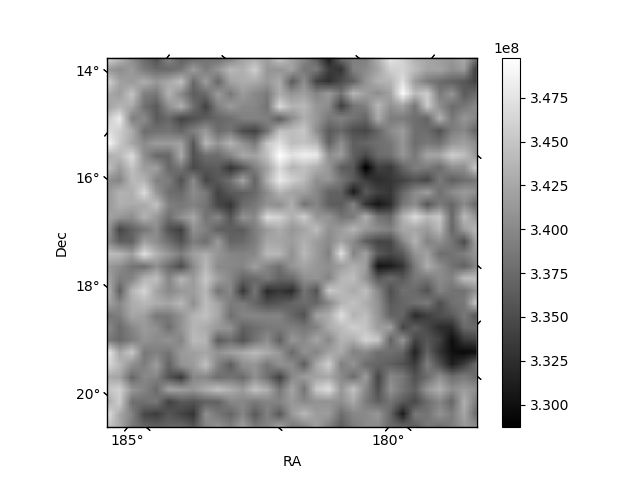
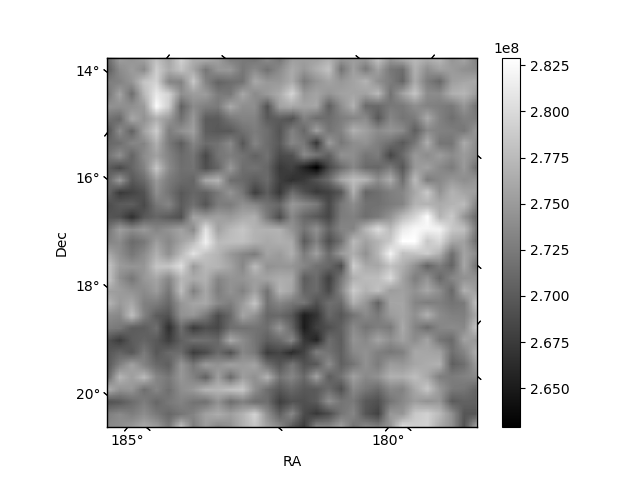
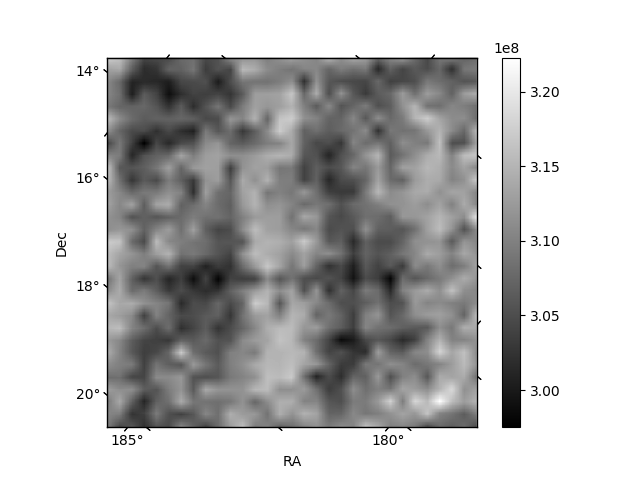
Histogram calculated using DETX and DETY for each event in the final _common_clean file
| Quadrant A | 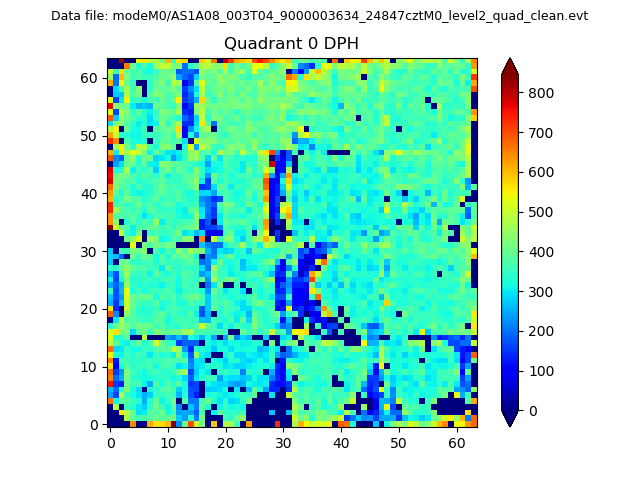 |
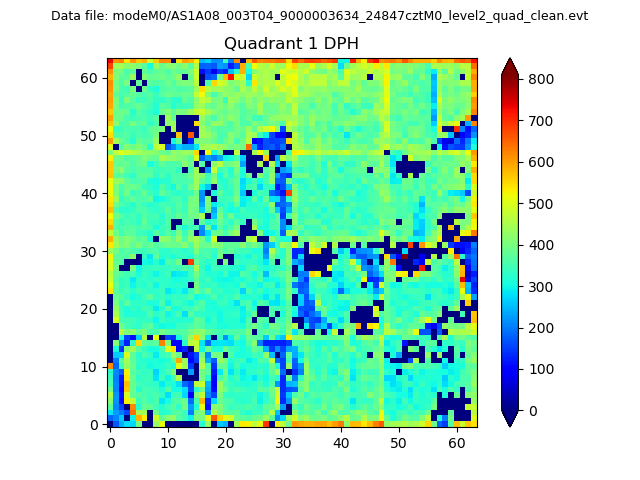 |
Quadrant B |
|---|---|---|---|
| Quadrant D |  |
 |
Quadrant C |
| Plot type | Count rate plots | Images |
|---|---|---|
| Comparison with Poisson distribution Blue bars denote a histogram of data divided into 1 sec bins. Red curve is a Poisson curve with rate = median count rate of data. |
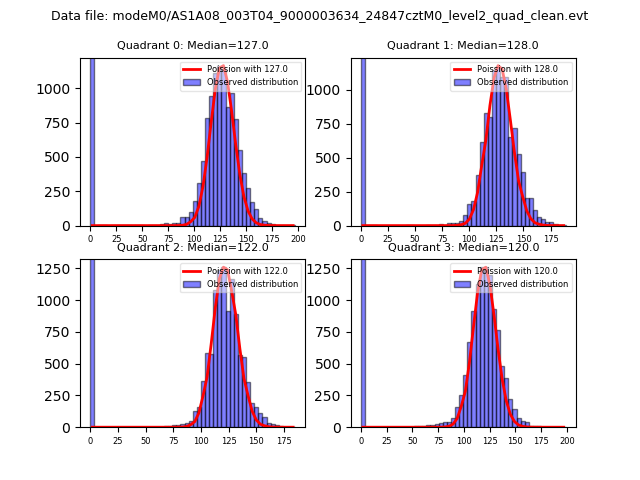 |
 |
| Quadrant-wise count rates Data is divided into 100 sec bins |
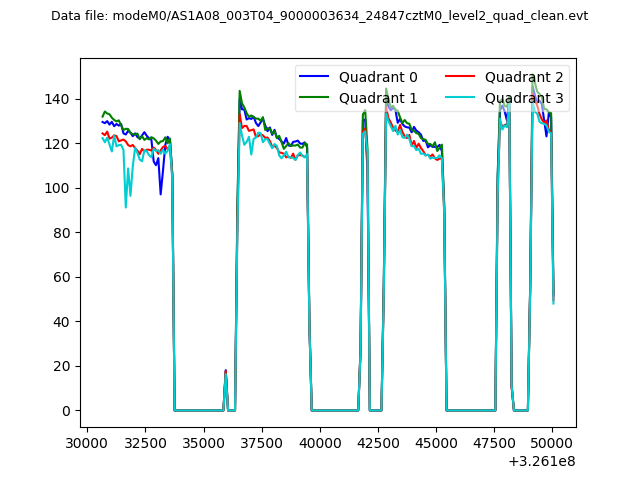 |
|
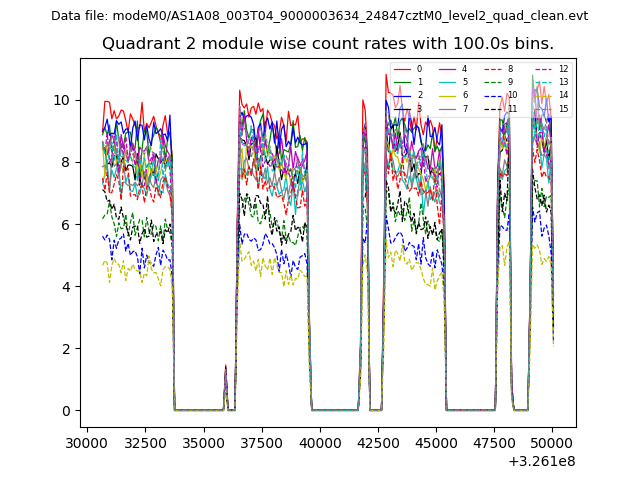
| Module-wise count rates for Quadrant A Data is divided into 100 sec bins |
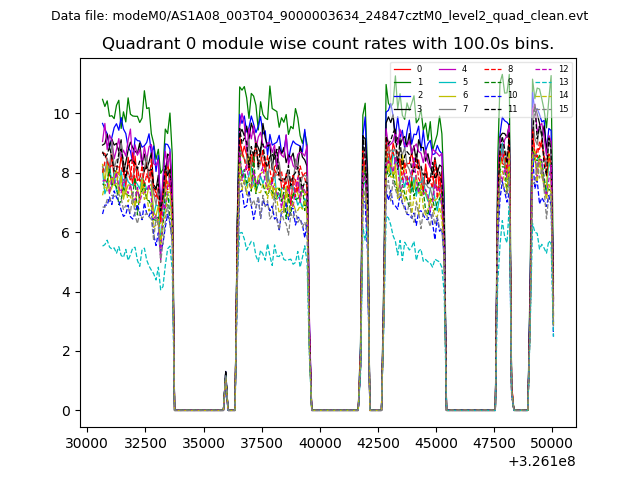 |
 |
| Module-wise count rates for Quadrant B Data is divided into 100 sec bins |
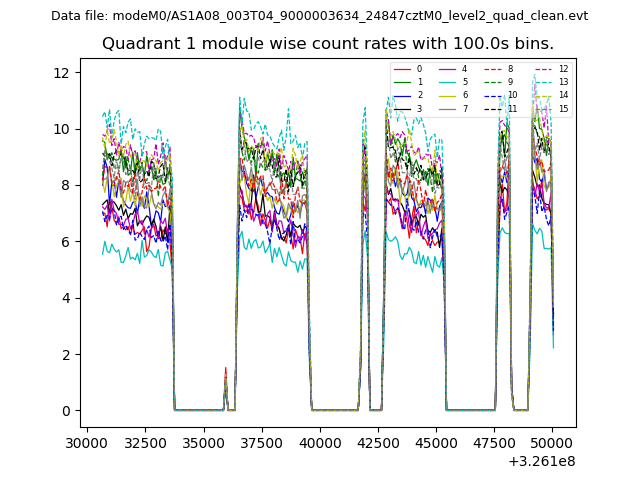 |
 |
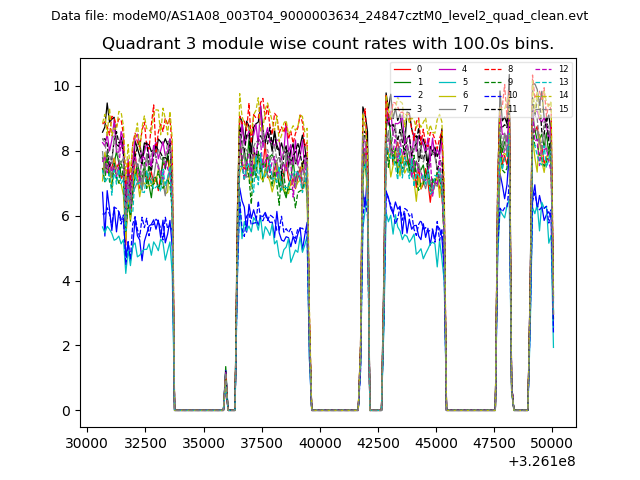
| Module-wise count rates for Quadrant C Data is divided into 100 sec bins |
 |
 |
| Module-wise count rates for Quadrant D Data is divided into 100 sec bins |
 |
 |
| Parameter | Plot |
|---|---|
| CZT HV Monitor | 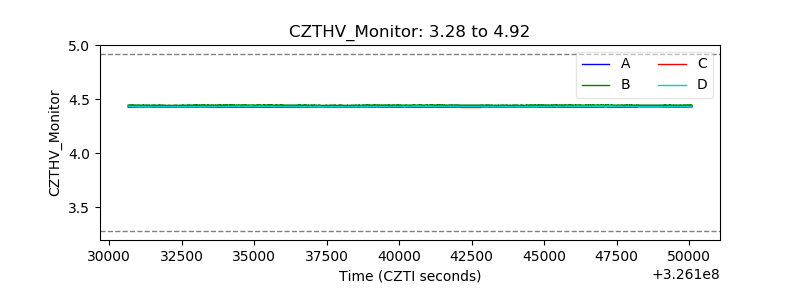 |
| D_VDD | 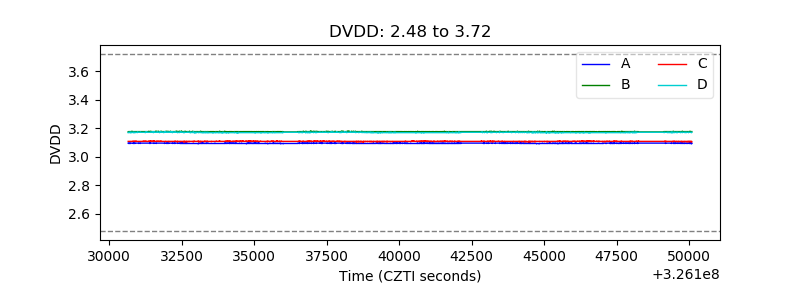 |
| Temperature 1 | 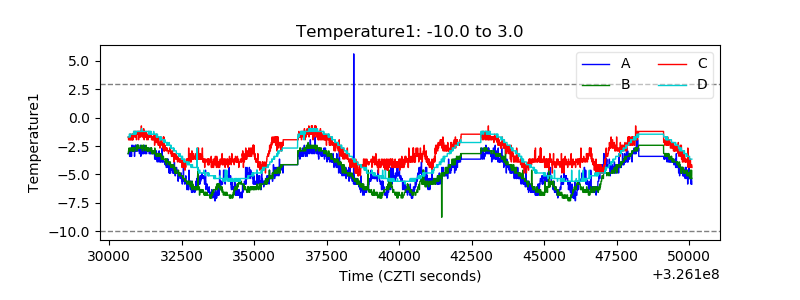 |
| Veto HV Monitor | 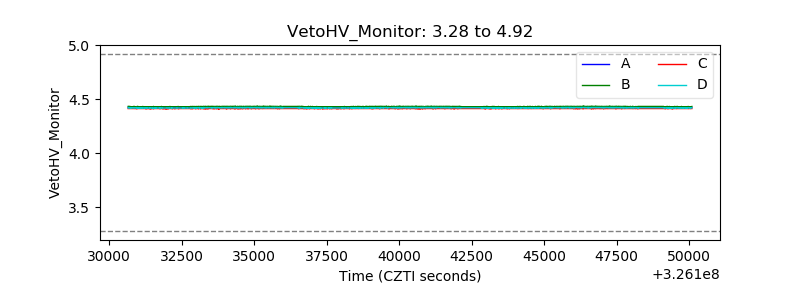 |
| Veto LLD | 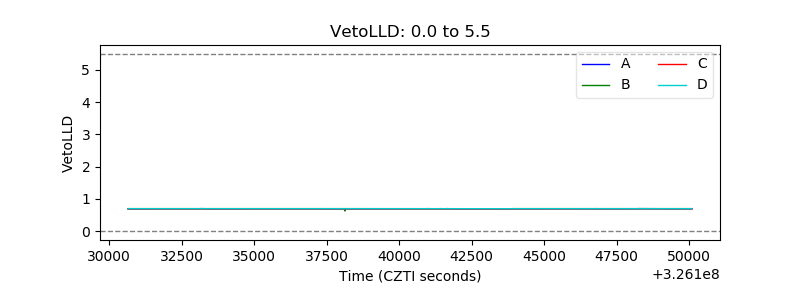 |
| Alpha Counter | 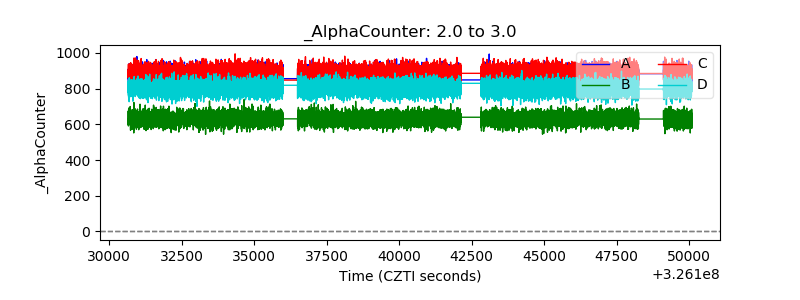 |
| _CPM_Rate | 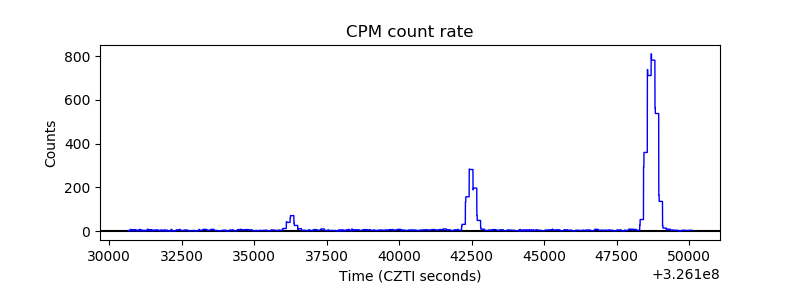 |
| CZT Counter |  |
| +2.5 Volts monitor |  |
| +5 Volts monitor | 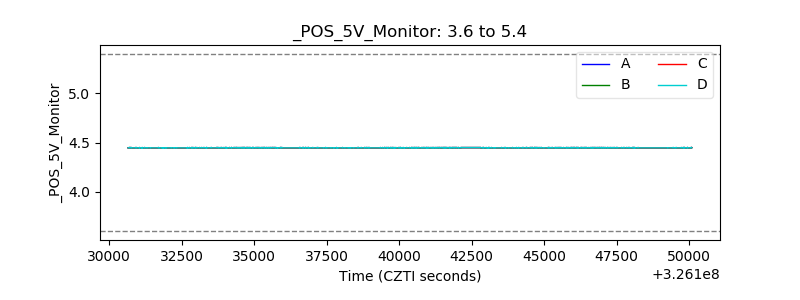 |
| _ROLL_ROT | 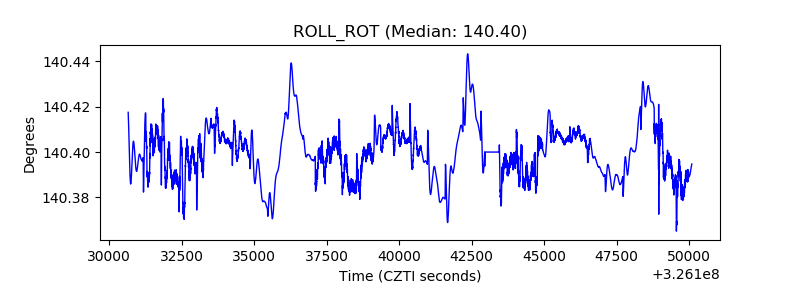 |
| _Roll_DEC | 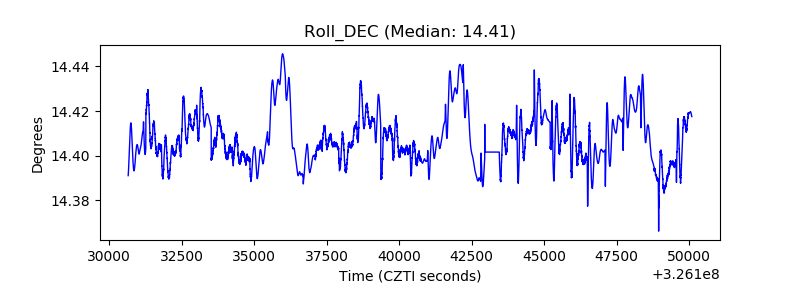 |
| _Roll_RA |  |
| Veto Counter | 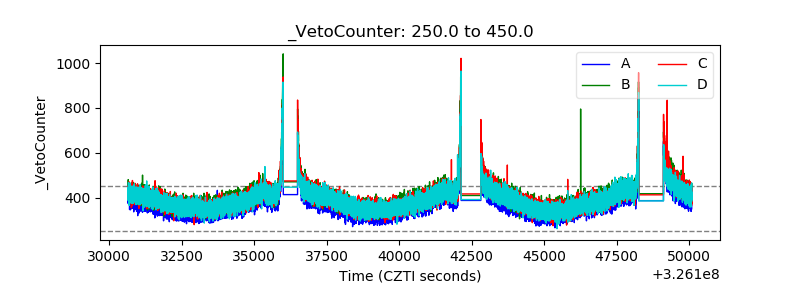 |