| Param | Original file | Final file |
|---|---|---|
| Filename | modeM0/AS1A08_003T04_9000003634_24848cztM0_level2.evt | modeM0/AS1A08_003T04_9000003634_24848cztM0_level2_quad_clean.evt |
| Size (bytes) | 72,118,080 | 19,967,040 |
| Size | 68.8 MB | 19.0 MB |
| Events in quadrant A | 560,665 | 133,029 |
| Events in quadrant B | 495,653 | 137,736 |
| Events in quadrant C | 565,613 | 129,780 |
| Events in quadrant D | 492,232 | 127,783 |
| Mode M0 | |||
|---|---|---|---|
| Quadrant | BADHDUFLAG | Total packets | Discarded packets |
| A | 0 | 2251 | 1 |
| B | 0 | 2037 | 1 |
| C | 0 | 2268 | 1 |
| D | 0 | 2069 | 1 |
| Mode M9 | |||
|---|---|---|---|
| Quadrant | BADHDUFLAG | Total packets | Discarded packets |
| A | 1 | 140439264136072 | 46 |
| B | 1 | -1 | -1 |
| C | 1 | -1 | -1 |
| D | 1 | -1 | -1 |
| Mode SS | |||
|---|---|---|---|
| Quadrant | BADHDUFLAG | Total packets | Discarded packets |
| A | 0 | 20 | 0 |
| B | 0 | 20 | 0 |
| C | 0 | 20 | 0 |
| D | 0 | 20 | 0 |
| Quadrant | Total seconds | Saturated seconds | Saturation percentage |
|---|---|---|---|
| A | 979 | 32 | 3.268641% |
| B | 979 | 2 | 0.204290% |
| C | 979 | 14 | 1.430031% |
| D | 979 | 2 | 0.204290% |
Noise dominated data is calculated using 1-second bins in cleaned event files. If a bin has >2000 counts, and if more than 50% of those come from <1% of pixels, then it is considered to be noise-dominated and hence unusable.
| Quadrant | # 1 sec bins | Bins with >0 counts | Bins with >2000 counts | High rate bins dominated by noise | Noise dominated (total time) | Noise dominated (detector-on time) | Marked lightcurve |
|---|---|---|---|---|---|---|---|
| A | 979 | 979 | 22 | 22 | 2.25% | 2.25% | 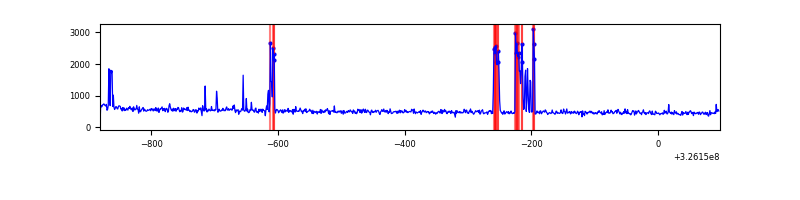 |
| B | 979 | 979 | 0 | 0 | 0.00% | 0.00% | 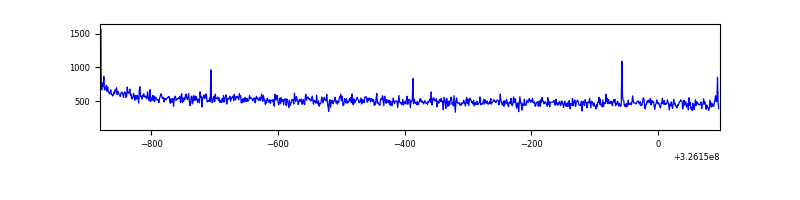 |
| C | 979 | 979 | 0 | 0 | 0.00% | 0.00% | 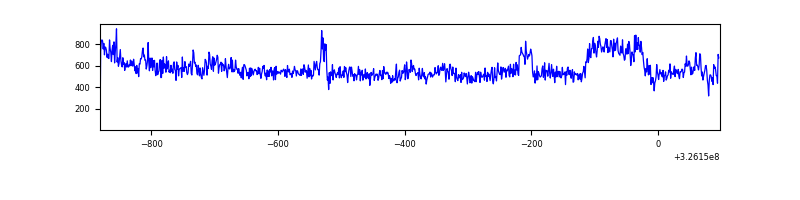 |
| D | 979 | 979 | 0 | 0 | 0.00% | 0.00% | 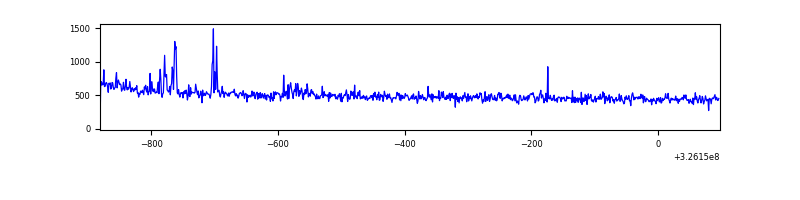 |
Top three noisy pixels from each quadrant. If the there are fewer than three noisy pixels in the level2.evt file, extra rows are filled as -1
| Pixel properties | Quadrant properties | ||||||
|---|---|---|---|---|---|---|---|
| Quadrant | DetID | PixID | Counts | Sigma | Mean | Median | Sigma |
| A | 6 | 16 | 77797 | 2853.35 | 124 | 122 | 27.2 |
| A | 13 | 254 | 1446 | 48.64 | 124 | 122 | 27.2 |
| A | 0 | 226 | 1112 | 36.37 | 124 | 122 | 27.2 |
| B | 12 | 111 | 2914 | 107.81 | 125 | 122 | 25.9 |
| B | 0 | 189 | 2735 | 100.9 | 125 | 122 | 25.9 |
| B | 11 | 111 | 2568 | 94.45 | 125 | 122 | 25.9 |
| C | 7 | 247 | 62521 | 2067.43 | 122 | 122 | 30.2 |
| C | 14 | 238 | 19249 | 633.72 | 122 | 122 | 30.2 |
| C | 2 | 16 | 7080 | 230.53 | 122 | 122 | 30.2 |
| D | 1 | 52 | 17250 | 528.92 | 124 | 120 | 32.4 |
| D | 2 | 234 | 3544 | 105.72 | 124 | 120 | 32.4 |
| D | 8 | 195 | 2960 | 87.69 | 124 | 120 | 32.4 |
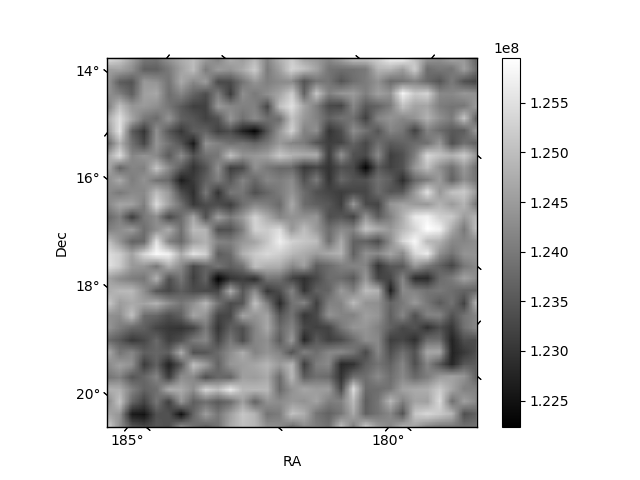
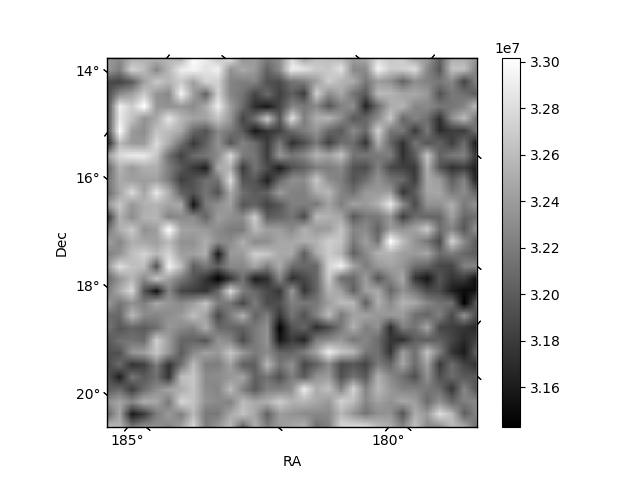
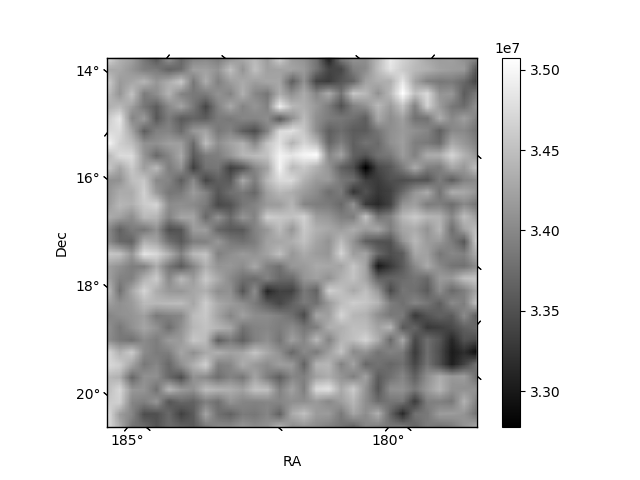
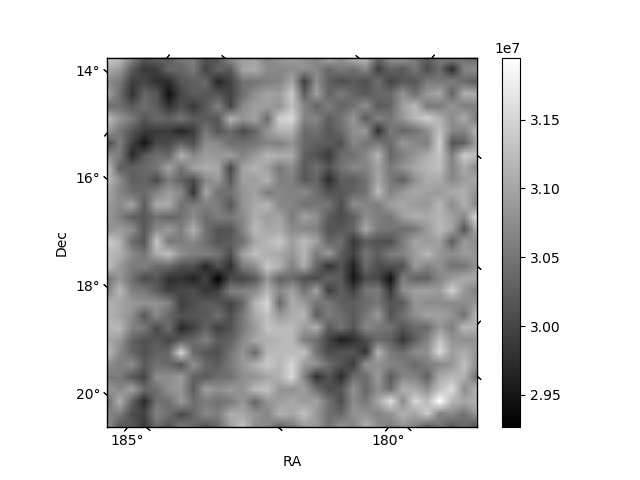
Histogram calculated using DETX and DETY for each event in the final _common_clean file
| Quadrant A | 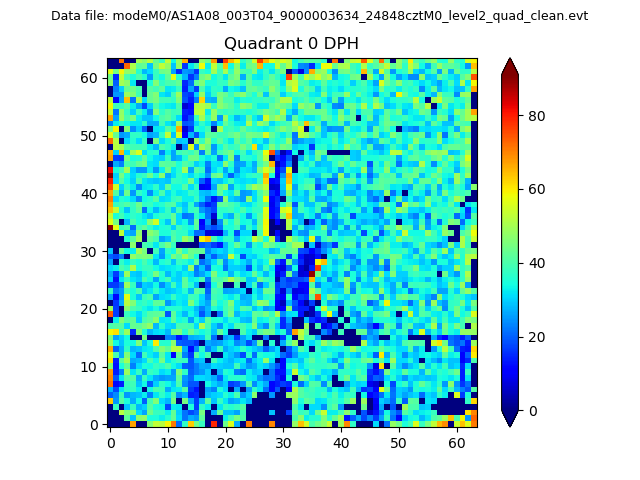 |
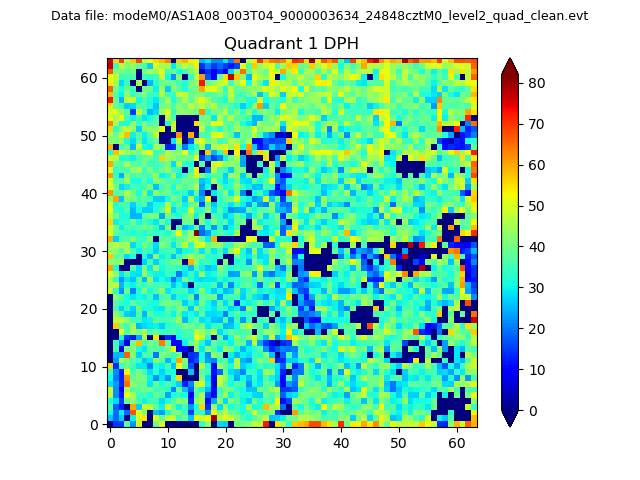 |
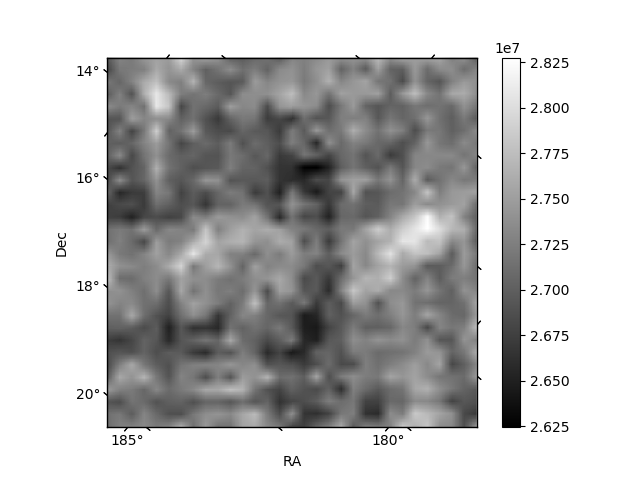
Quadrant B |
|---|---|---|---|
| Quadrant D | 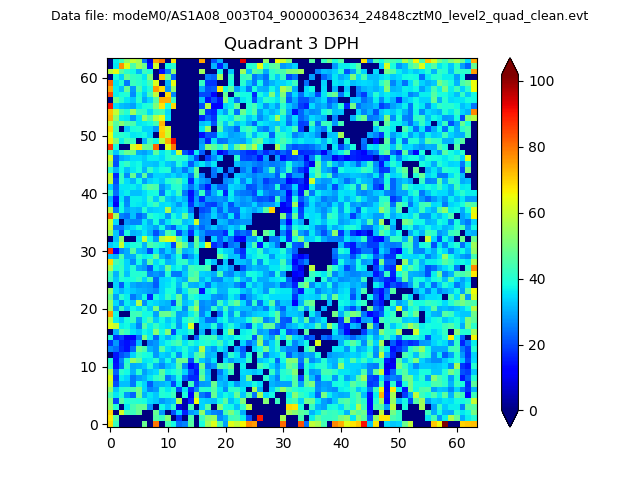 |
 |
Quadrant C |
| Plot type | Count rate plots | Images |
|---|---|---|
| Comparison with Poisson distribution Blue bars denote a histogram of data divided into 1 sec bins. Red curve is a Poisson curve with rate = median count rate of data. |
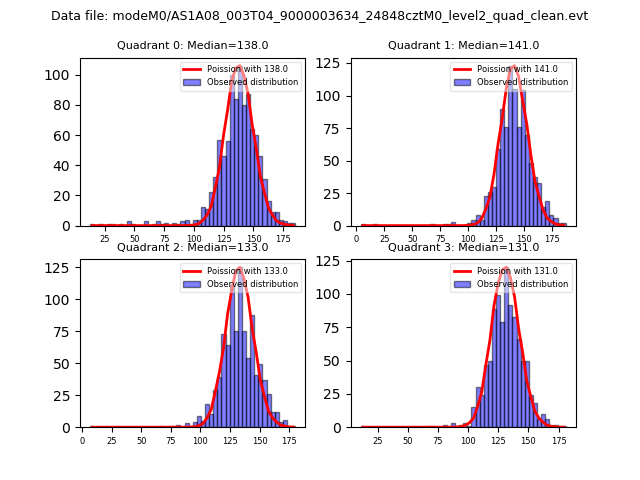 |
 |
| Quadrant-wise count rates Data is divided into 100 sec bins |
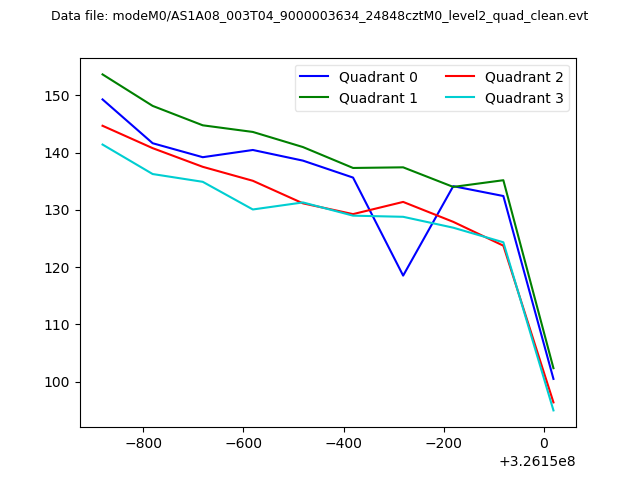 |
|
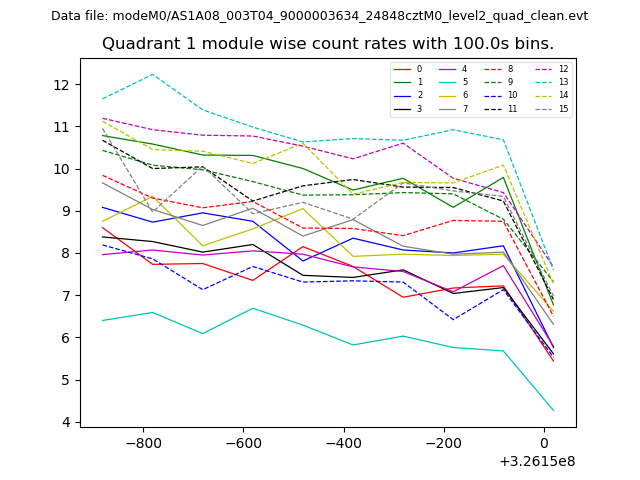
| Module-wise count rates for Quadrant A Data is divided into 100 sec bins |
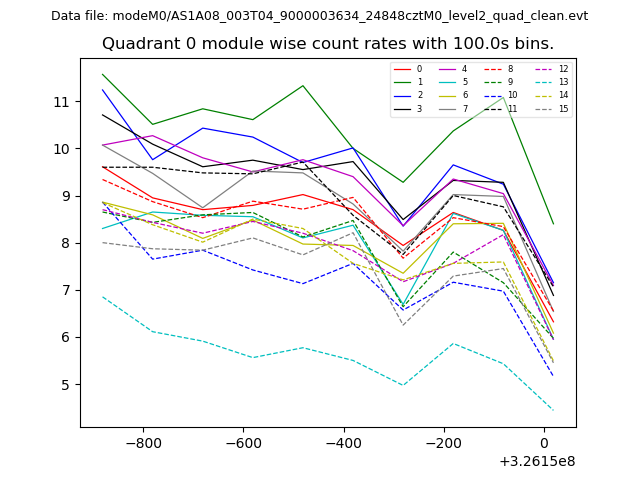 |
 |
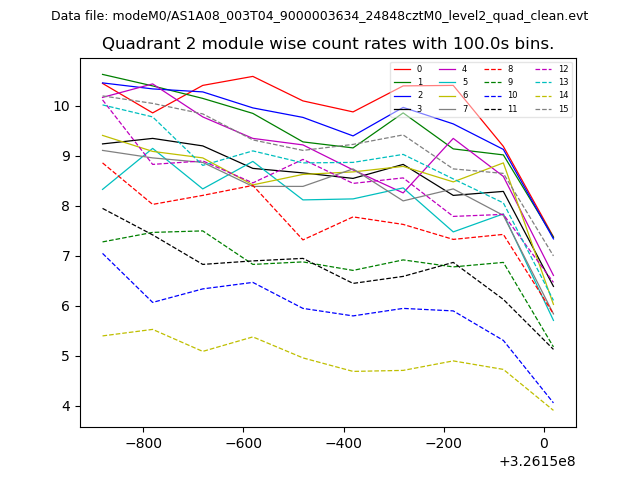
| Module-wise count rates for Quadrant B Data is divided into 100 sec bins |
 |
 |
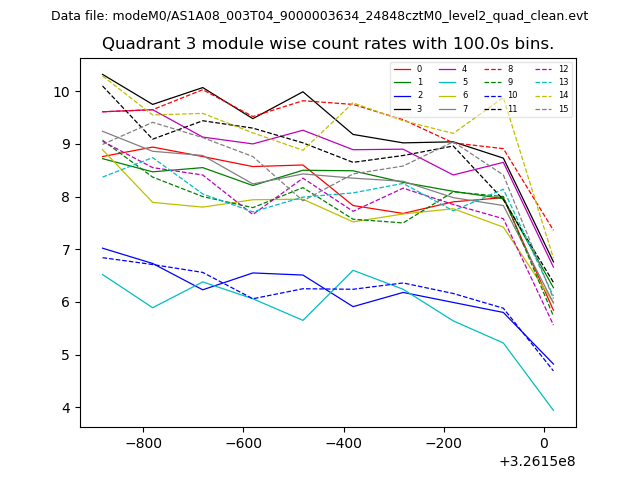
| Module-wise count rates for Quadrant C Data is divided into 100 sec bins |
 |
 |
| Module-wise count rates for Quadrant D Data is divided into 100 sec bins |
 |
 |
| Parameter | Plot |
|---|---|
| CZT HV Monitor | 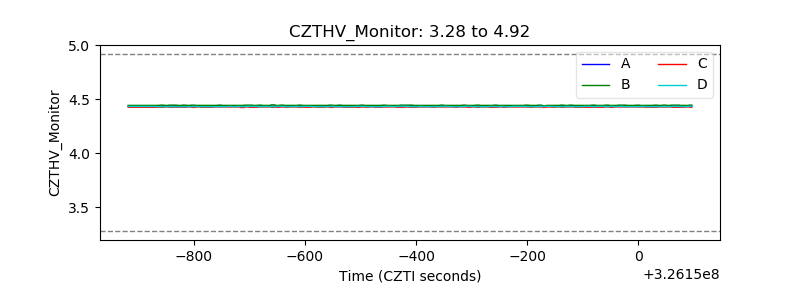 |
| D_VDD | 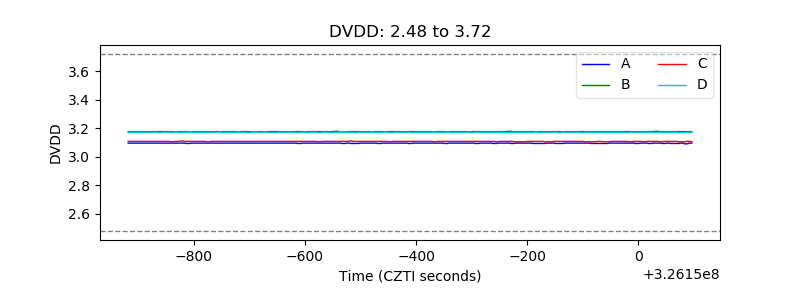 |
| Temperature 1 | 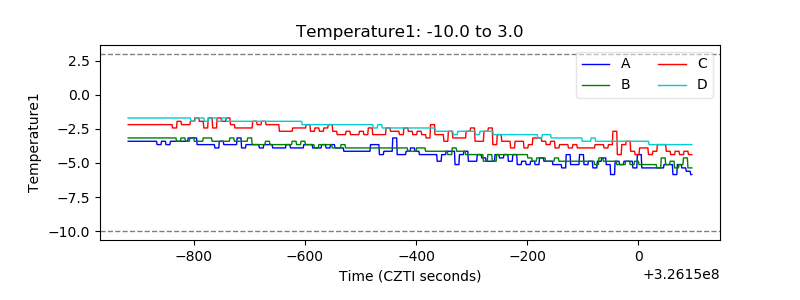 |
| Veto HV Monitor | 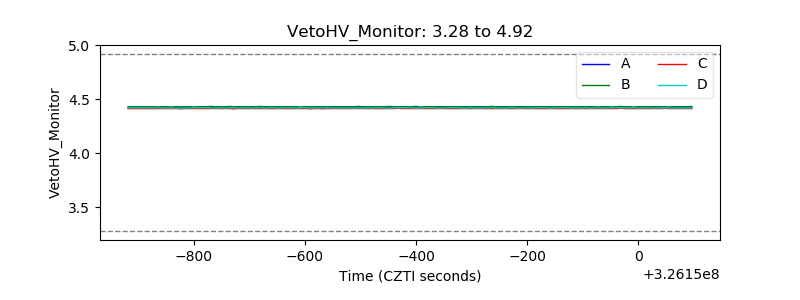 |
| Veto LLD | 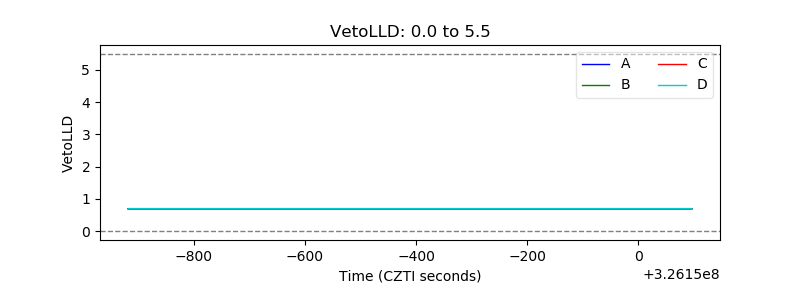 |
| Alpha Counter | 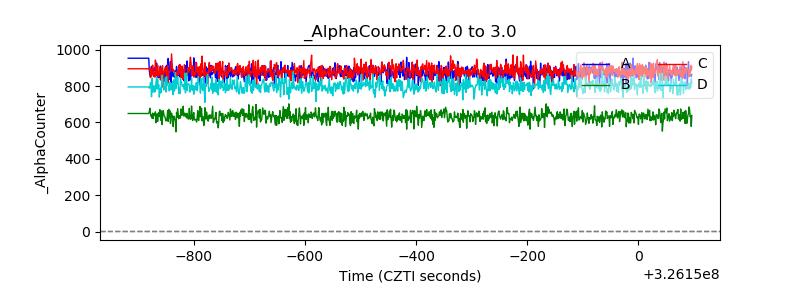 |
| _CPM_Rate | 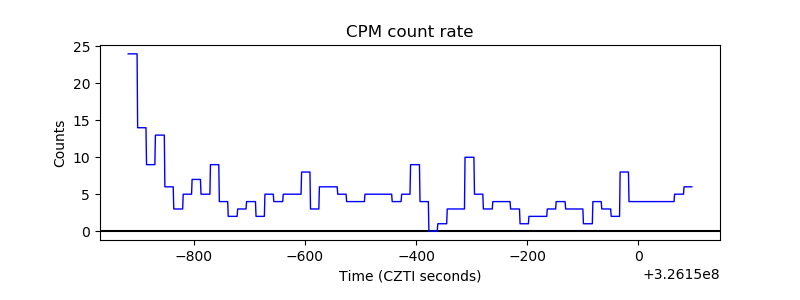 |
| CZT Counter |  |
| +2.5 Volts monitor |  |
| +5 Volts monitor |  |
| _ROLL_ROT | 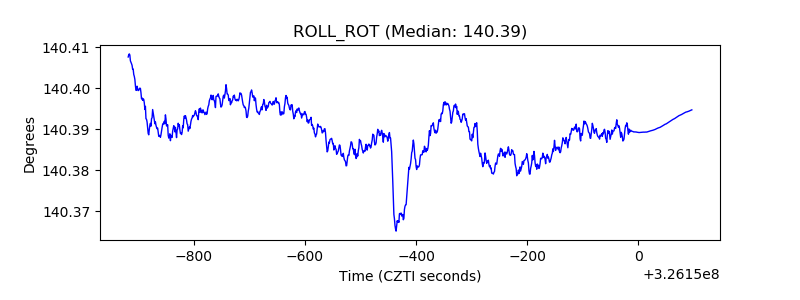 |
| _Roll_DEC | 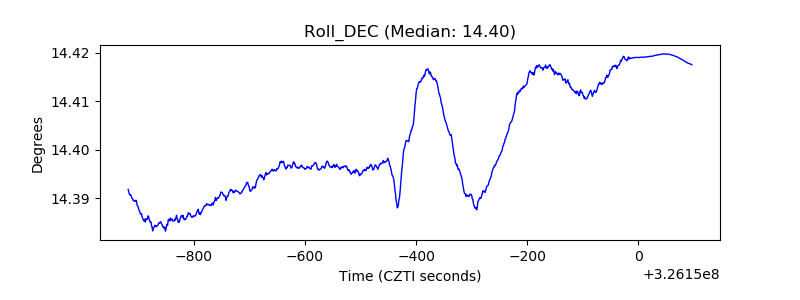 |
| _Roll_RA | 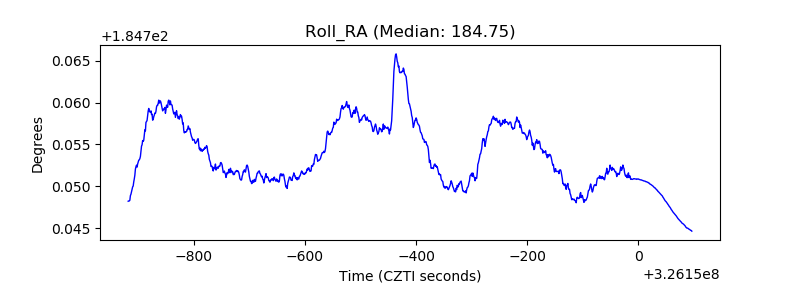 |
| Veto Counter | 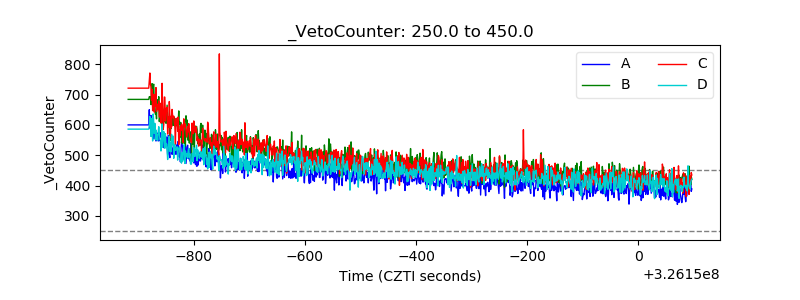 |