| Param | Original file | Final file |
|---|---|---|
| Filename | modeM0/AS1A08_003T06_9000003636cztM0_level2.fits | modeM0/AS1A08_003T06_9000003636cztM0_level2_quad_clean.evt |
| Size (bytes) | 458,331,840 | 301,466,880 |
| Size | 437.1 MB | 287.5 MB |
| Events in quadrant A | 2,898,238 | 1,610,646 |
| Events in quadrant B | 2,802,018 | 1,644,666 |
| Events in quadrant C | 2,726,170 | 1,462,877 |
| Events in quadrant D | 2,435,928 | 1,390,166 |
| Mode SS | |||
|---|---|---|---|
| Quadrant | BADHDUFLAG | Total packets | Discarded packets |
| A | 0 | 894 | 0 |
| B | 0 | 894 | 0 |
| C | 0 | 894 | 0 |
| D | 0 | 894 | 0 |
| Mode M0 | |||
|---|---|---|---|
| Quadrant | BADHDUFLAG | Total packets | Discarded packets |
| A | 0 | 98006 | 0 |
| B | 0 | 92824 | 0 |
| C | 0 | 113747 | 0 |
| D | 0 | 100784 | 0 |
| Mode M9 | |||
|---|---|---|---|
| Quadrant | BADHDUFLAG | Total packets | Discarded packets |
| A | 0 | 92 | 0 |
| B | 0 | 92 | 0 |
| C | 0 | 92 | 0 |
| D | 0 | 92 | 0 |
| Quadrant | Total seconds | Saturated seconds | Saturation percentage |
|---|---|---|---|
| A | 43976 | 936 | 2.128434% |
| B | 43976 | 508 | 1.155176% |
| C | 43976 | 1605 | 3.649718% |
| D | 43976 | 589 | 1.339367% |
Noise dominated data is calculated using 1-second bins in cleaned event files. If a bin has >2000 counts, and if more than 50% of those come from <1% of pixels, then it is considered to be noise-dominated and hence unusable.
| Quadrant | # 1 sec bins | Bins with >0 counts | Bins with >2000 counts | High rate bins dominated by noise | Noise dominated (total time) | Noise dominated (detector-on time) | Marked lightcurve |
|---|---|---|---|---|---|---|---|
| A | 53082 | 43974 | 0 | 0 | 0.00% | 0.00% |  |
| B | 53082 | 43977 | 0 | 0 | 0.00% | 0.00% |  |
| C | 53082 | 43971 | 0 | 0 | 0.00% | 0.00% |  |
| D | 53081 | 43968 | 0 | 0 | 0.00% | 0.00% |  |
Top three noisy pixels from each quadrant. If the there are fewer than three noisy pixels in the level2.evt file, extra rows are filled as -1
| Pixel properties | Quadrant properties | ||||||
|---|---|---|---|---|---|---|---|
| Quadrant | DetID | PixID | Counts | Sigma | Mean | Median | Sigma |
| A | 0 | 29 | 2700 | 10.84 | 755 | 711 | 183.5 |
| A | 7 | 110 | 2286 | 8.58 | 755 | 711 | 183.5 |
| A | 9 | 19 | 2175 | 7.98 | 755 | 711 | 183.5 |
| B | 2 | 9 | 2206 | 10.27 | 740 | 709 | 145.7 |
| B | 5 | 255 | 1857 | 7.88 | 740 | 709 | 145.7 |
| B | 2 | 8 | 1851 | 7.84 | 740 | 709 | 145.7 |
| C | 1 | 81 | 2071 | 7.58 | 719 | 676 | 184.0 |
| C | 1 | 80 | 2057 | 7.5 | 719 | 676 | 184.0 |
| C | 9 | 209 | 1854 | 6.4 | 719 | 676 | 184.0 |
| D | 7 | 3 | 1790 | 6.22 | 695 | 634 | 185.8 |
| D | 6 | 231 | 1752 | 6.02 | 695 | 634 | 185.8 |
| D | 3 | 14 | 1733 | 5.92 | 695 | 634 | 185.8 |
Histogram calculated using DETX and DETY for each event in the final _common_clean file
| Quadrant A | 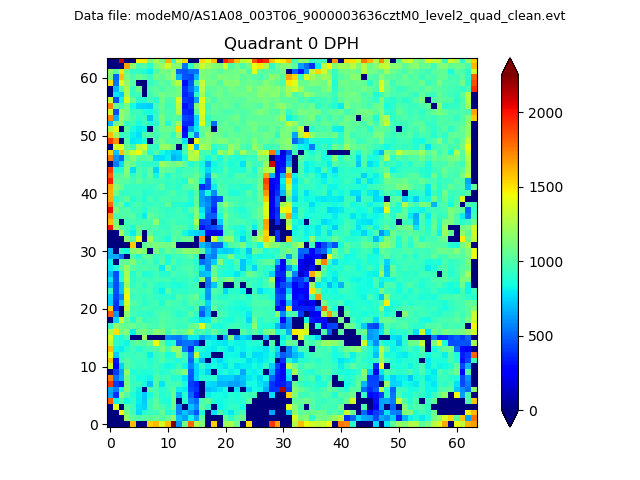 |
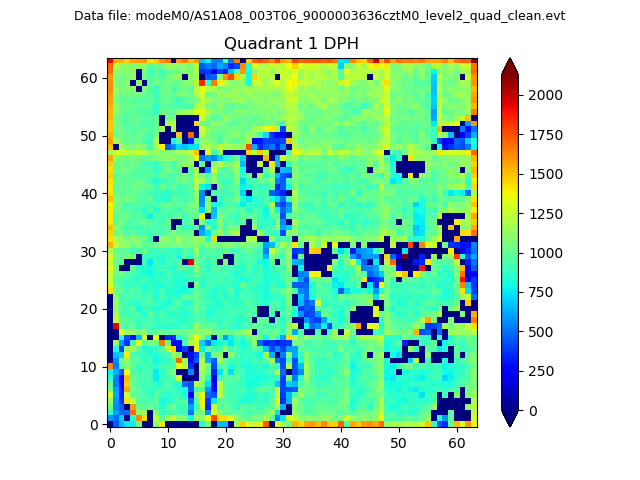 |
Quadrant B |
|---|---|---|---|
| Quadrant D | 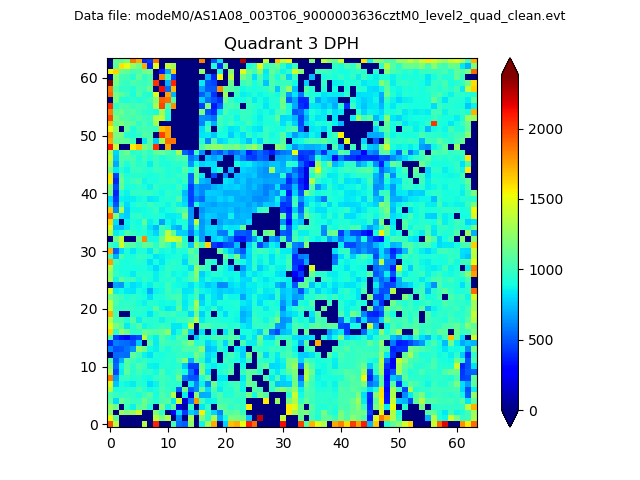 |
 |
Quadrant C |
| Plot type | Count rate plots | Images |
|---|---|---|
| Comparison with Poisson distribution Blue bars denote a histogram of data divided into 1 sec bins. Red curve is a Poisson curve with rate = median count rate of data. |
 |
 |
| Quadrant-wise count rates Data is divided into 100 sec bins |
 |
|
| Module-wise count rates for Quadrant A Data is divided into 100 sec bins |
 |
 |
| Module-wise count rates for Quadrant B Data is divided into 100 sec bins |
 |
 |
| Module-wise count rates for Quadrant C Data is divided into 100 sec bins |
 |
 |
| Module-wise count rates for Quadrant D Data is divided into 100 sec bins |
 |
 |
| Parameter | Plot |
|---|---|
| CZT HV Monitor |  |
| D_VDD | 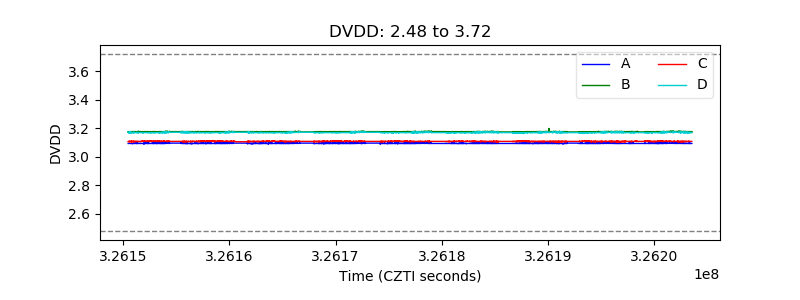 |
| Temperature 1 |  |
| Veto HV Monitor |  |
| Veto LLD |  |
| Alpha Counter |  |
| _CPM_Rate |  |
| CZT Counter |  |
| +2.5 Volts monitor |  |
| +5 Volts monitor |  |
| _ROLL_ROT |  |
| _Roll_DEC |  |
| _Roll_RA |  |
| Veto Counter |  |