| Param | Original file | Final file |
|---|---|---|
| Filename | modeM0/AS1A08_003T06_9000003636_24850cztM0_level2.evt | modeM0/AS1A08_003T06_9000003636_24850cztM0_level2_quad_clean.evt |
| Size (bytes) | 448,663,680 | 92,488,320 |
| Size | 427.9 MB | 88.2 MB |
| Events in quadrant A | 3,387,932 | 599,692 |
| Events in quadrant B | 3,180,359 | 619,675 |
| Events in quadrant C | 3,520,084 | 571,289 |
| Events in quadrant D | 3,064,213 | 563,432 |
| Mode SS | |||
|---|---|---|---|
| Quadrant | BADHDUFLAG | Total packets | Discarded packets |
| A | 0 | 132 | 0 |
| B | 0 | 132 | 0 |
| C | 0 | 132 | 0 |
| D | 0 | 132 | 0 |
| Mode M0 | |||
|---|---|---|---|
| Quadrant | BADHDUFLAG | Total packets | Discarded packets |
| A | 0 | 14074 | 2 |
| B | 0 | 13418 | 2 |
| C | 0 | 14426 | 2 |
| D | 0 | 13437 | 2 |
| Mode M9 | |||
|---|---|---|---|
| Quadrant | BADHDUFLAG | Total packets | Discarded packets |
| A | 0 | 22 | 0 |
| B | 0 | 22 | 0 |
| C | 0 | 22 | 0 |
| D | 0 | 22 | 0 |
| Quadrant | Total seconds | Saturated seconds | Saturation percentage |
|---|---|---|---|
| A | 6402 | 95 | 1.483911% |
| B | 6403 | 32 | 0.499766% |
| C | 6403 | 186 | 2.904888% |
| D | 6403 | 16 | 0.249883% |
Noise dominated data is calculated using 1-second bins in cleaned event files. If a bin has >2000 counts, and if more than 50% of those come from <1% of pixels, then it is considered to be noise-dominated and hence unusable.
| Quadrant | # 1 sec bins | Bins with >0 counts | Bins with >2000 counts | High rate bins dominated by noise | Noise dominated (total time) | Noise dominated (detector-on time) | Marked lightcurve |
|---|---|---|---|---|---|---|---|
| A | 8567 | 6404 | 76 | 76 | 0.89% | 1.19% | 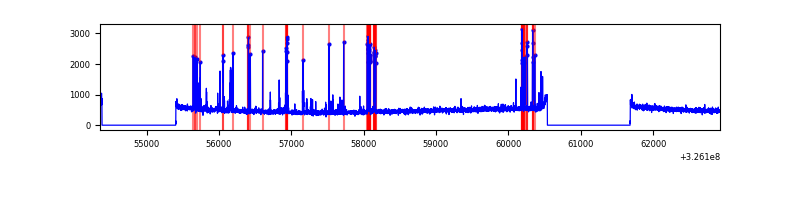 |
| B | 8568 | 6405 | 0 | 0 | 0.00% | 0.00% | 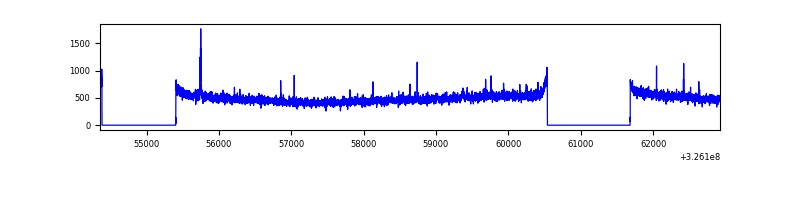 |
| C | 8568 | 6405 | 96 | 96 | 1.12% | 1.50% | 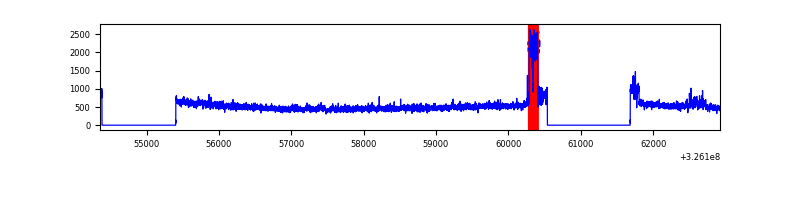 |
| D | 8568 | 6405 | 4 | 4 | 0.05% | 0.06% | 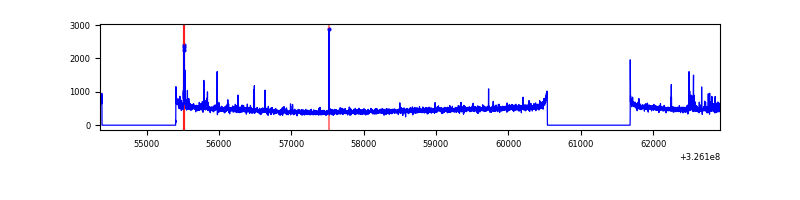 |
Top three noisy pixels from each quadrant. If the there are fewer than three noisy pixels in the level2.evt file, extra rows are filled as -1
| Pixel properties | Quadrant properties | ||||||
|---|---|---|---|---|---|---|---|
| Quadrant | DetID | PixID | Counts | Sigma | Mean | Median | Sigma |
| A | 6 | 16 | 288170 | 1778.69 | 802 | 787 | 161.6 |
| A | 13 | 254 | 9781 | 55.67 | 802 | 787 | 161.6 |
| A | 3 | 137 | 7404 | 40.95 | 802 | 787 | 161.6 |
| B | 12 | 111 | 18679 | 116.15 | 803 | 783 | 154.1 |
| B | 11 | 111 | 17073 | 105.73 | 803 | 783 | 154.1 |
| B | 14 | 111 | 15736 | 97.05 | 803 | 783 | 154.1 |
| C | 2 | 16 | 228380 | 1267.31 | 765 | 770 | 179.6 |
| C | 7 | 247 | 189706 | 1051.97 | 765 | 770 | 179.6 |
| C | 14 | 238 | 122225 | 676.25 | 765 | 770 | 179.6 |
| D | 1 | 52 | 95976 | 504.74 | 774 | 752 | 188.7 |
| D | 2 | 234 | 23983 | 123.14 | 774 | 752 | 188.7 |
| D | 12 | 218 | 23088 | 118.39 | 774 | 752 | 188.7 |
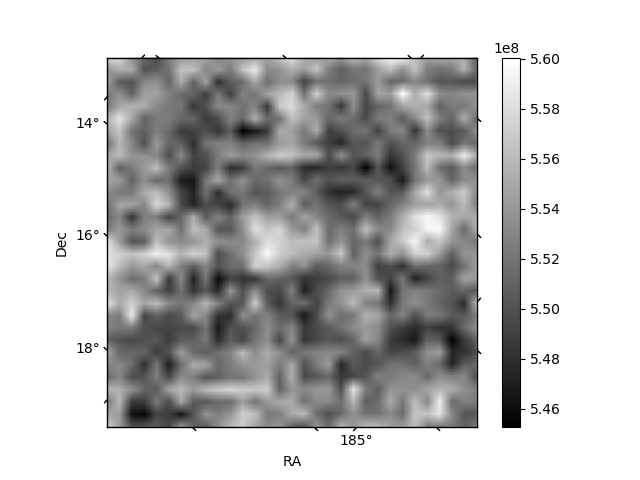
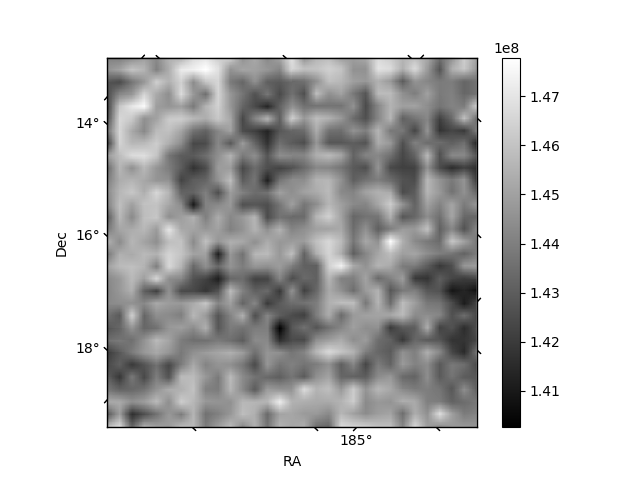
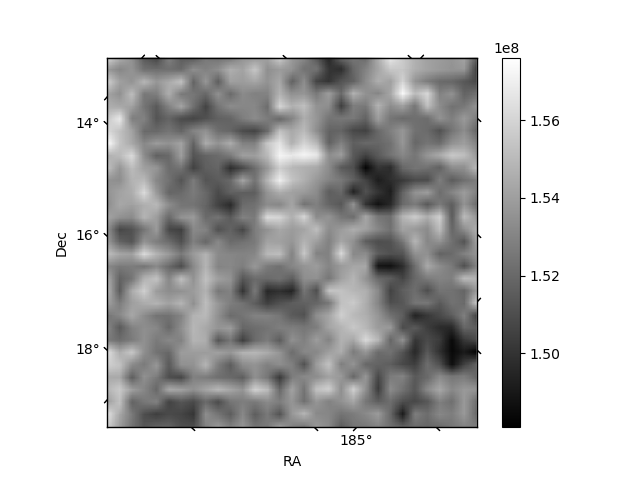
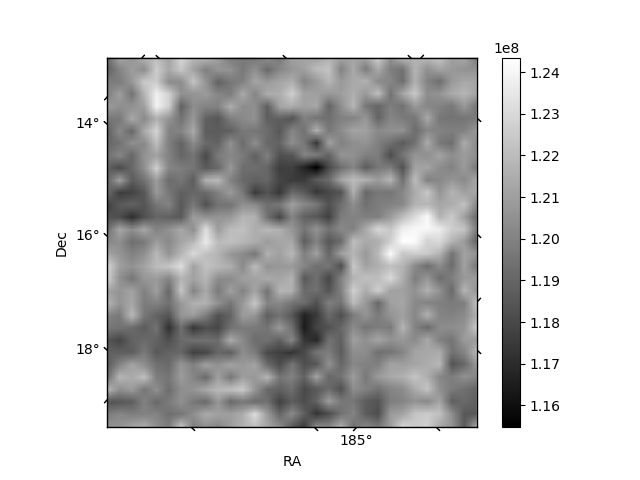
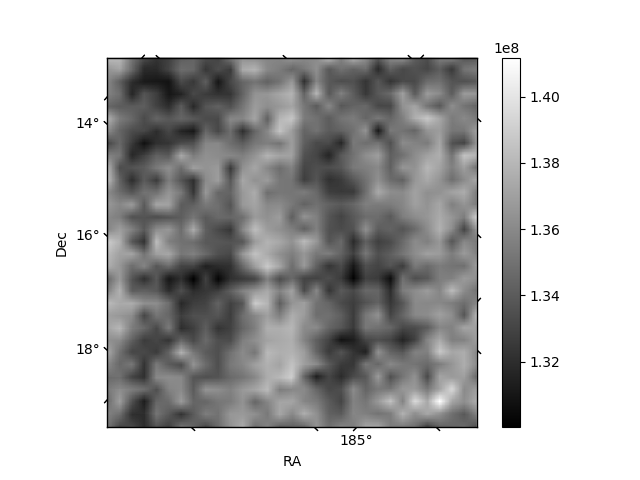
Histogram calculated using DETX and DETY for each event in the final _common_clean file
| Quadrant A | 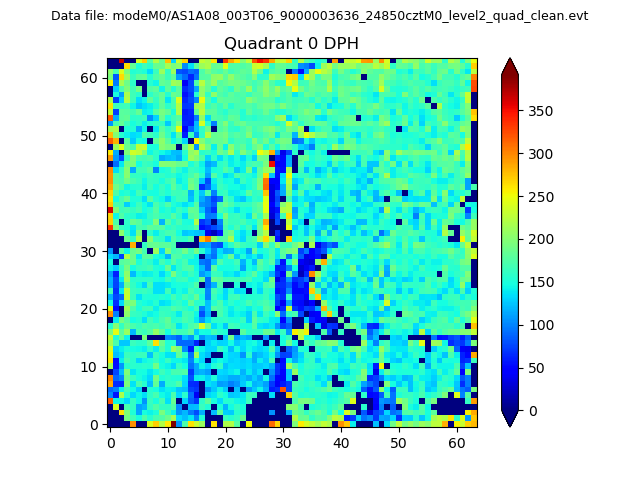 |
 |
Quadrant B |
|---|---|---|---|
| Quadrant D | 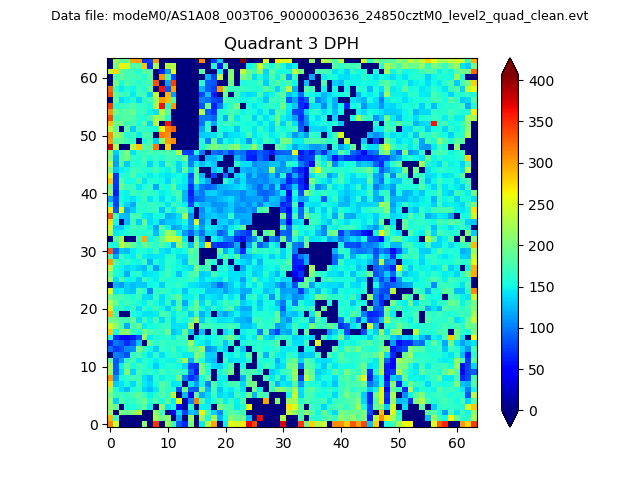 |
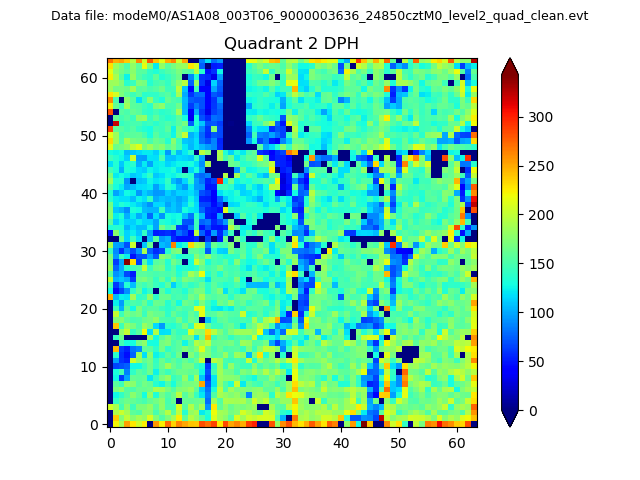 |
Quadrant C |
| Plot type | Count rate plots | Images |
|---|---|---|
| Comparison with Poisson distribution Blue bars denote a histogram of data divided into 1 sec bins. Red curve is a Poisson curve with rate = median count rate of data. |
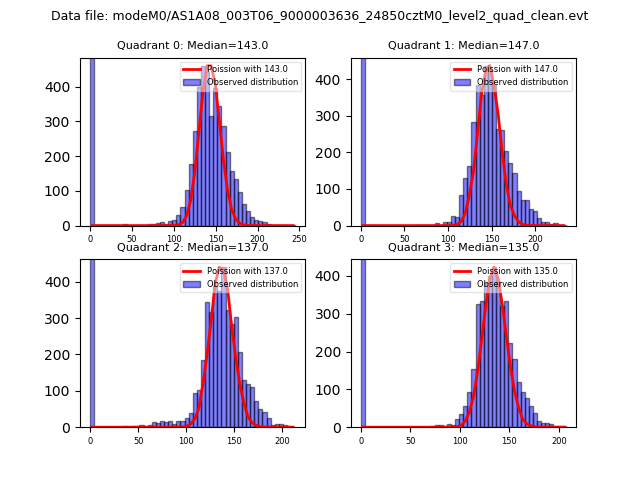 |
 |
| Quadrant-wise count rates Data is divided into 100 sec bins |
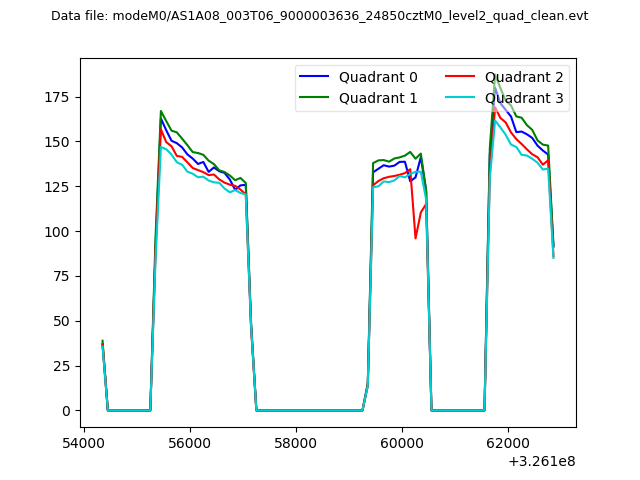 |
|
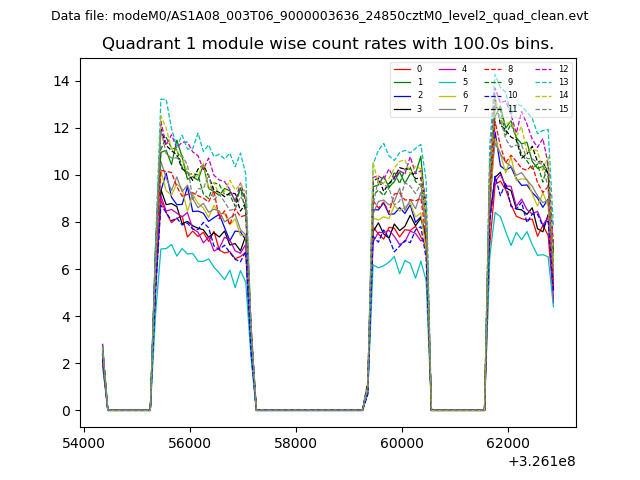
| Module-wise count rates for Quadrant A Data is divided into 100 sec bins |
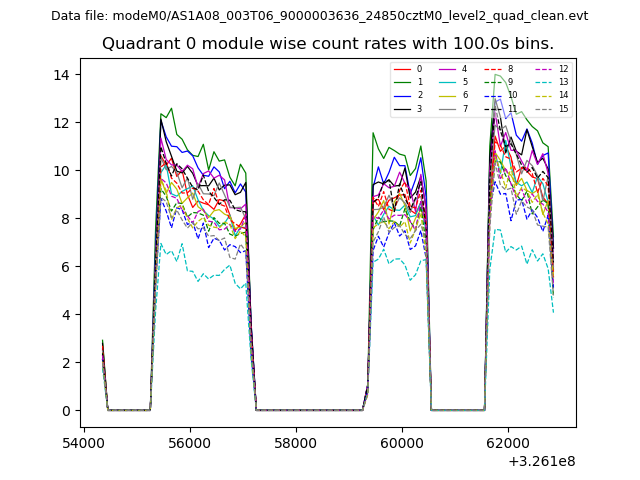 |
 |
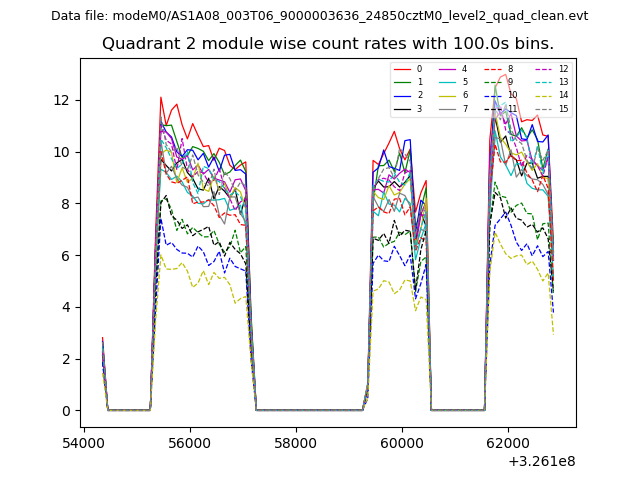
| Module-wise count rates for Quadrant B Data is divided into 100 sec bins |
 |
 |
| Module-wise count rates for Quadrant C Data is divided into 100 sec bins |
 |
 |
| Module-wise count rates for Quadrant D Data is divided into 100 sec bins |
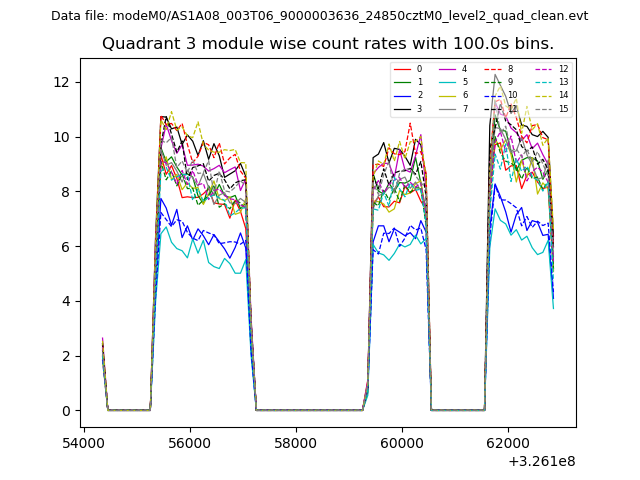 |
 |
| Parameter | Plot |
|---|---|
| CZT HV Monitor | 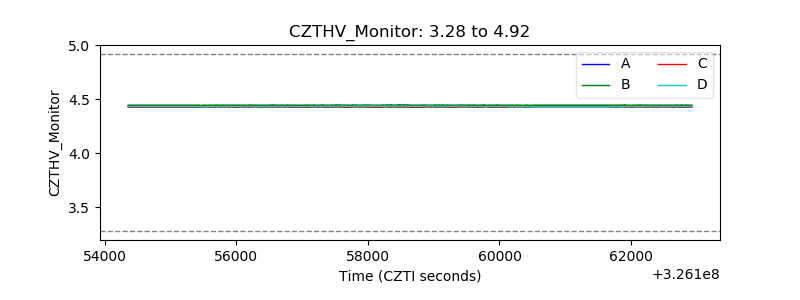 |
| D_VDD | 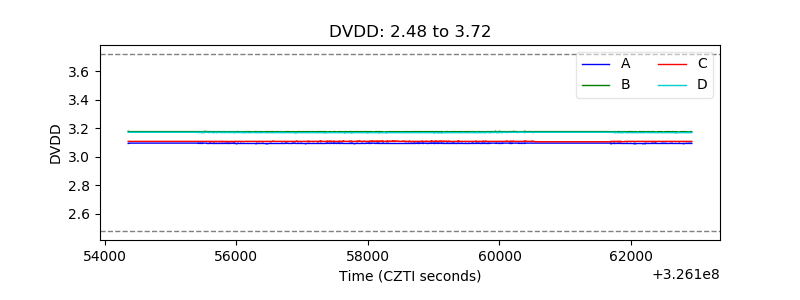 |
| Temperature 1 | 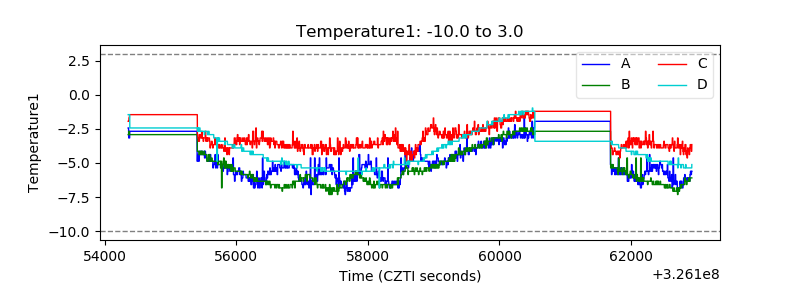 |
| Veto HV Monitor | 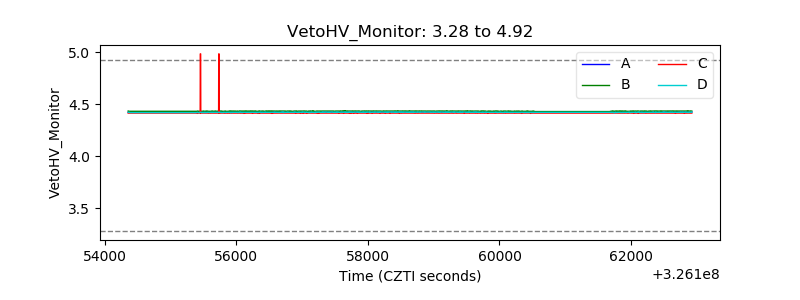 |
| Veto LLD | 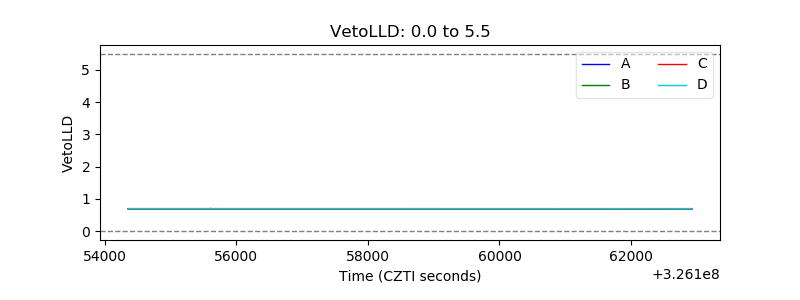 |
| Alpha Counter | 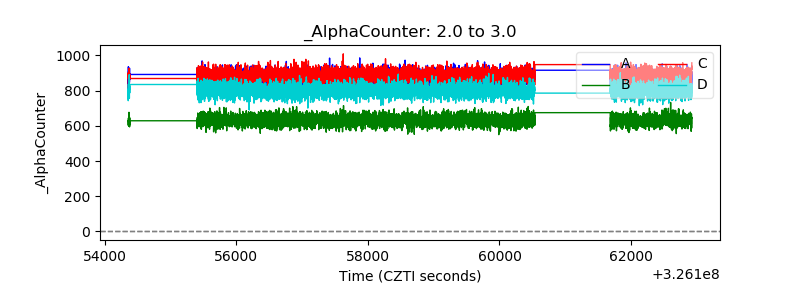 |
| _CPM_Rate | 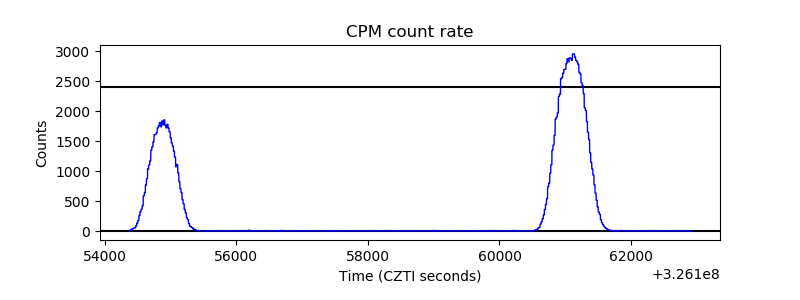 |
| CZT Counter | 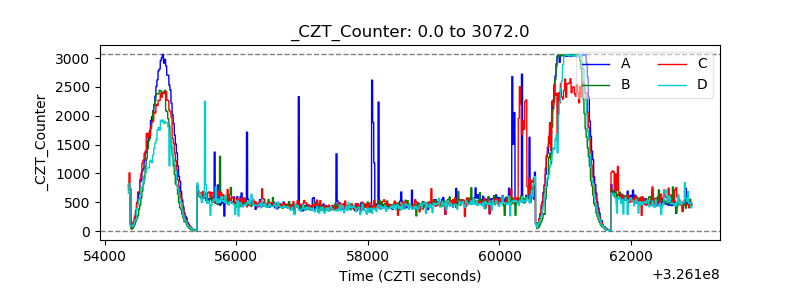 |
| +2.5 Volts monitor |  |
| +5 Volts monitor |  |
| _ROLL_ROT | 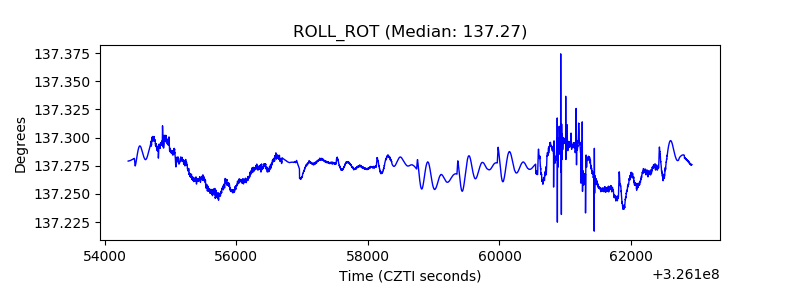 |
| _Roll_DEC | 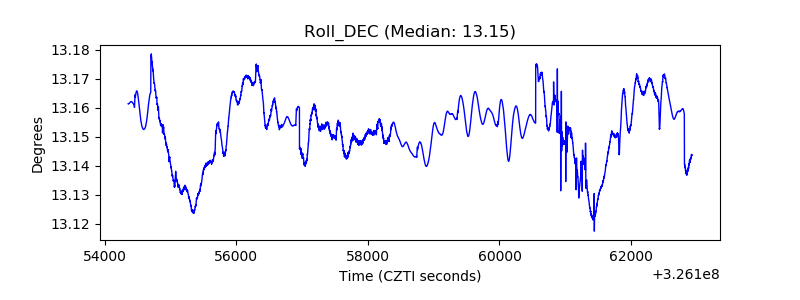 |
| _Roll_RA | 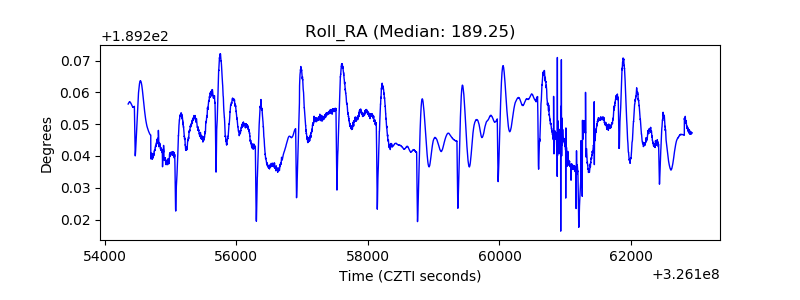 |
| Veto Counter |  |