| Param | Original file | Final file |
|---|---|---|
| Filename | modeM0/AS1A08_003T06_9000003636_24851cztM0_level2.evt | modeM0/AS1A08_003T06_9000003636_24851cztM0_level2_quad_clean.evt |
| Size (bytes) | 474,416,640 | 89,409,600 |
| Size | 452.4 MB | 85.3 MB |
| Events in quadrant A | 3,399,335 | 581,201 |
| Events in quadrant B | 3,331,159 | 599,989 |
| Events in quadrant C | 3,539,562 | 551,107 |
| Events in quadrant D | 3,666,130 | 531,717 |
| Mode SS | |||
|---|---|---|---|
| Quadrant | BADHDUFLAG | Total packets | Discarded packets |
| A | 0 | 130 | 0 |
| B | 0 | 130 | 0 |
| C | 0 | 130 | 0 |
| D | 0 | 130 | 0 |
| Mode M0 | |||
|---|---|---|---|
| Quadrant | BADHDUFLAG | Total packets | Discarded packets |
| A | 0 | 13930 | 2 |
| B | 0 | 13717 | 2 |
| C | 0 | 14738 | 2 |
| D | 0 | 14980 | 2 |
| Mode M9 | |||
|---|---|---|---|
| Quadrant | BADHDUFLAG | Total packets | Discarded packets |
| A | 0 | 20 | 0 |
| B | 0 | 21 | 0 |
| C | 0 | 21 | 0 |
| D | 0 | 21 | 0 |
| Quadrant | Total seconds | Saturated seconds | Saturation percentage |
|---|---|---|---|
| A | 6355 | 67 | 1.054288% |
| B | 6355 | 34 | 0.535012% |
| C | 6355 | 56 | 0.881196% |
| D | 6355 | 79 | 1.243116% |
Noise dominated data is calculated using 1-second bins in cleaned event files. If a bin has >2000 counts, and if more than 50% of those come from <1% of pixels, then it is considered to be noise-dominated and hence unusable.
| Quadrant | # 1 sec bins | Bins with >0 counts | Bins with >2000 counts | High rate bins dominated by noise | Noise dominated (total time) | Noise dominated (detector-on time) | Marked lightcurve |
|---|---|---|---|---|---|---|---|
| A | 7601 | 6357 | 49 | 49 | 0.64% | 0.77% | 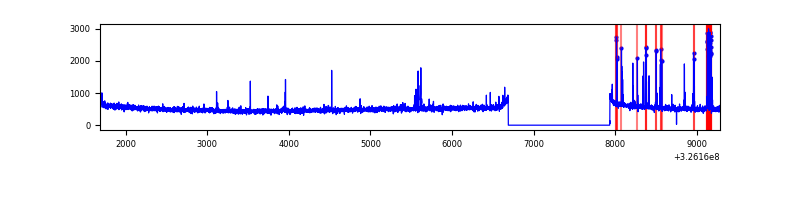 |
| B | 7601 | 6357 | 6 | 6 | 0.08% | 0.09% | 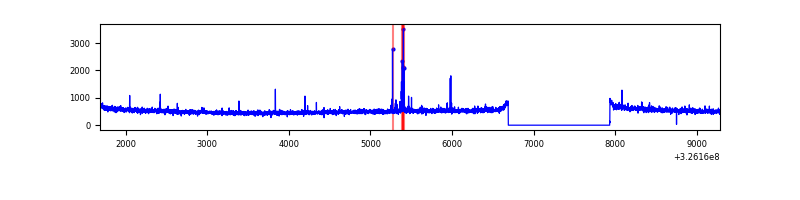 |
| C | 7601 | 6357 | 0 | 0 | 0.00% | 0.00% | 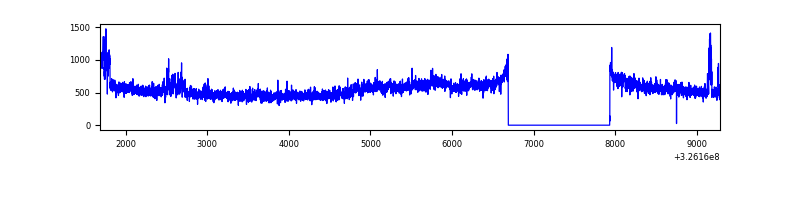 |
| D | 7601 | 6357 | 55 | 55 | 0.72% | 0.87% | 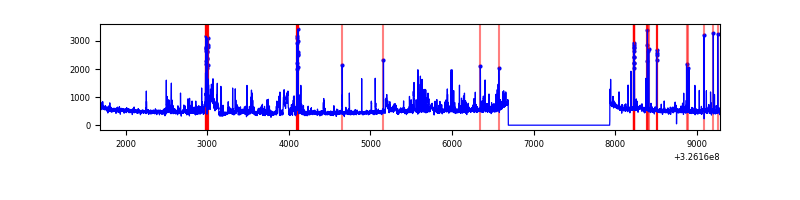 |
Top three noisy pixels from each quadrant. If the there are fewer than three noisy pixels in the level2.evt file, extra rows are filled as -1
| Pixel properties | Quadrant properties | ||||||
|---|---|---|---|---|---|---|---|
| Quadrant | DetID | PixID | Counts | Sigma | Mean | Median | Sigma |
| A | 6 | 16 | 197658 | 1187.86 | 829 | 815 | 165.7 |
| A | 13 | 254 | 9976 | 55.28 | 829 | 815 | 165.7 |
| A | 3 | 137 | 7328 | 39.3 | 829 | 815 | 165.7 |
| B | 10 | 251 | 61110 | 383.71 | 832 | 812 | 157.1 |
| B | 12 | 111 | 18719 | 113.95 | 832 | 812 | 157.1 |
| B | 11 | 111 | 17007 | 103.06 | 832 | 812 | 157.1 |
| C | 10 | 91 | 150112 | 809.92 | 790 | 798 | 184.4 |
| C | 7 | 247 | 141823 | 764.95 | 790 | 798 | 184.4 |
| C | 14 | 238 | 128894 | 694.82 | 790 | 798 | 184.4 |
| D | 1 | 52 | 651616 | 3396.03 | 787 | 765 | 191.7 |
| D | 2 | 234 | 22859 | 115.28 | 787 | 765 | 191.7 |
| D | 8 | 195 | 12648 | 62.0 | 787 | 765 | 191.7 |
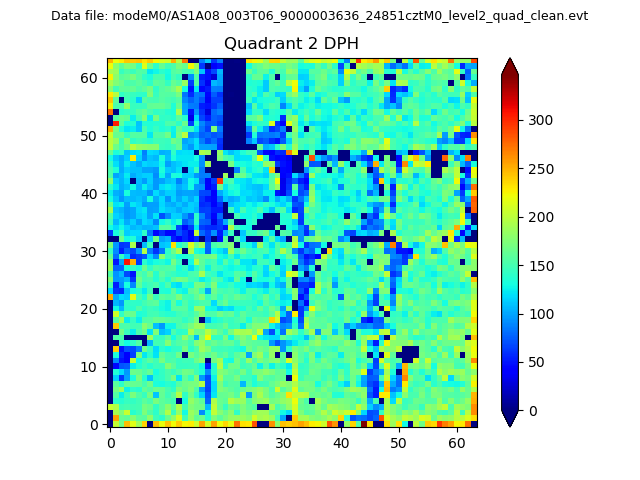
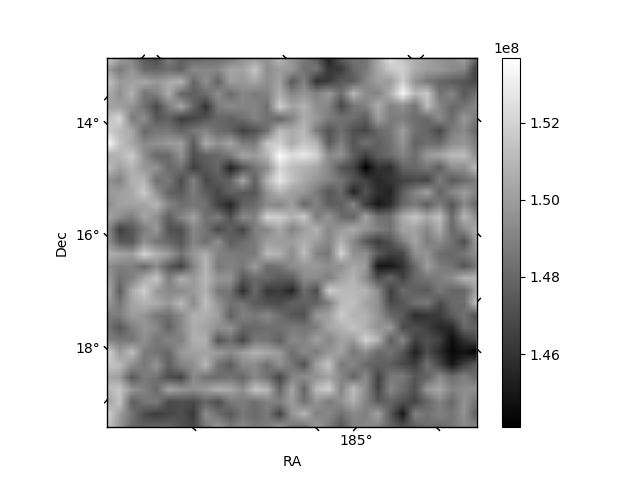
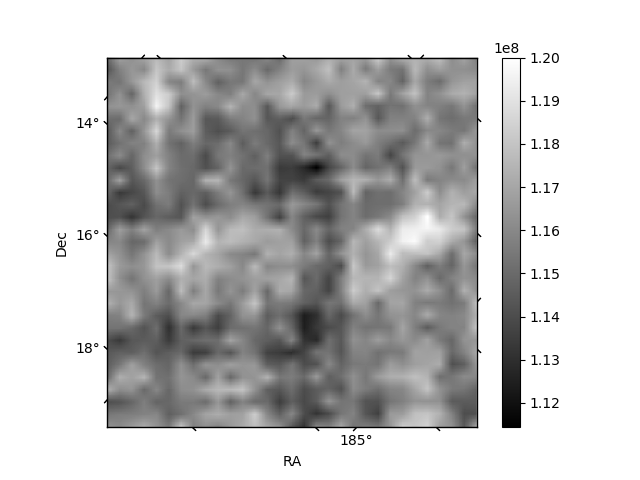
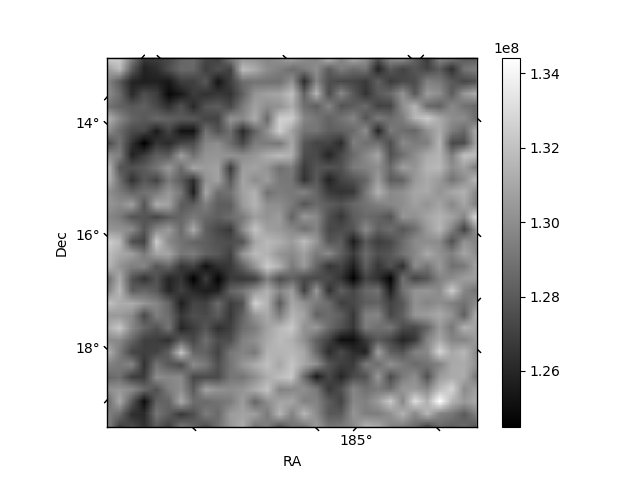
Histogram calculated using DETX and DETY for each event in the final _common_clean file
| Quadrant A | 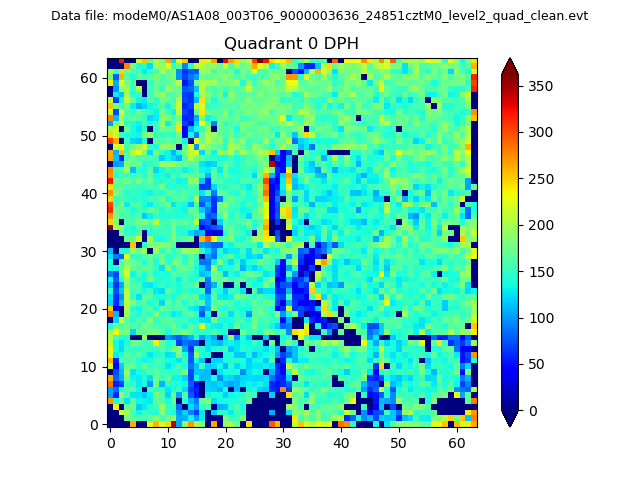 |
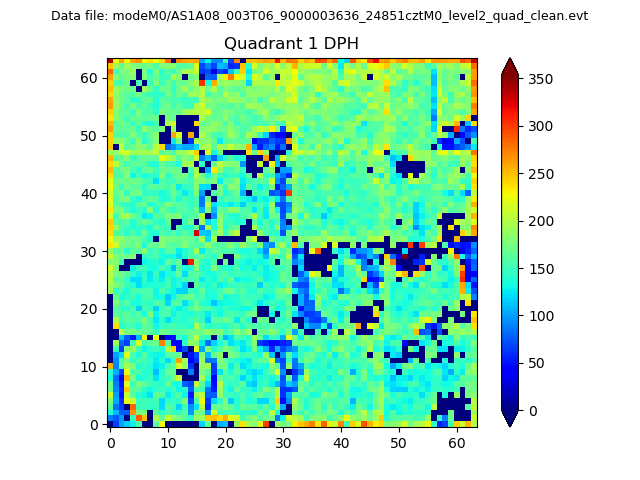 |
Quadrant B |
|---|---|---|---|
| Quadrant D | 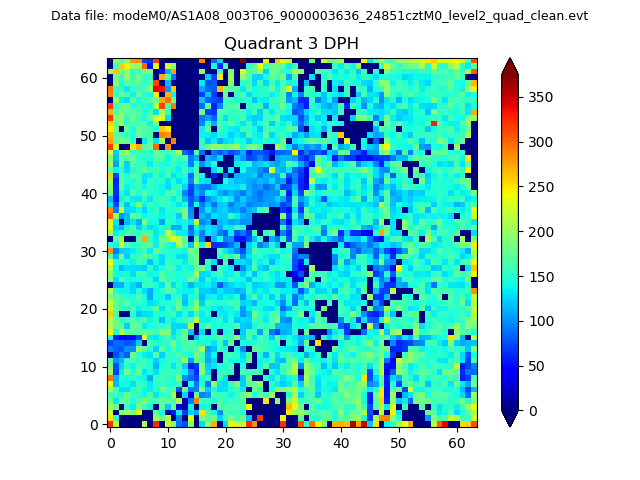 |
 |
Quadrant C |
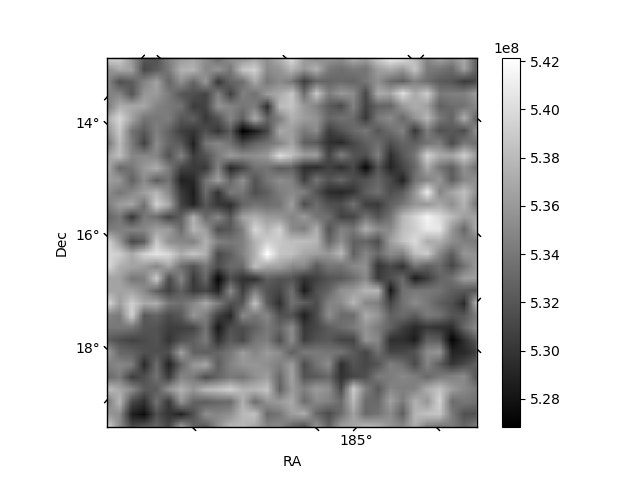
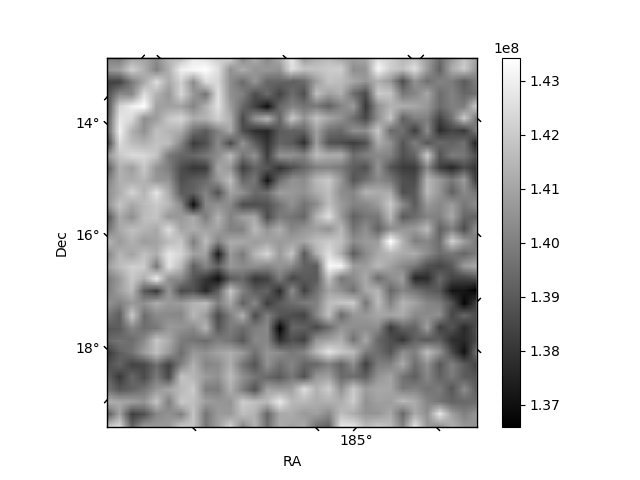
| Plot type | Count rate plots | Images |
|---|---|---|
| Comparison with Poisson distribution Blue bars denote a histogram of data divided into 1 sec bins. Red curve is a Poisson curve with rate = median count rate of data. |
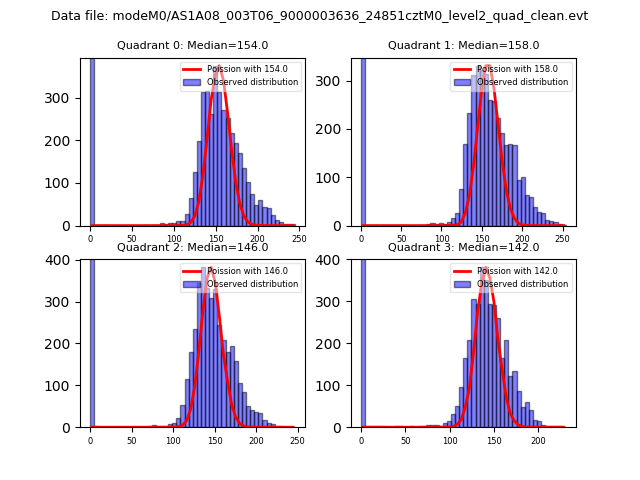 |
 |
| Quadrant-wise count rates Data is divided into 100 sec bins |
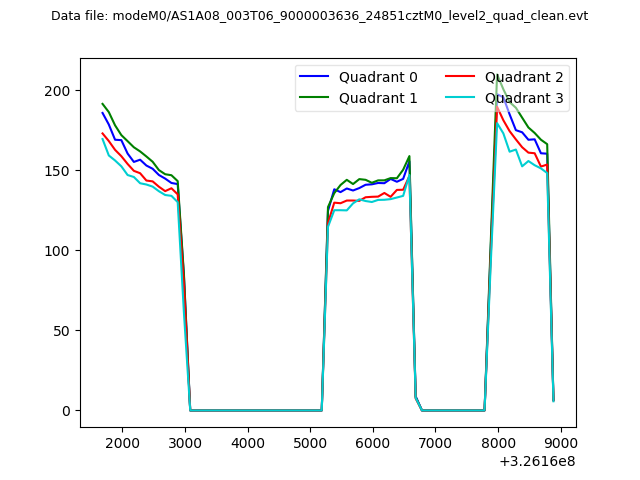 |
|
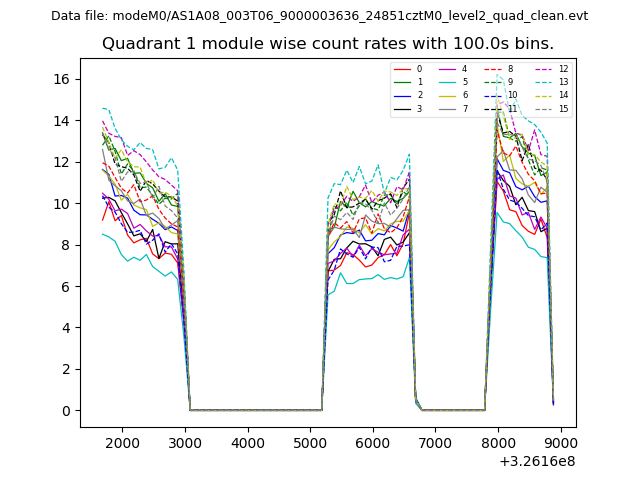
| Module-wise count rates for Quadrant A Data is divided into 100 sec bins |
 |
 |
| Module-wise count rates for Quadrant B Data is divided into 100 sec bins |
 |
 |
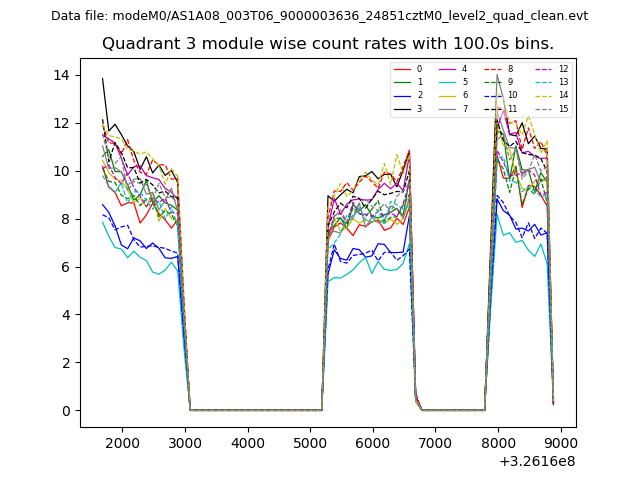
| Module-wise count rates for Quadrant C Data is divided into 100 sec bins |
 |
 |
| Module-wise count rates for Quadrant D Data is divided into 100 sec bins |
 |
 |
| Parameter | Plot |
|---|---|
| CZT HV Monitor | 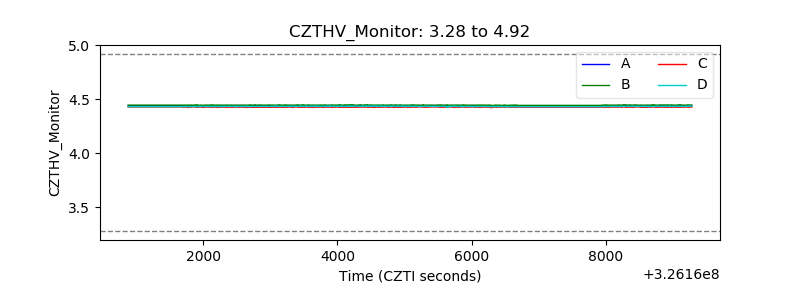 |
| D_VDD | 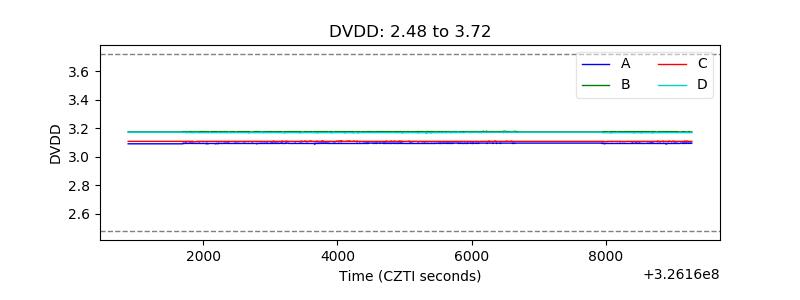 |
| Temperature 1 | 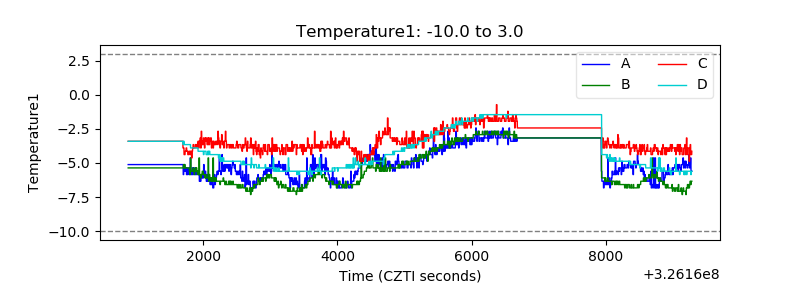 |
| Veto HV Monitor | 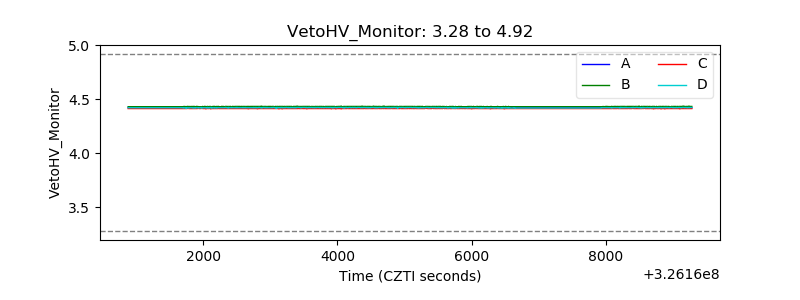 |
| Veto LLD | 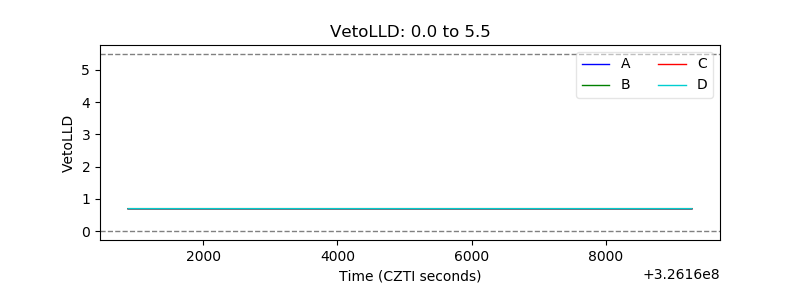 |
| Alpha Counter | 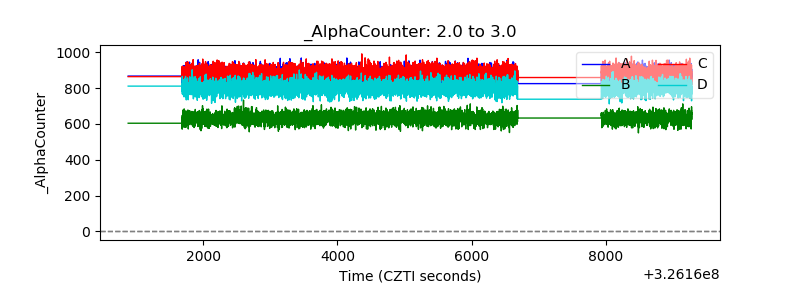 |
| _CPM_Rate | 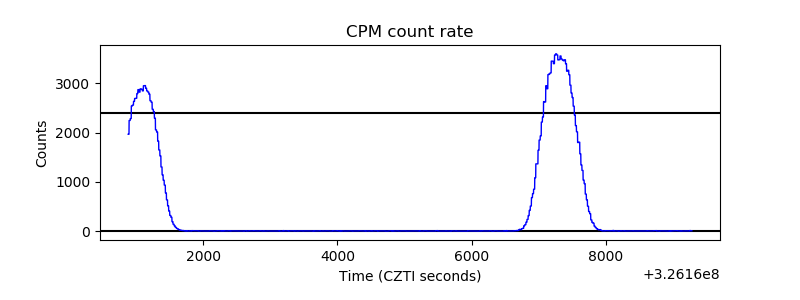 |
| CZT Counter | 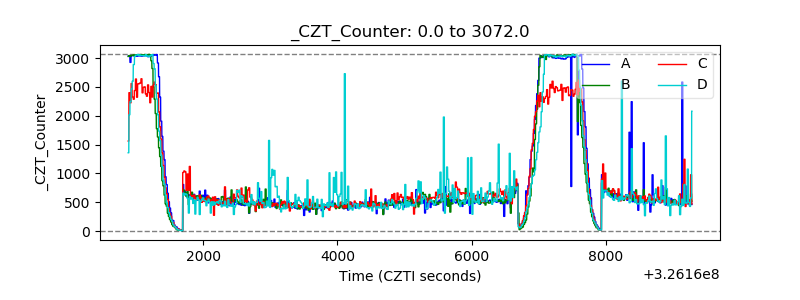 |
| +2.5 Volts monitor |  |
| +5 Volts monitor |  |
| _ROLL_ROT |  |
| _Roll_DEC | 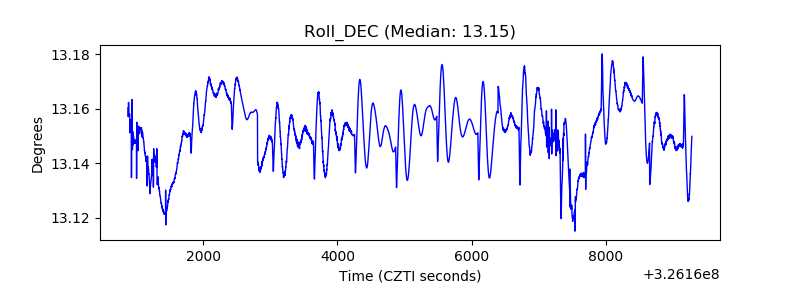 |
| _Roll_RA | 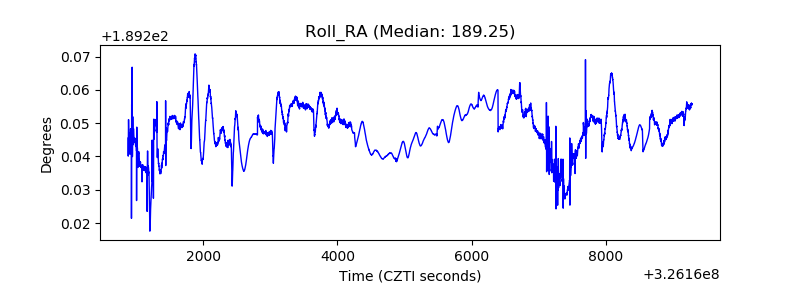 |
| Veto Counter |  |