| Param | Original file | Final file |
|---|---|---|
| Filename | modeM0/AS1A08_003T06_9000003636_24852cztM0_level2.evt | modeM0/AS1A08_003T06_9000003636_24852cztM0_level2_quad_clean.evt |
| Size (bytes) | 501,212,160 | 81,676,800 |
| Size | 478.0 MB | 77.9 MB |
| Events in quadrant A | 3,878,725 | 523,705 |
| Events in quadrant B | 3,362,586 | 543,126 |
| Events in quadrant C | 4,086,295 | 493,639 |
| Events in quadrant D | 3,430,378 | 479,260 |
| Mode SS | |||
|---|---|---|---|
| Quadrant | BADHDUFLAG | Total packets | Discarded packets |
| A | 0 | 126 | 0 |
| B | 0 | 126 | 0 |
| C | 0 | 126 | 0 |
| D | 0 | 126 | 0 |
| Mode M0 | |||
|---|---|---|---|
| Quadrant | BADHDUFLAG | Total packets | Discarded packets |
| A | 0 | 15187 | 2 |
| B | 0 | 13634 | 2 |
| C | 0 | 16309 | 2 |
| D | 0 | 14019 | 2 |
| Mode M9 | |||
|---|---|---|---|
| Quadrant | BADHDUFLAG | Total packets | Discarded packets |
| A | 0 | 22 | 0 |
| B | 0 | 23 | 0 |
| C | 0 | 23 | 0 |
| D | 0 | 23 | 0 |
| Quadrant | Total seconds | Saturated seconds | Saturation percentage |
|---|---|---|---|
| A | 6212 | 230 | 3.702511% |
| B | 6212 | 32 | 0.515132% |
| C | 6212 | 158 | 2.543464% |
| D | 6212 | 52 | 0.837090% |
Noise dominated data is calculated using 1-second bins in cleaned event files. If a bin has >2000 counts, and if more than 50% of those come from <1% of pixels, then it is considered to be noise-dominated and hence unusable.
| Quadrant | # 1 sec bins | Bins with >0 counts | Bins with >2000 counts | High rate bins dominated by noise | Noise dominated (total time) | Noise dominated (detector-on time) | Marked lightcurve |
|---|---|---|---|---|---|---|---|
| A | 7563 | 6214 | 207 | 207 | 2.74% | 3.33% | 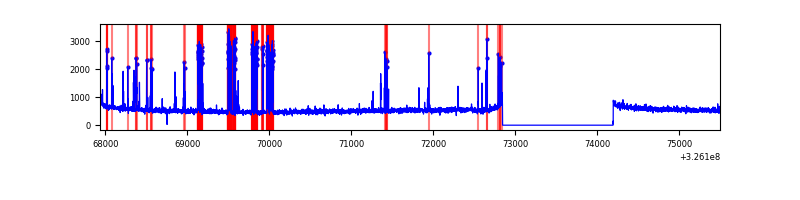 |
| B | 7563 | 6214 | 0 | 0 | 0.00% | 0.00% | 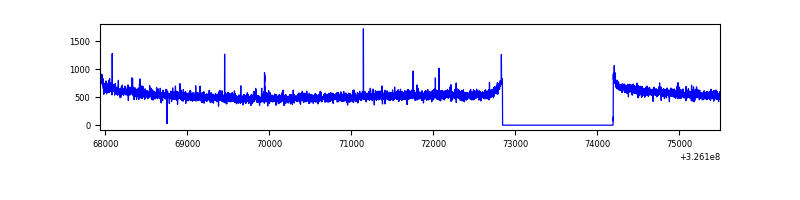 |
| C | 7563 | 6214 | 69 | 69 | 0.91% | 1.11% | 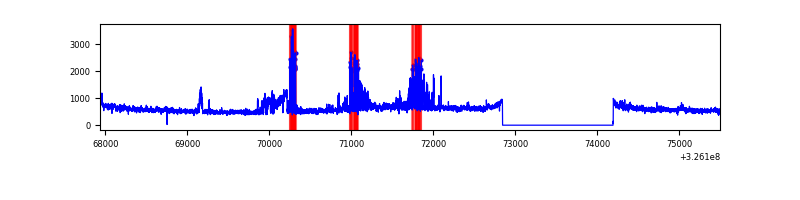 |
| D | 7563 | 6214 | 40 | 40 | 0.53% | 0.64% | 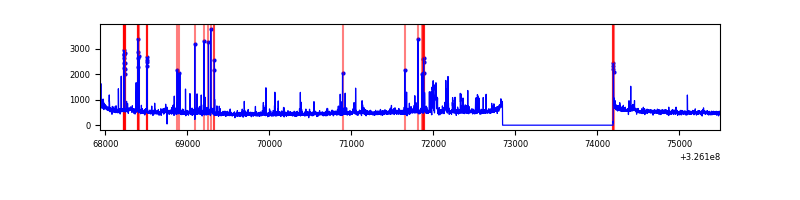 |
Top three noisy pixels from each quadrant. If the there are fewer than three noisy pixels in the level2.evt file, extra rows are filled as -1
| Pixel properties | Quadrant properties | ||||||
|---|---|---|---|---|---|---|---|
| Quadrant | DetID | PixID | Counts | Sigma | Mean | Median | Sigma |
| A | 6 | 16 | 644248 | 3851.77 | 839 | 827 | 167.0 |
| A | 13 | 254 | 9603 | 52.54 | 839 | 827 | 167.0 |
| A | 0 | 226 | 7263 | 38.53 | 839 | 827 | 167.0 |
| B | 12 | 111 | 19136 | 114.06 | 852 | 834 | 160.5 |
| B | 11 | 111 | 17236 | 102.22 | 852 | 834 | 160.5 |
| B | 14 | 111 | 16054 | 94.85 | 852 | 834 | 160.5 |
| C | 2 | 16 | 457306 | 2469.8 | 799 | 807 | 184.8 |
| C | 7 | 247 | 227736 | 1227.75 | 799 | 807 | 184.8 |
| C | 10 | 91 | 151043 | 812.82 | 799 | 807 | 184.8 |
| D | 1 | 52 | 358673 | 1853.33 | 801 | 781 | 193.1 |
| D | 2 | 234 | 21017 | 104.79 | 801 | 781 | 193.1 |
| D | 8 | 195 | 20069 | 99.88 | 801 | 781 | 193.1 |
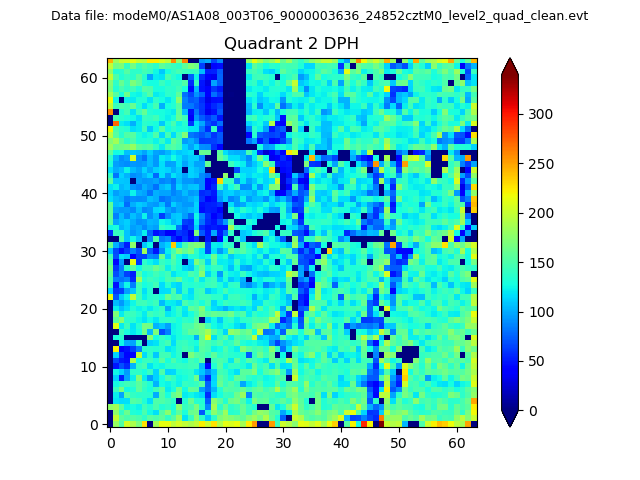
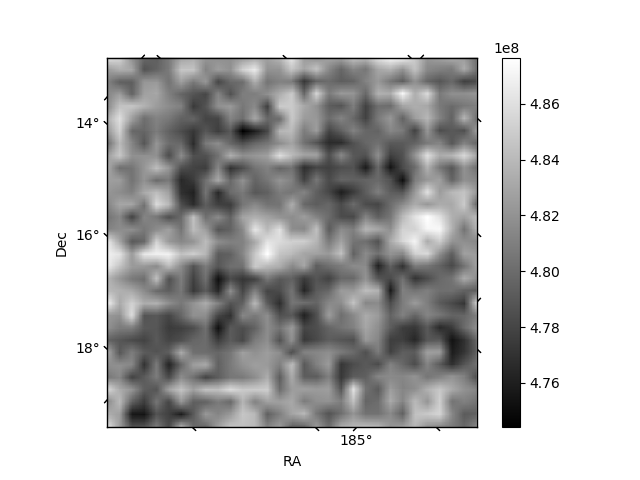
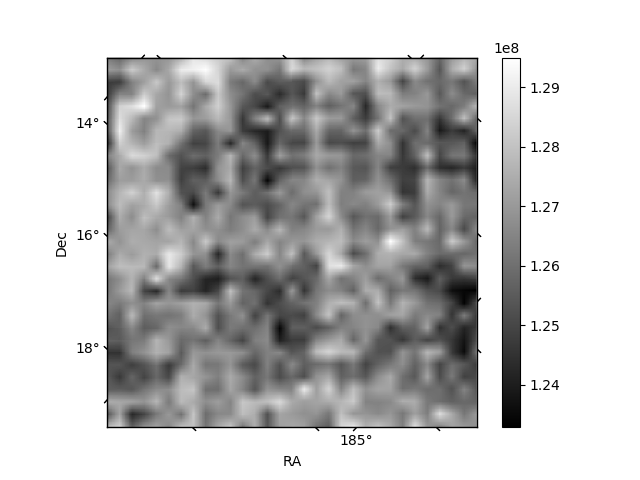
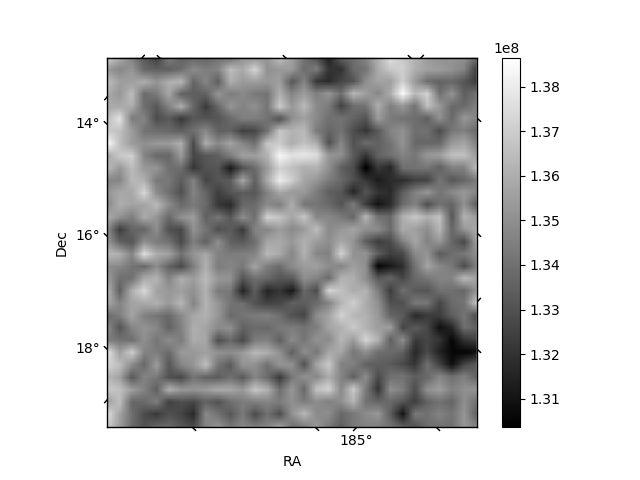
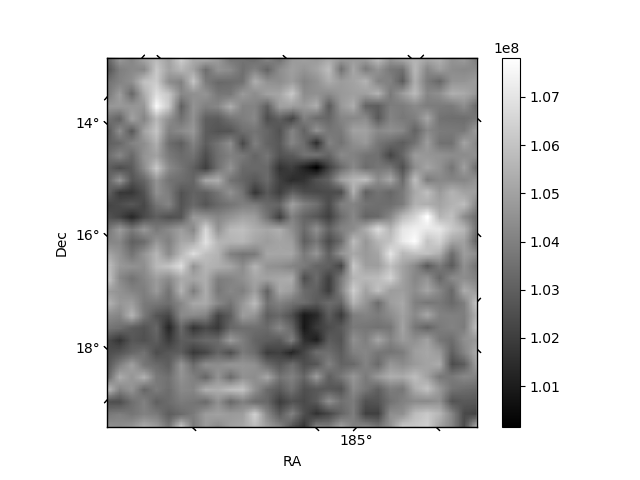
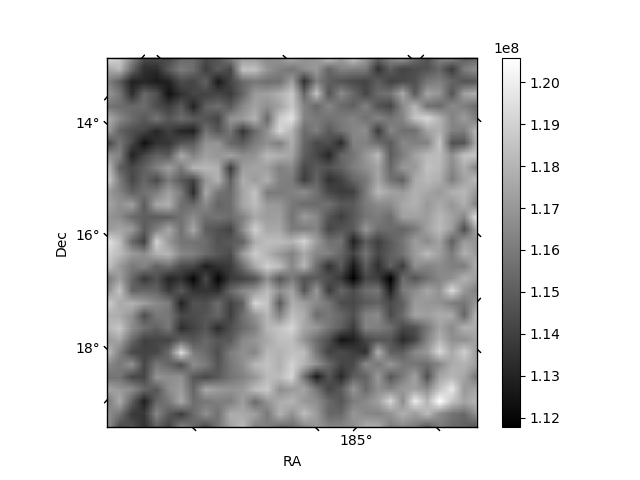
Histogram calculated using DETX and DETY for each event in the final _common_clean file
| Quadrant A | 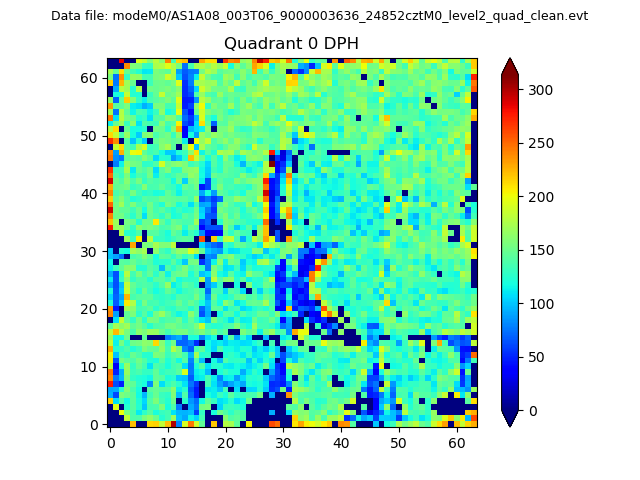 |
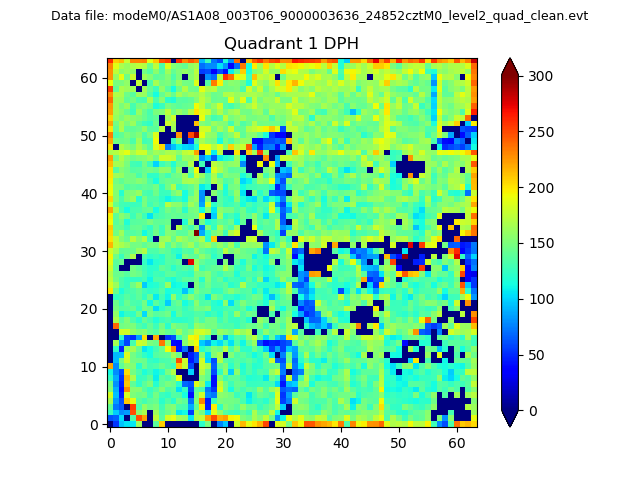 |
Quadrant B |
|---|---|---|---|
| Quadrant D | 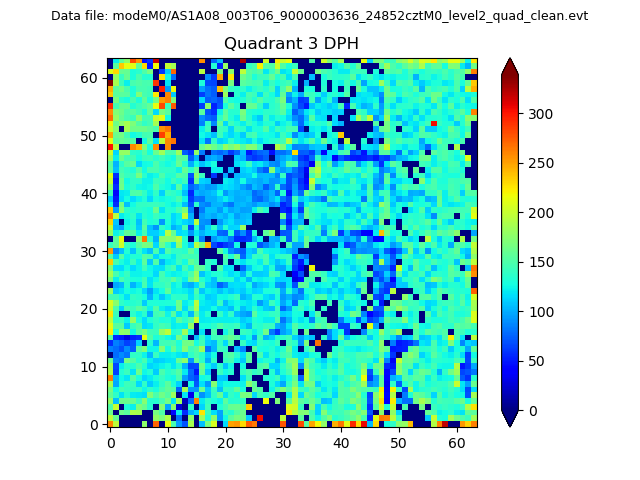 |
 |
Quadrant C |
| Plot type | Count rate plots | Images |
|---|---|---|
| Comparison with Poisson distribution Blue bars denote a histogram of data divided into 1 sec bins. Red curve is a Poisson curve with rate = median count rate of data. |
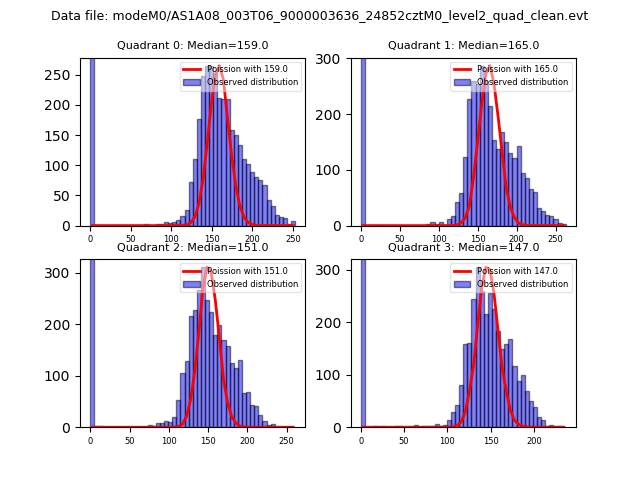 |
 |
| Quadrant-wise count rates Data is divided into 100 sec bins |
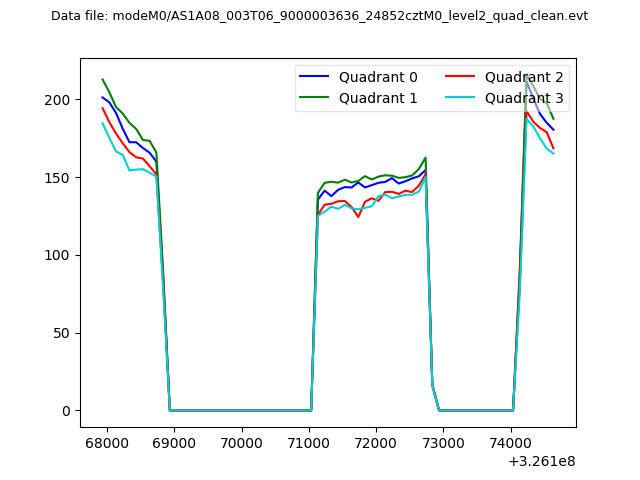 |
|
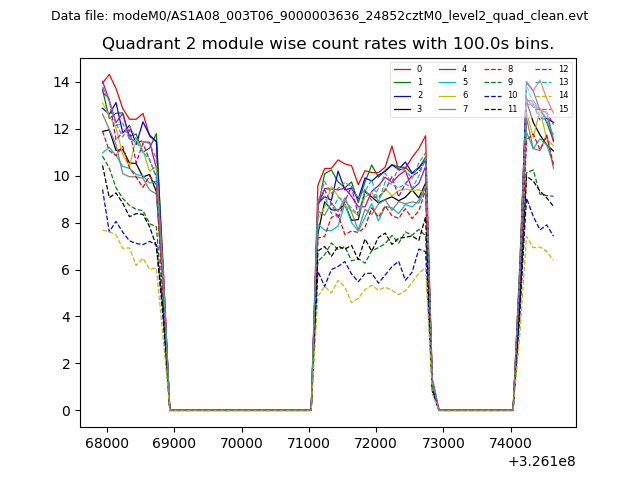
| Module-wise count rates for Quadrant A Data is divided into 100 sec bins |
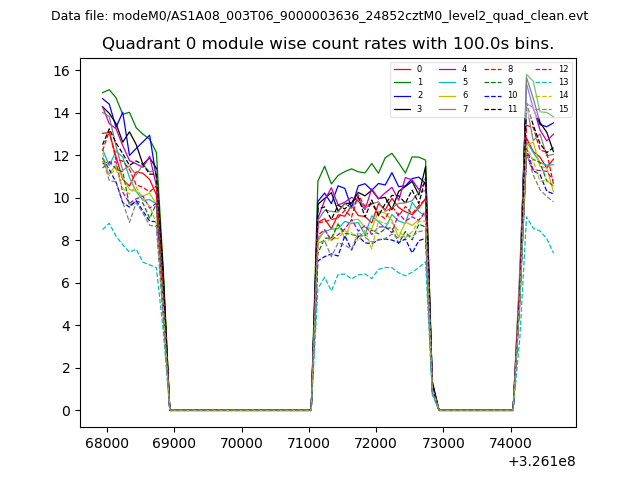 |
 |
| Module-wise count rates for Quadrant B Data is divided into 100 sec bins |
 |
 |
| Module-wise count rates for Quadrant C Data is divided into 100 sec bins |
 |
 |
| Module-wise count rates for Quadrant D Data is divided into 100 sec bins |
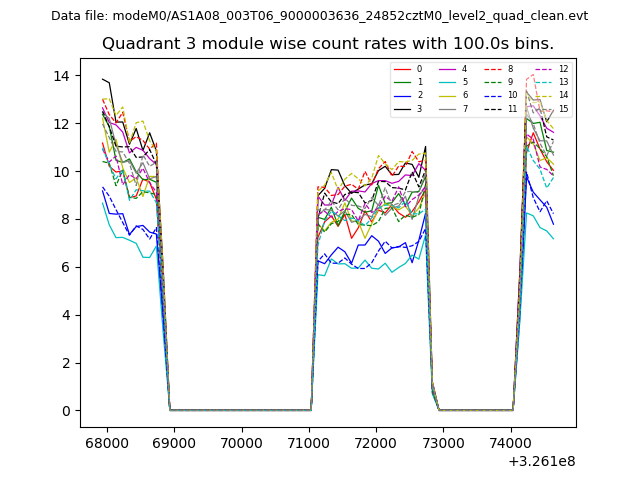 |
 |
| Parameter | Plot |
|---|---|
| CZT HV Monitor | 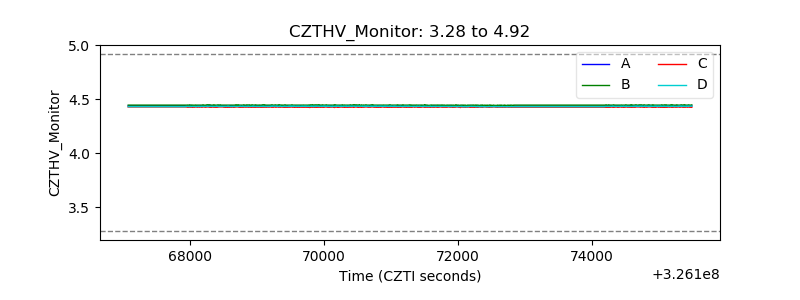 |
| D_VDD | 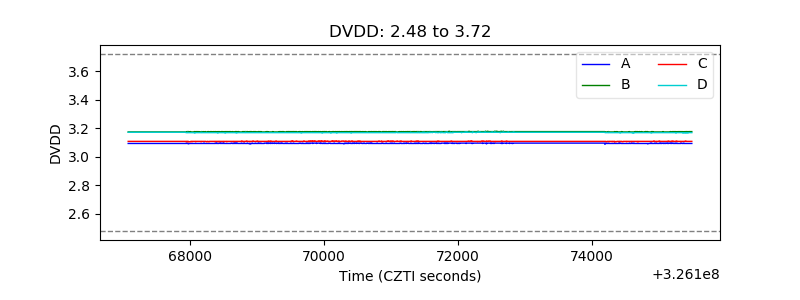 |
| Temperature 1 | 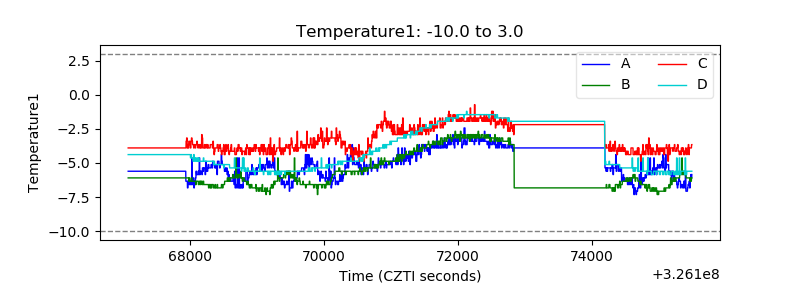 |
| Veto HV Monitor |  |
| Veto LLD | 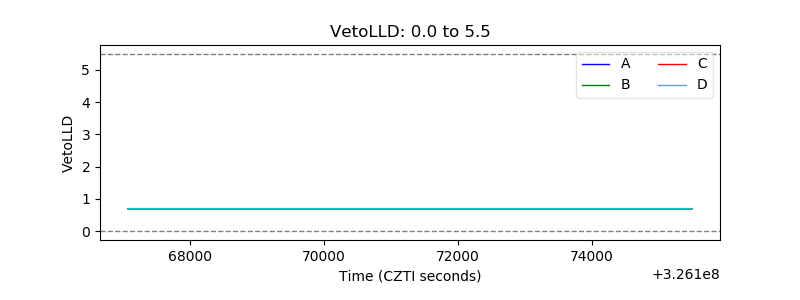 |
| Alpha Counter | 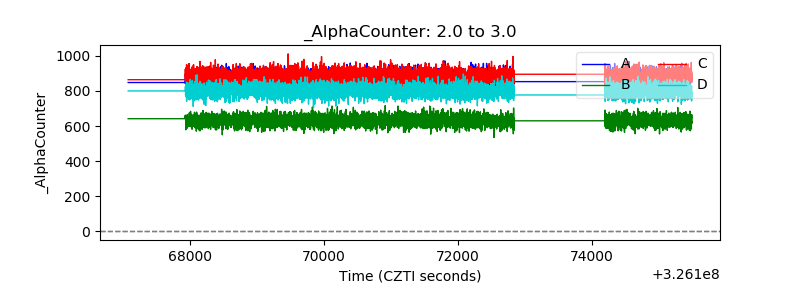 |
| _CPM_Rate | 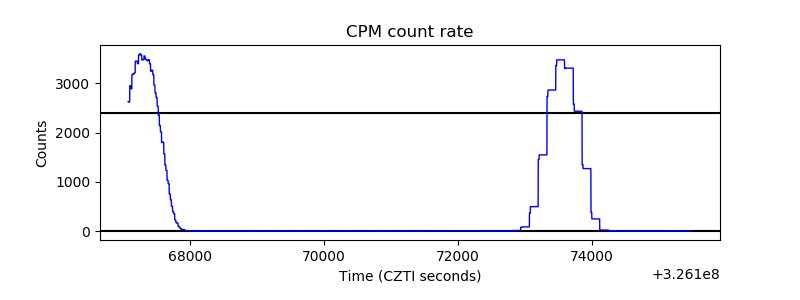 |
| CZT Counter | 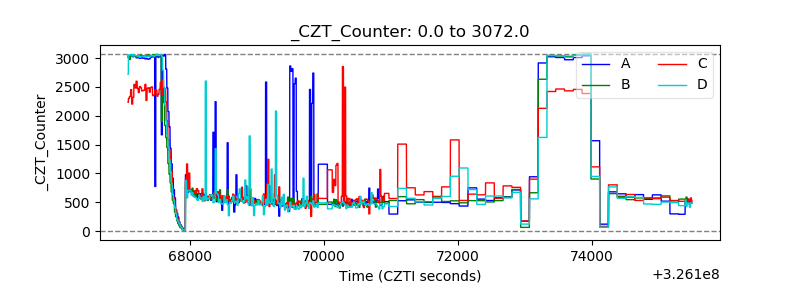 |
| +2.5 Volts monitor |  |
| +5 Volts monitor | 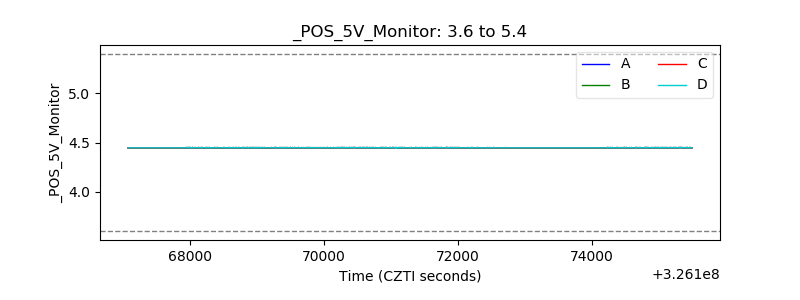 |
| _ROLL_ROT | 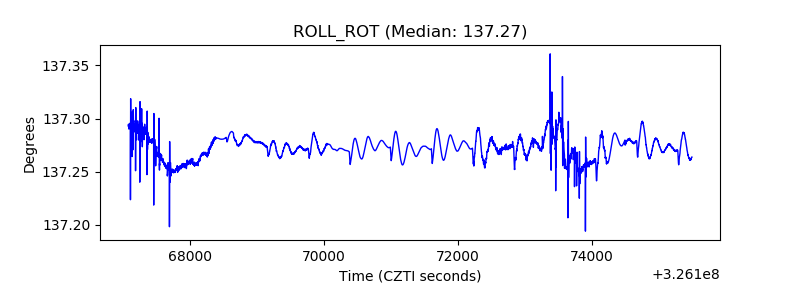 |
| _Roll_DEC | 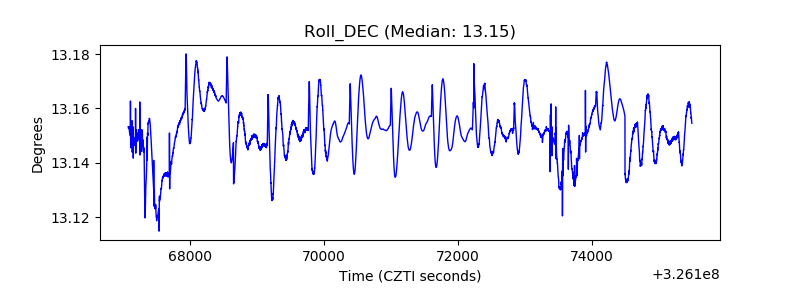 |
| _Roll_RA |  |
| Veto Counter |  |