| Param | Original file | Final file |
|---|---|---|
| Filename | modeM0/AS1A08_003T06_9000003636_24853cztM0_level2.evt | modeM0/AS1A08_003T06_9000003636_24853cztM0_level2_quad_clean.evt |
| Size (bytes) | 461,836,800 | 71,115,840 |
| Size | 440.4 MB | 67.8 MB |
| Events in quadrant A | 3,350,293 | 444,256 |
| Events in quadrant B | 3,358,575 | 457,880 |
| Events in quadrant C | 3,487,134 | 418,616 |
| Events in quadrant D | 3,379,005 | 408,815 |
| Mode SS | |||
|---|---|---|---|
| Quadrant | BADHDUFLAG | Total packets | Discarded packets |
| A | 0 | 122 | 0 |
| B | 0 | 122 | 0 |
| C | 0 | 122 | 0 |
| D | 0 | 122 | 0 |
| Mode M0 | |||
|---|---|---|---|
| Quadrant | BADHDUFLAG | Total packets | Discarded packets |
| A | 0 | 13413 | 2 |
| B | 0 | 13475 | 2 |
| C | 0 | 14050 | 2 |
| D | 0 | 13700 | 2 |
| Mode M9 | |||
|---|---|---|---|
| Quadrant | BADHDUFLAG | Total packets | Discarded packets |
| A | 0 | 14 | 0 |
| B | 0 | 14 | 0 |
| C | 0 | 14 | 0 |
| D | 0 | 14 | 0 |
| Quadrant | Total seconds | Saturated seconds | Saturation percentage |
|---|---|---|---|
| A | 6072 | 32 | 0.527009% |
| B | 6073 | 61 | 1.004446% |
| C | 6072 | 68 | 1.119895% |
| D | 6072 | 28 | 0.461133% |
Noise dominated data is calculated using 1-second bins in cleaned event files. If a bin has >2000 counts, and if more than 50% of those come from <1% of pixels, then it is considered to be noise-dominated and hence unusable.
| Quadrant | # 1 sec bins | Bins with >0 counts | Bins with >2000 counts | High rate bins dominated by noise | Noise dominated (total time) | Noise dominated (detector-on time) | Marked lightcurve |
|---|---|---|---|---|---|---|---|
| A | 7422 | 6073 | 0 | 0 | 0.00% | 0.00% | 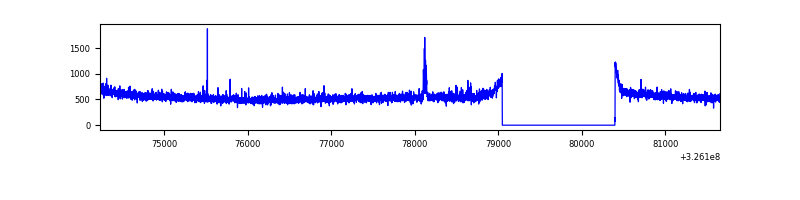 |
| B | 7423 | 6074 | 0 | 0 | 0.00% | 0.00% | 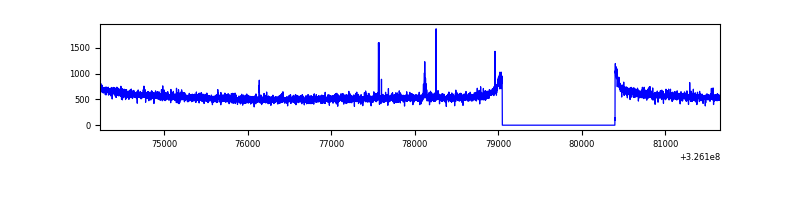 |
| C | 7422 | 6073 | 5 | 5 | 0.07% | 0.08% | 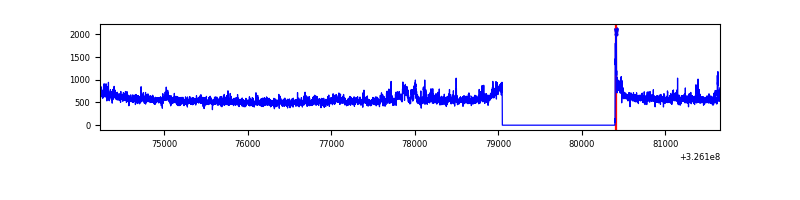 |
| D | 7422 | 6073 | 12 | 12 | 0.16% | 0.20% | 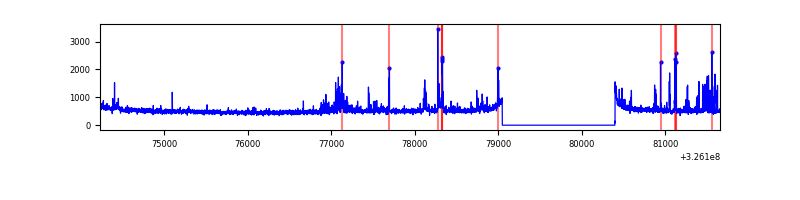 |
Top three noisy pixels from each quadrant. If the there are fewer than three noisy pixels in the level2.evt file, extra rows are filled as -1
| Pixel properties | Quadrant properties | ||||||
|---|---|---|---|---|---|---|---|
| Quadrant | DetID | PixID | Counts | Sigma | Mean | Median | Sigma |
| A | 6 | 16 | 35887 | 207.62 | 858 | 845 | 168.8 |
| A | 13 | 254 | 9096 | 48.89 | 858 | 845 | 168.8 |
| A | 0 | 226 | 7202 | 37.66 | 858 | 845 | 168.8 |
| B | 12 | 111 | 19131 | 114.71 | 852 | 834 | 159.5 |
| B | 11 | 111 | 16996 | 101.33 | 852 | 834 | 159.5 |
| B | 3 | 209 | 16473 | 98.05 | 852 | 834 | 159.5 |
| C | 7 | 247 | 172310 | 934.9 | 800 | 810 | 183.4 |
| C | 14 | 238 | 130685 | 707.99 | 800 | 810 | 183.4 |
| C | 2 | 16 | 45348 | 242.79 | 800 | 810 | 183.4 |
| D | 1 | 52 | 296537 | 1535.13 | 808 | 787 | 192.7 |
| D | 8 | 195 | 24067 | 120.84 | 808 | 787 | 192.7 |
| D | 2 | 234 | 20245 | 101.0 | 808 | 787 | 192.7 |
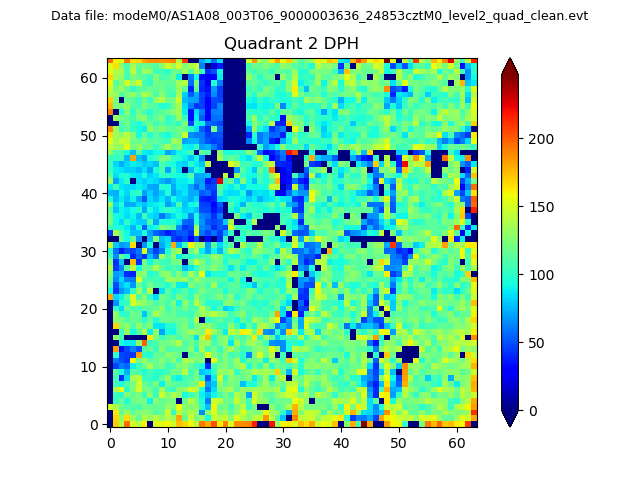
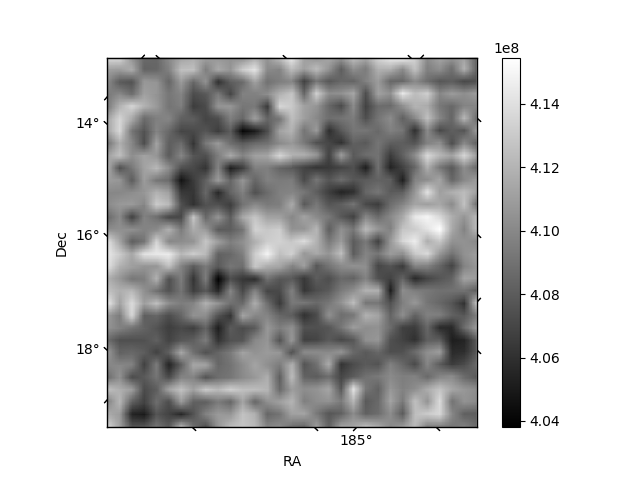
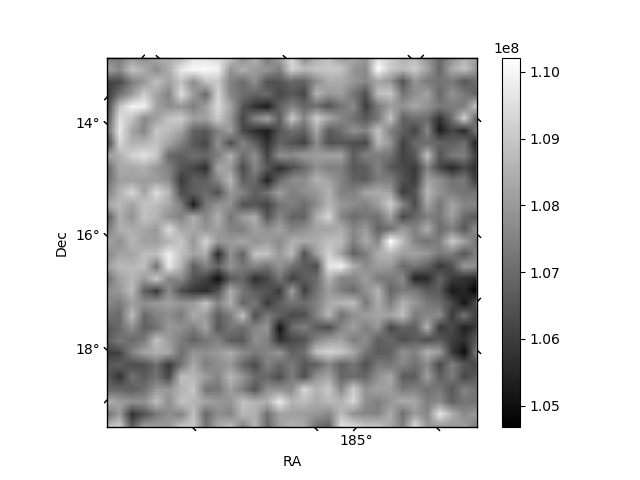
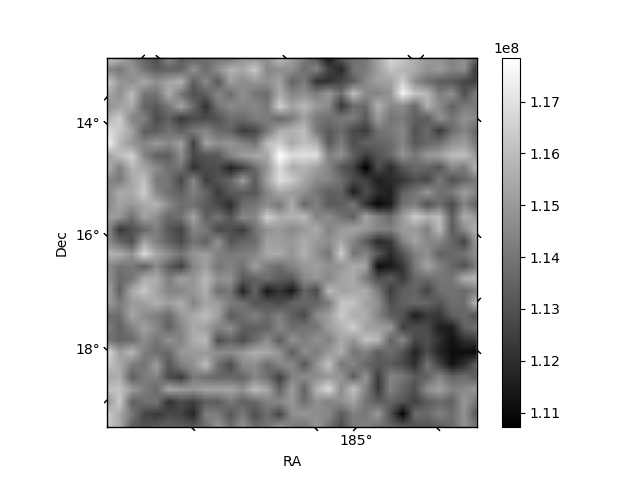
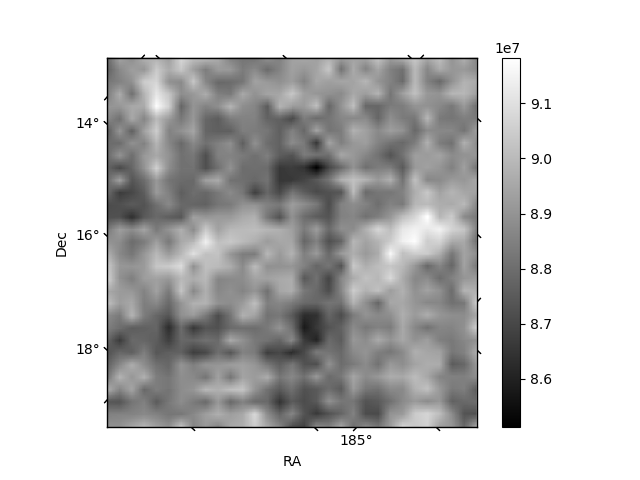
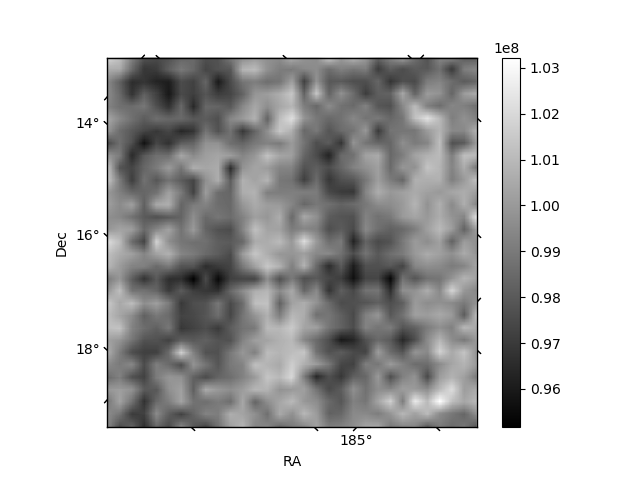
Histogram calculated using DETX and DETY for each event in the final _common_clean file
| Quadrant A | 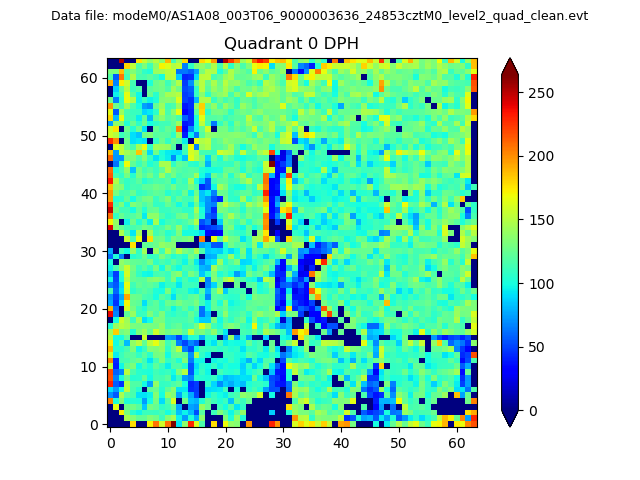 |
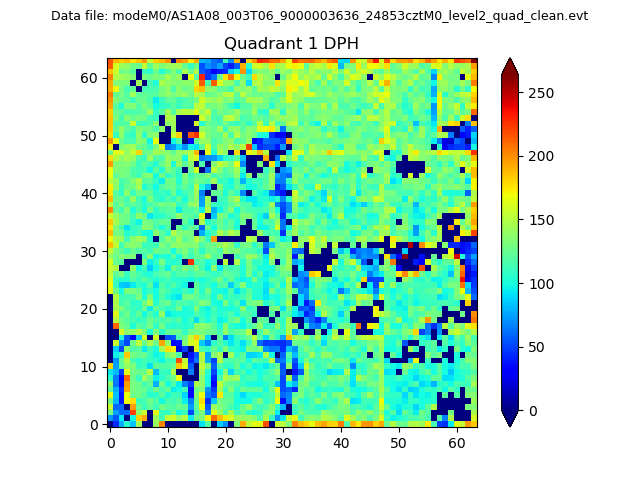 |
Quadrant B |
|---|---|---|---|
| Quadrant D | 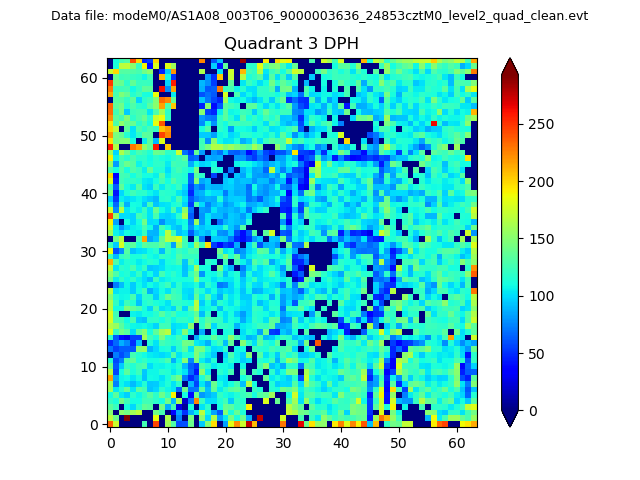 |
 |
Quadrant C |
| Plot type | Count rate plots | Images |
|---|---|---|
| Comparison with Poisson distribution Blue bars denote a histogram of data divided into 1 sec bins. Red curve is a Poisson curve with rate = median count rate of data. |
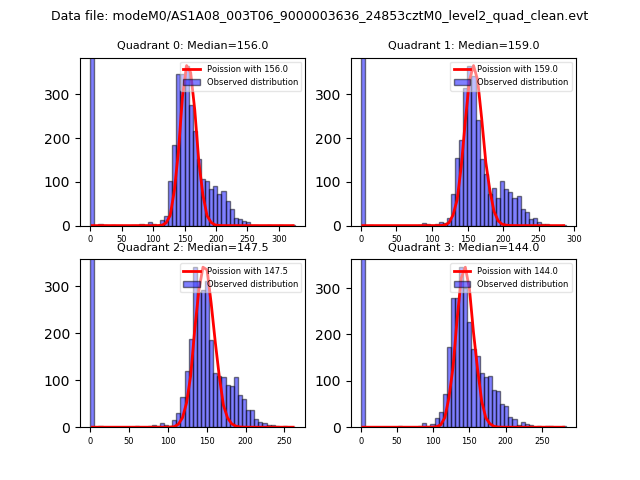 |
 |
| Quadrant-wise count rates Data is divided into 100 sec bins |
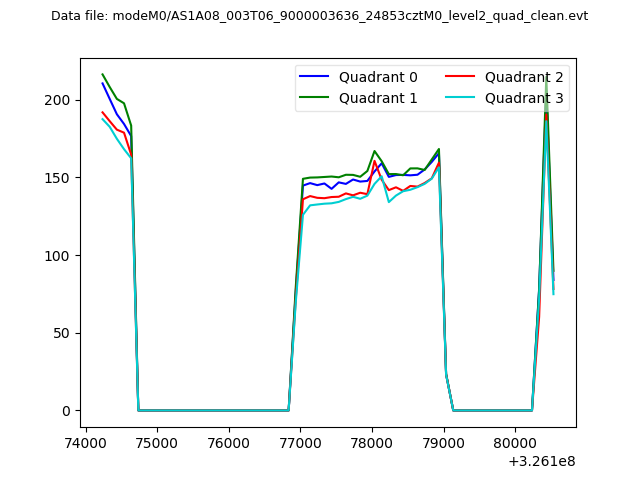 |
|
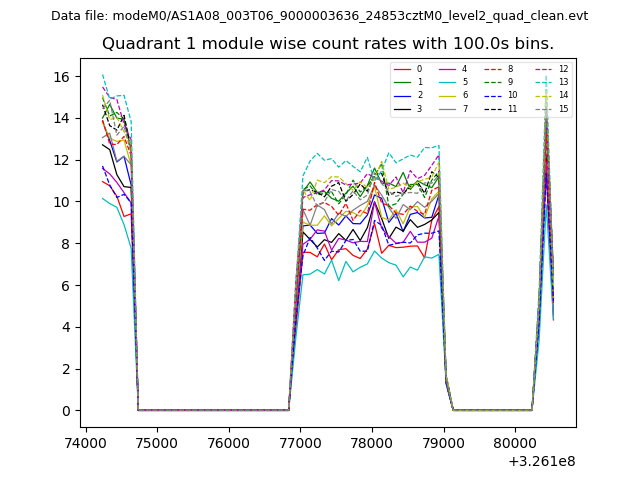
| Module-wise count rates for Quadrant A Data is divided into 100 sec bins |
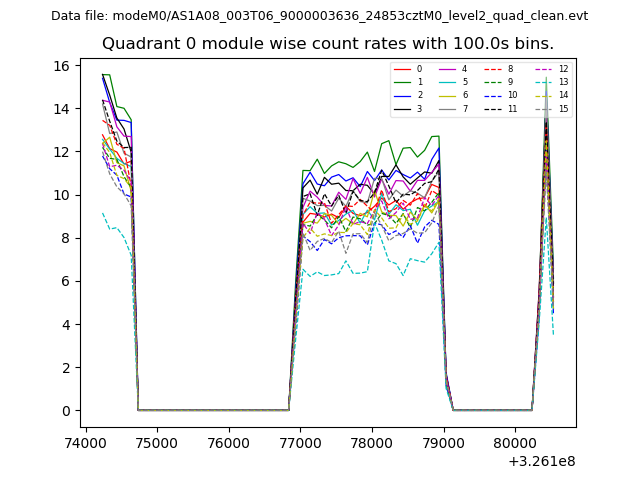 |
 |
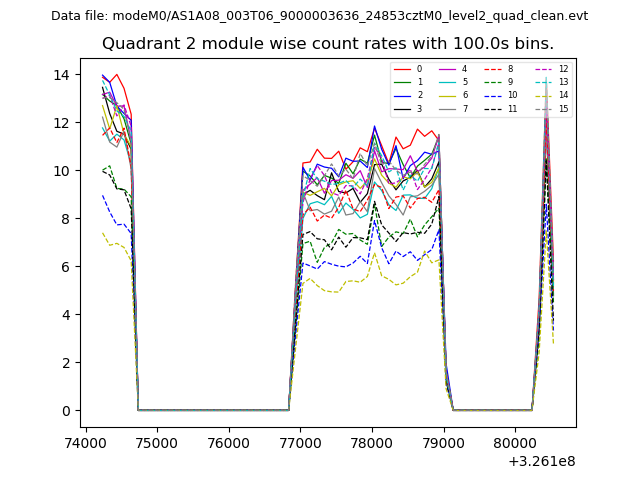
| Module-wise count rates for Quadrant B Data is divided into 100 sec bins |
 |
 |
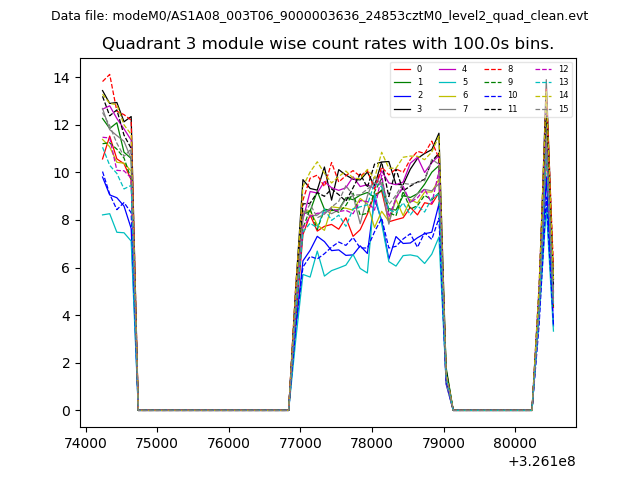
| Module-wise count rates for Quadrant C Data is divided into 100 sec bins |
 |
 |
| Module-wise count rates for Quadrant D Data is divided into 100 sec bins |
 |
 |
| Parameter | Plot |
|---|---|
| CZT HV Monitor | 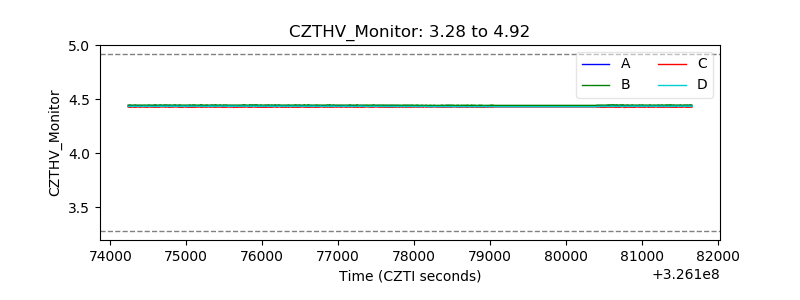 |
| D_VDD | 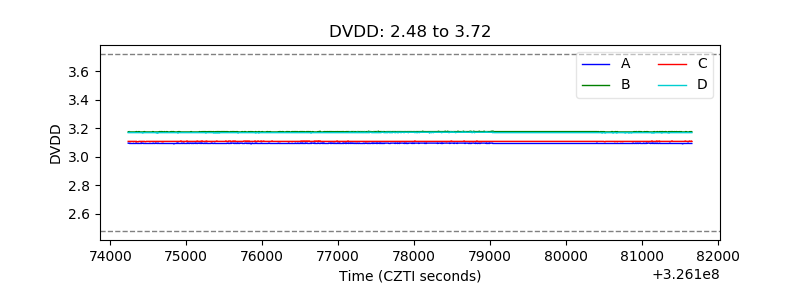 |
| Temperature 1 | 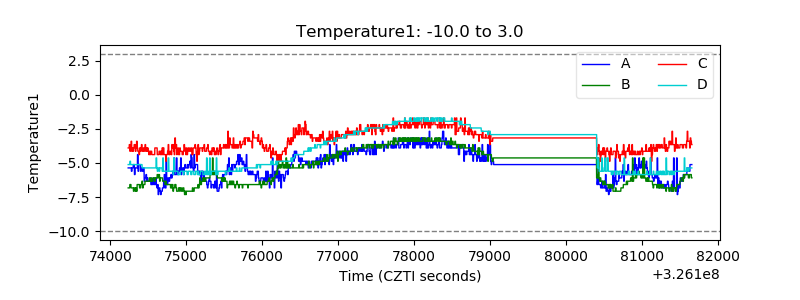 |
| Veto HV Monitor | 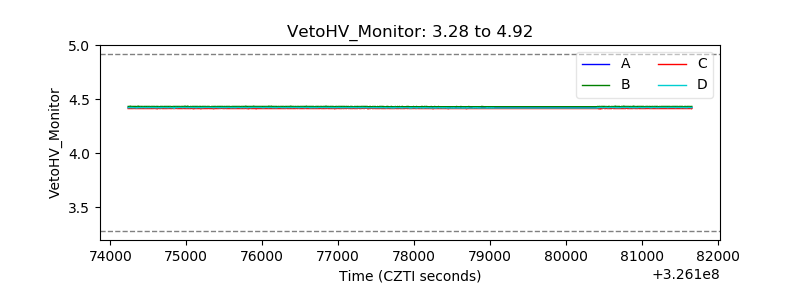 |
| Veto LLD | 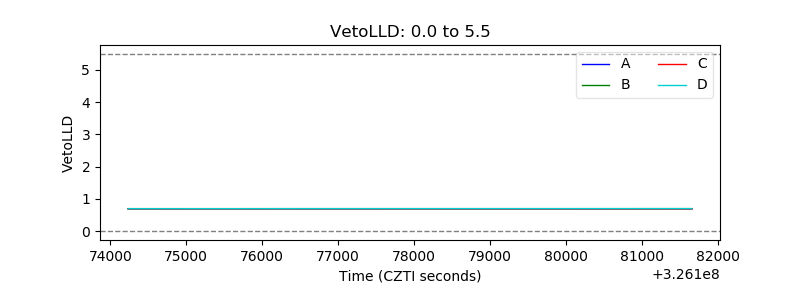 |
| Alpha Counter | 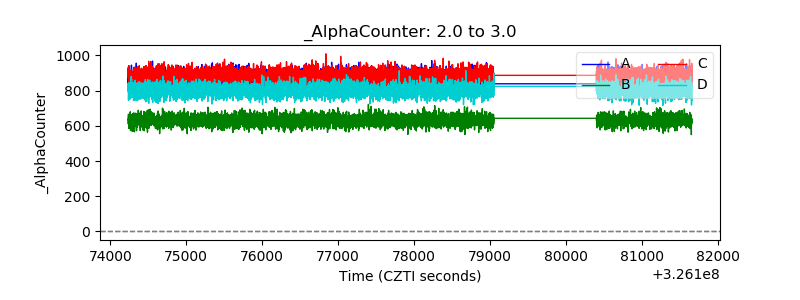 |
| _CPM_Rate | 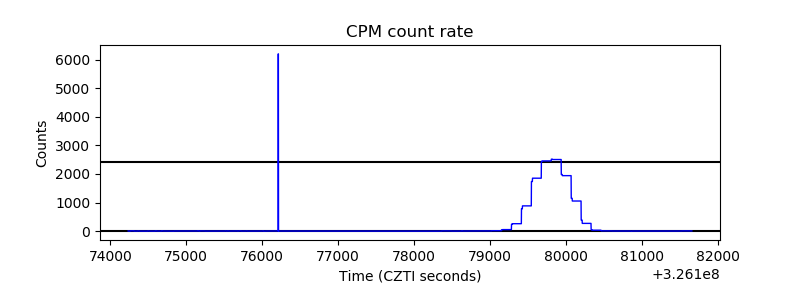 |
| CZT Counter | 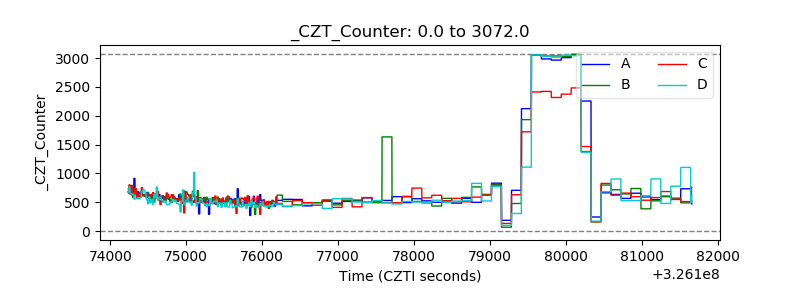 |
| +2.5 Volts monitor |  |
| +5 Volts monitor | 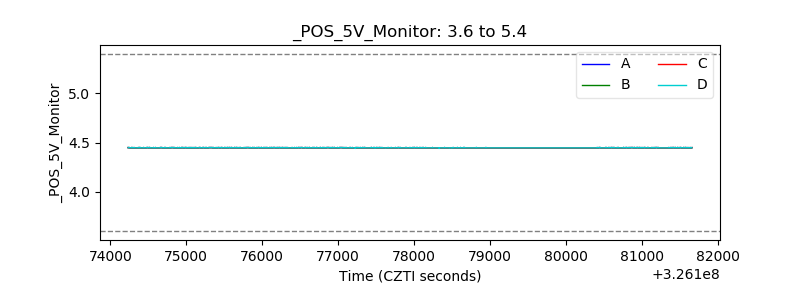 |
| _ROLL_ROT | 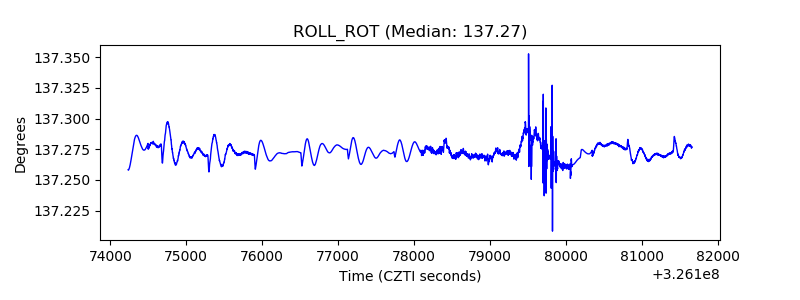 |
| _Roll_DEC | 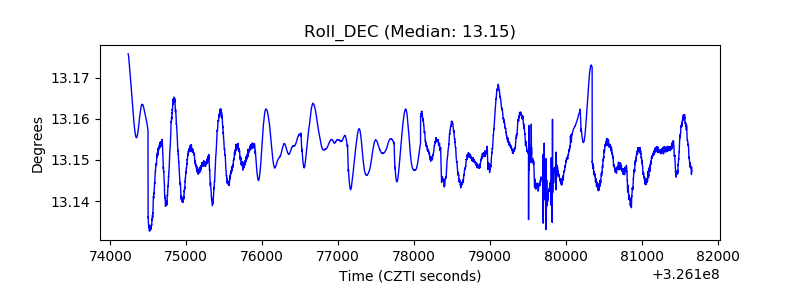 |
| _Roll_RA | 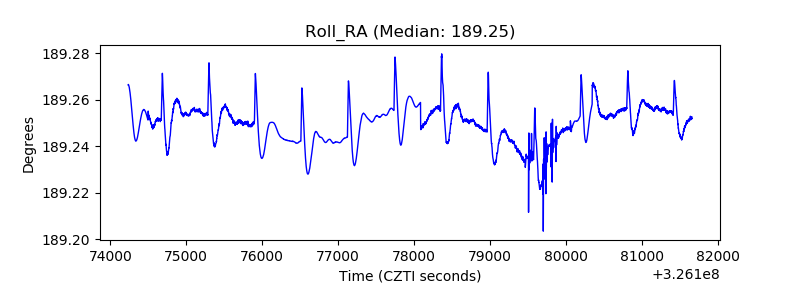 |
| Veto Counter | 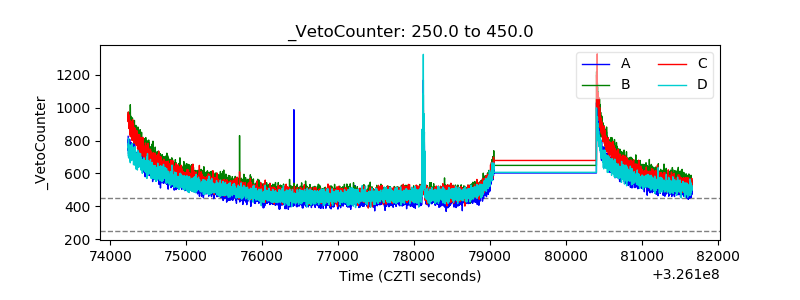 |