| Param | Original file | Final file |
|---|---|---|
| Filename | modeM0/AS1A08_003T06_9000003636_24855cztM0_level2.evt | modeM0/AS1A08_003T06_9000003636_24855cztM0_level2_quad_clean.evt |
| Size (bytes) | 562,461,120 | 72,132,480 |
| Size | 536.4 MB | 68.8 MB |
| Events in quadrant A | 3,646,264 | 448,685 |
| Events in quadrant B | 3,339,511 | 461,352 |
| Events in quadrant C | 5,672,501 | 409,657 |
| Events in quadrant D | 3,944,195 | 419,851 |
| Mode SS | |||
|---|---|---|---|
| Quadrant | BADHDUFLAG | Total packets | Discarded packets |
| A | 0 | 130 | 0 |
| B | 0 | 130 | 0 |
| C | 0 | 130 | 0 |
| D | 0 | 130 | 0 |
| Mode M0 | |||
|---|---|---|---|
| Quadrant | BADHDUFLAG | Total packets | Discarded packets |
| A | 0 | 14433 | 1 |
| B | 0 | 13439 | 1 |
| C | 0 | 21286 | 1 |
| D | 0 | 15651 | 1 |
| Mode M9 | |||
|---|---|---|---|
| Quadrant | BADHDUFLAG | Total packets | Discarded packets |
| A | 0 | 10 | 0 |
| B | 0 | 10 | 0 |
| C | 0 | 10 | 0 |
| D | 0 | 10 | 0 |
| Quadrant | Total seconds | Saturated seconds | Saturation percentage |
|---|---|---|---|
| A | 6366 | 196 | 3.078856% |
| B | 6366 | 109 | 1.712221% |
| C | 6367 | 799 | 12.549081% |
| D | 6366 | 200 | 3.141690% |
Noise dominated data is calculated using 1-second bins in cleaned event files. If a bin has >2000 counts, and if more than 50% of those come from <1% of pixels, then it is considered to be noise-dominated and hence unusable.
| Quadrant | # 1 sec bins | Bins with >0 counts | Bins with >2000 counts | High rate bins dominated by noise | Noise dominated (total time) | Noise dominated (detector-on time) | Marked lightcurve |
|---|---|---|---|---|---|---|---|
| A | 7416 | 6367 | 98 | 98 | 1.32% | 1.54% | 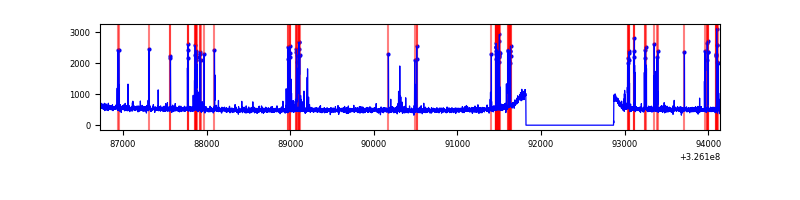 |
| B | 7416 | 6367 | 0 | 0 | 0.00% | 0.00% | 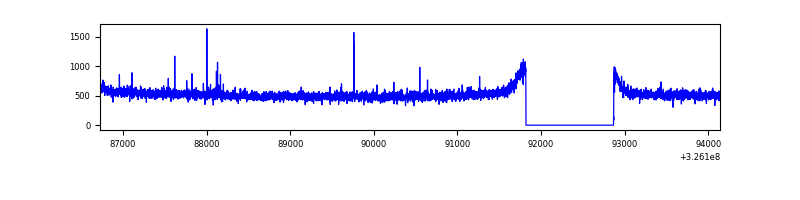 |
| C | 7417 | 6368 | 573 | 573 | 7.73% | 9.00% | 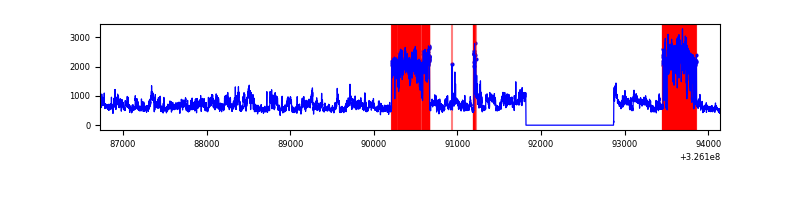 |
| D | 7416 | 6367 | 136 | 136 | 1.83% | 2.14% | 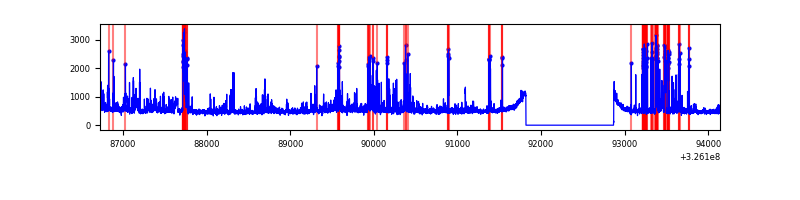 |
Top three noisy pixels from each quadrant. If the there are fewer than three noisy pixels in the level2.evt file, extra rows are filled as -1
| Pixel properties | Quadrant properties | ||||||
|---|---|---|---|---|---|---|---|
| Quadrant | DetID | PixID | Counts | Sigma | Mean | Median | Sigma |
| A | 6 | 16 | 368182 | 2156.36 | 850 | 835 | 170.4 |
| A | 13 | 254 | 9322 | 49.82 | 850 | 835 | 170.4 |
| A | 3 | 137 | 7731 | 40.48 | 850 | 835 | 170.4 |
| B | 12 | 111 | 19808 | 117.65 | 846 | 825 | 161.4 |
| B | 11 | 111 | 18084 | 106.96 | 846 | 825 | 161.4 |
| B | 14 | 111 | 17196 | 101.46 | 846 | 825 | 161.4 |
| C | 7 | 247 | 1720157 | 9594.99 | 769 | 776 | 179.2 |
| C | 2 | 16 | 740245 | 4126.6 | 769 | 776 | 179.2 |
| C | 14 | 238 | 123280 | 683.63 | 769 | 776 | 179.2 |
| D | 1 | 52 | 739640 | 3782.37 | 807 | 785 | 195.3 |
| D | 8 | 195 | 102750 | 521.98 | 807 | 785 | 195.3 |
| D | 12 | 218 | 28925 | 144.06 | 807 | 785 | 195.3 |
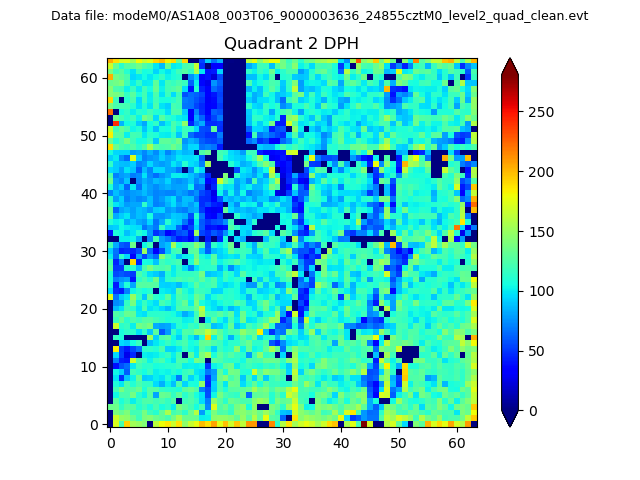
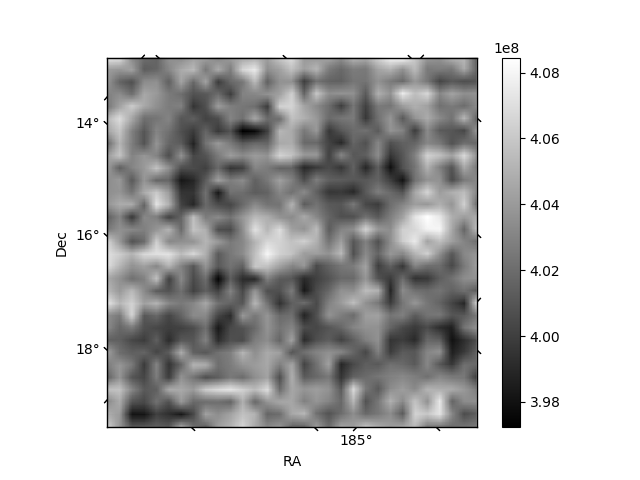
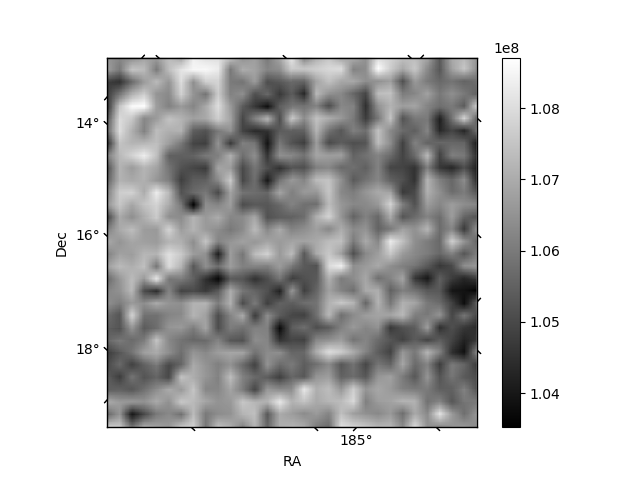
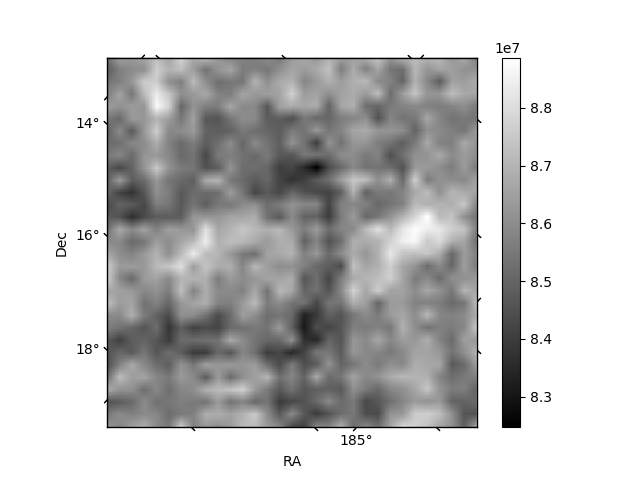
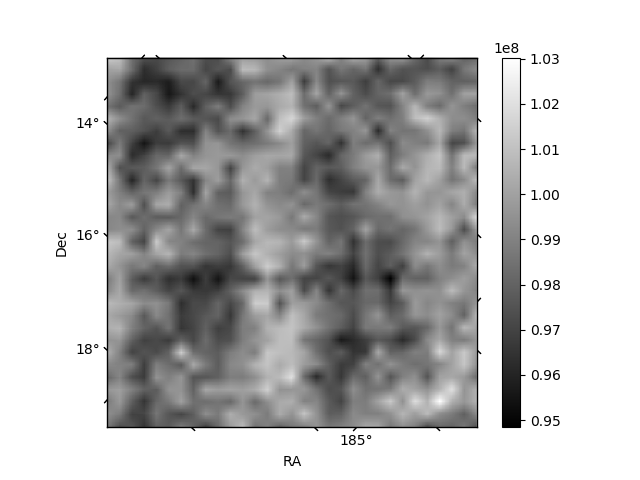
Histogram calculated using DETX and DETY for each event in the final _common_clean file
| Quadrant A | 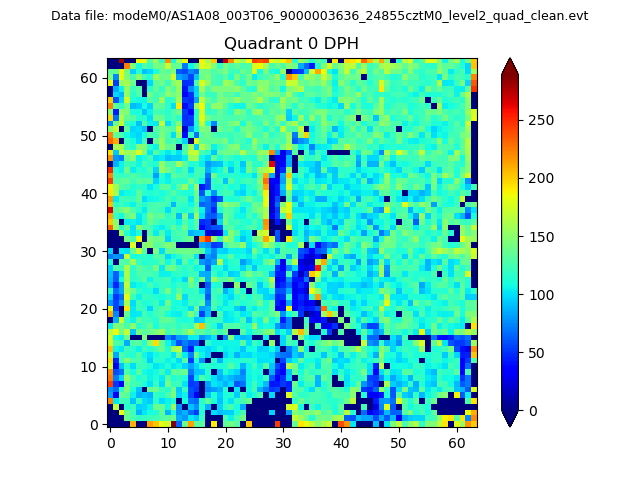 |
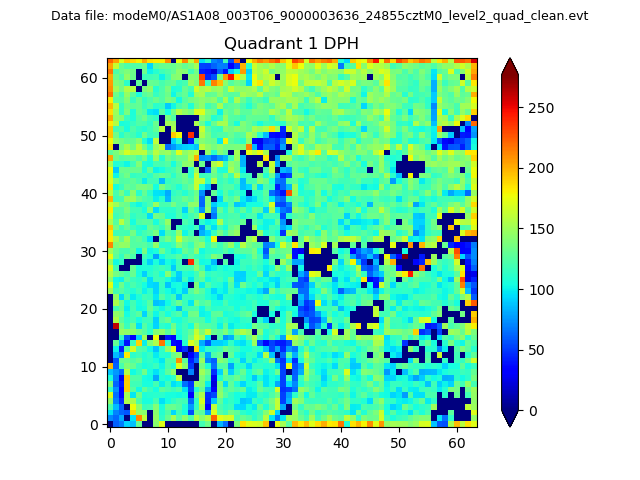 |
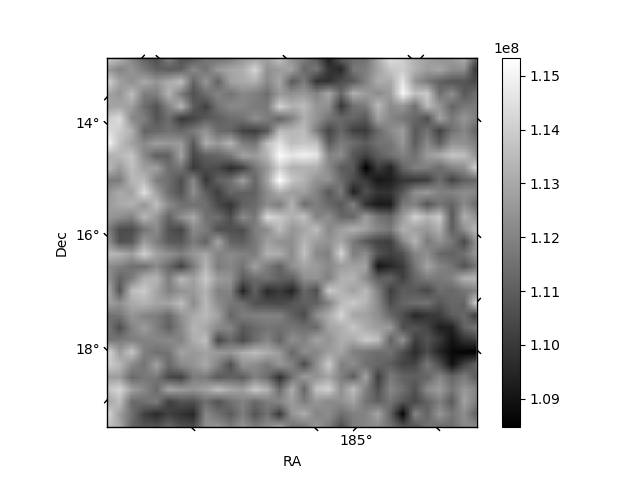
Quadrant B |
|---|---|---|---|
| Quadrant D | 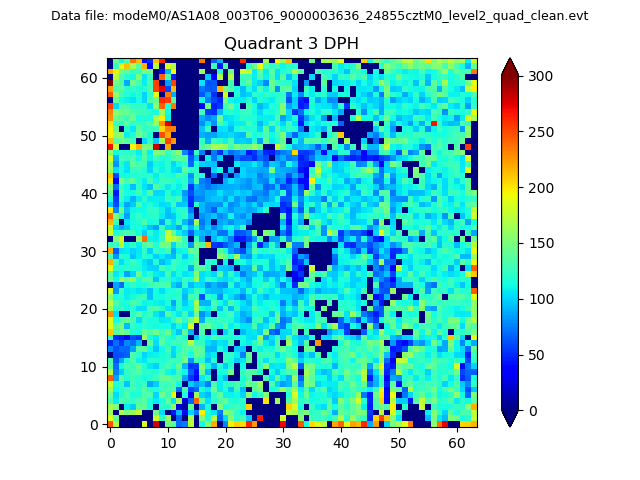 |
 |
Quadrant C |
| Plot type | Count rate plots | Images |
|---|---|---|
| Comparison with Poisson distribution Blue bars denote a histogram of data divided into 1 sec bins. Red curve is a Poisson curve with rate = median count rate of data. |
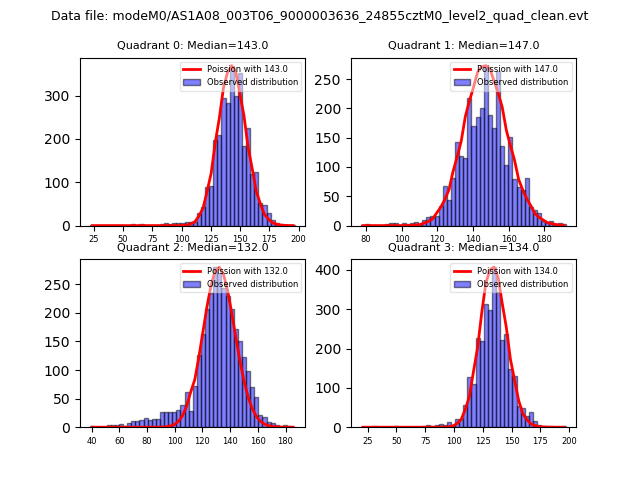 |
 |
| Quadrant-wise count rates Data is divided into 100 sec bins |
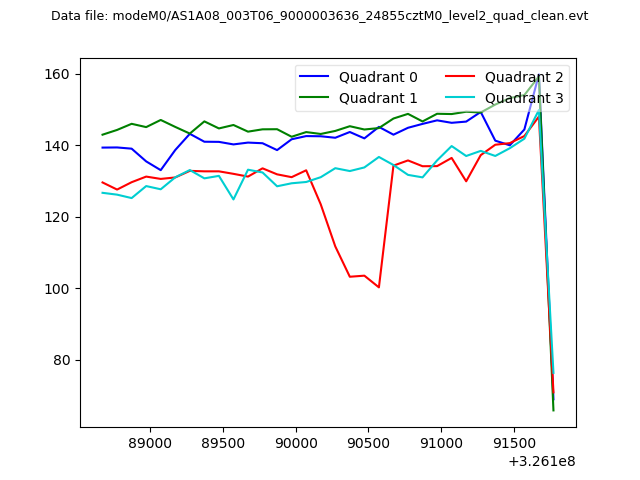 |
|
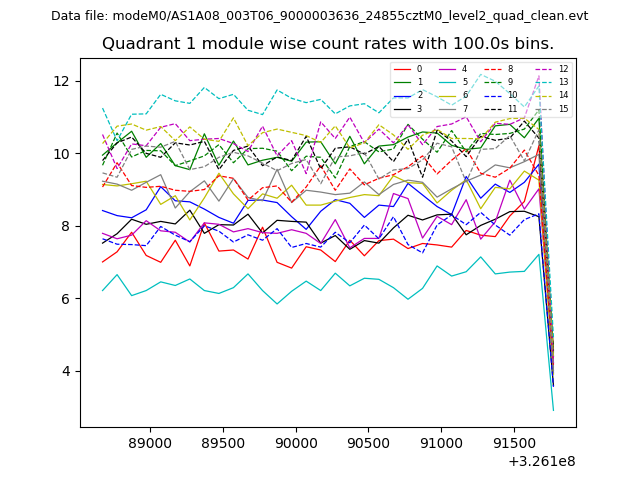
| Module-wise count rates for Quadrant A Data is divided into 100 sec bins |
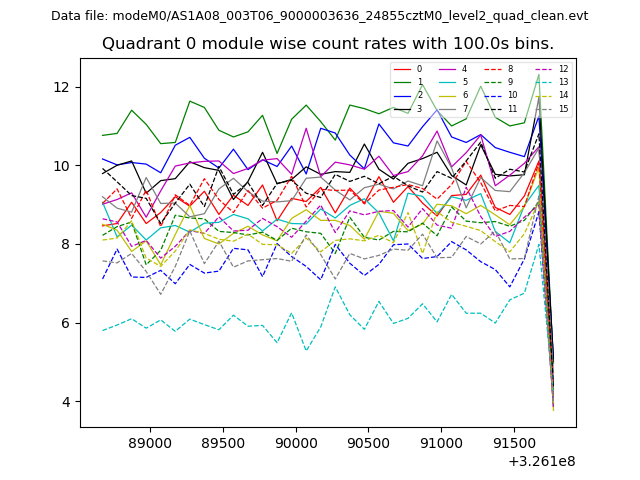 |
 |
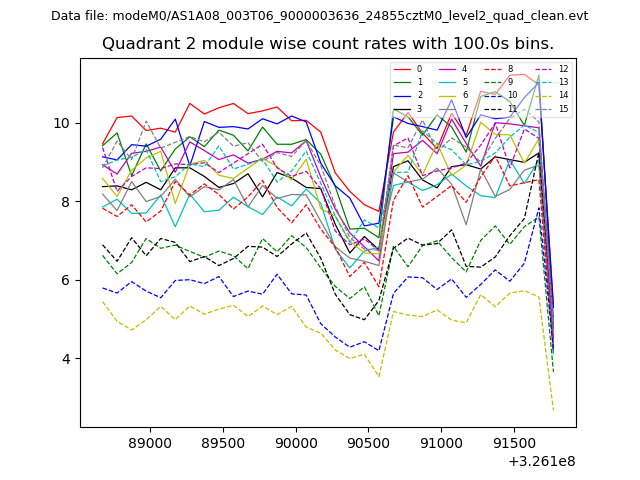
| Module-wise count rates for Quadrant B Data is divided into 100 sec bins |
 |
 |
| Module-wise count rates for Quadrant C Data is divided into 100 sec bins |
 |
 |
| Module-wise count rates for Quadrant D Data is divided into 100 sec bins |
 |
 |
| Parameter | Plot |
|---|---|
| CZT HV Monitor | 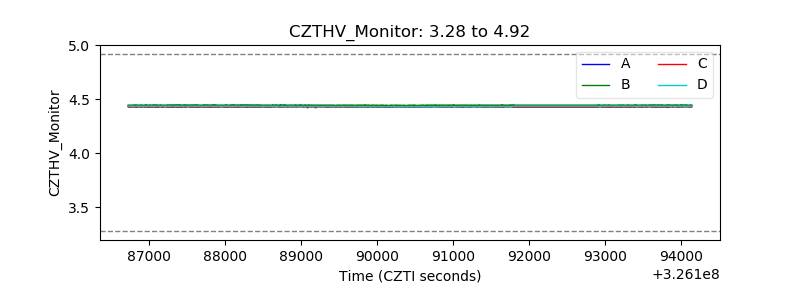 |
| D_VDD | 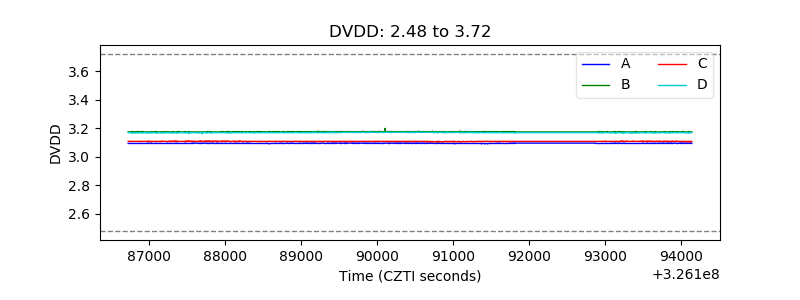 |
| Temperature 1 | 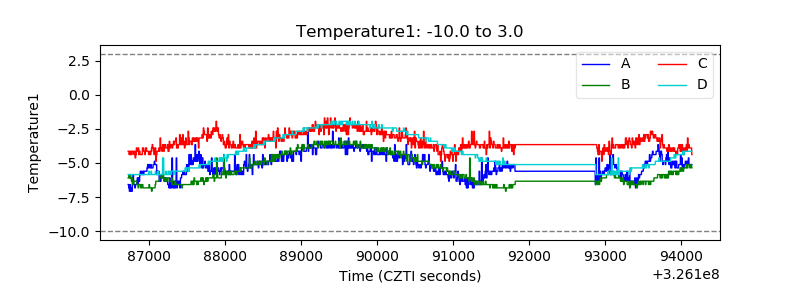 |
| Veto HV Monitor | 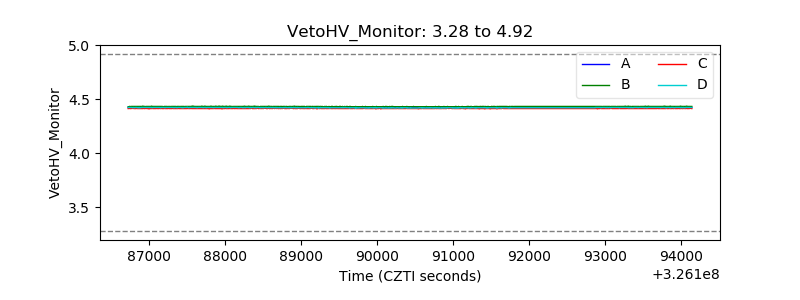 |
| Veto LLD | 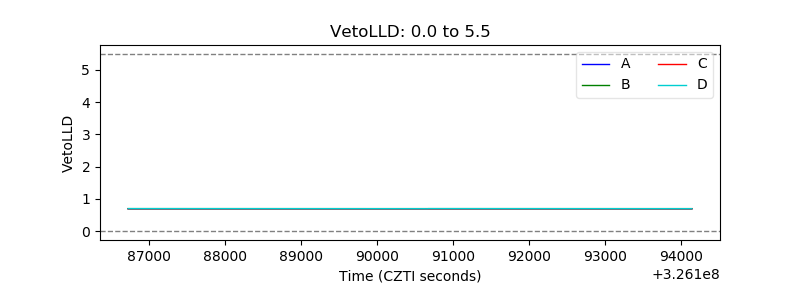 |
| Alpha Counter | 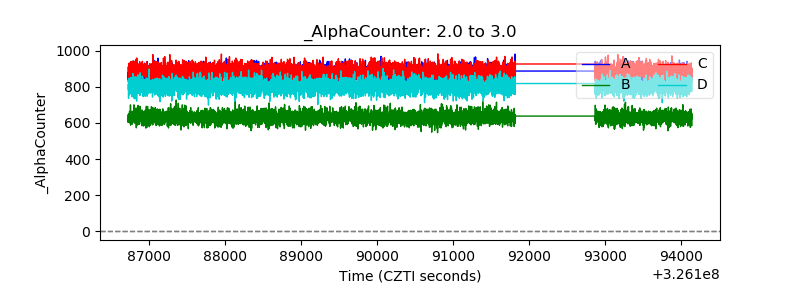 |
| _CPM_Rate | 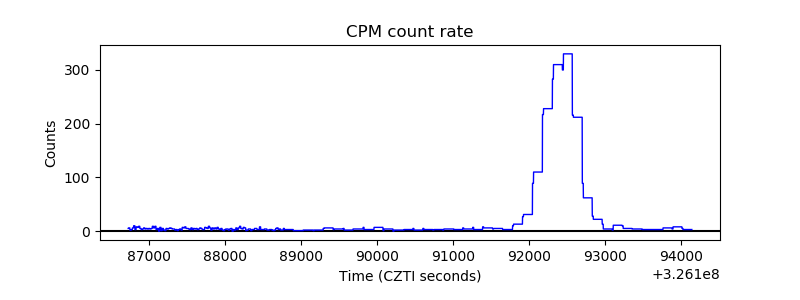 |
| CZT Counter | 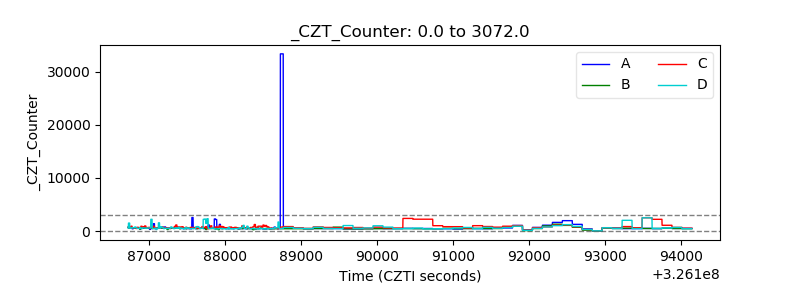 |
| +2.5 Volts monitor |  |
| +5 Volts monitor |  |
| _ROLL_ROT | 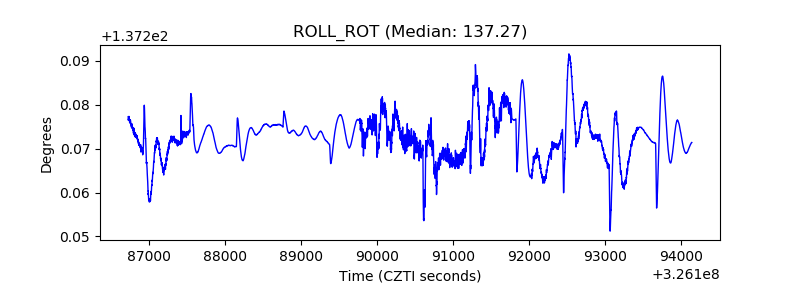 |
| _Roll_DEC | 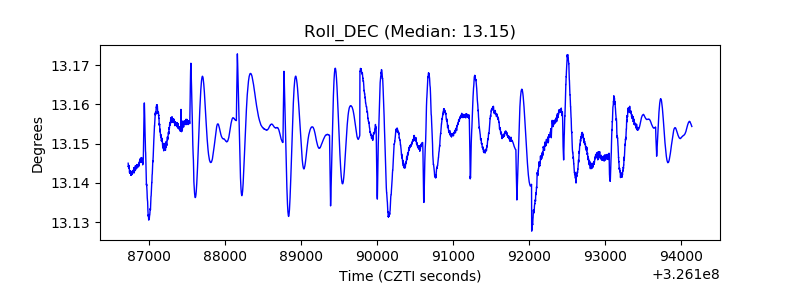 |
| _Roll_RA | 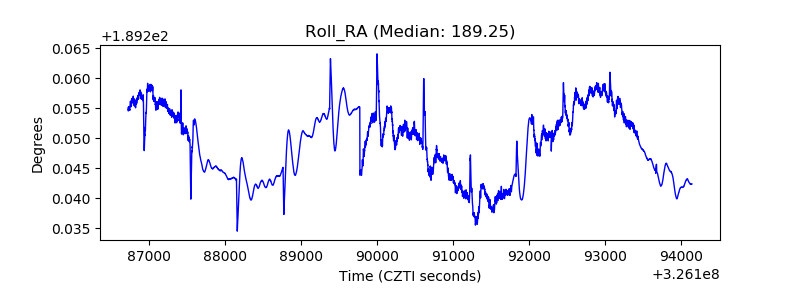 |
| Veto Counter | 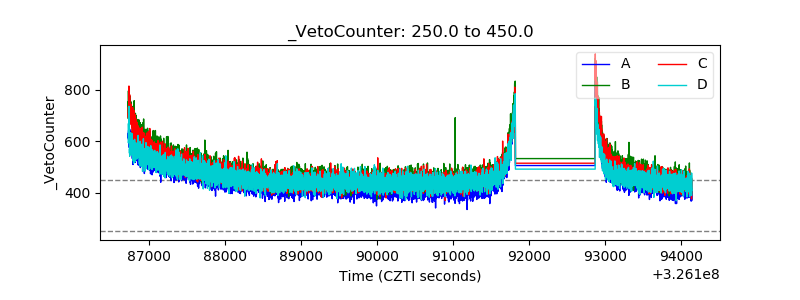 |