| Param | Original file | Final file |
|---|---|---|
| Filename | modeM0/AS1A08_003T06_9000003636_24856cztM0_level2.evt | modeM0/AS1A08_003T06_9000003636_24856cztM0_level2_quad_clean.evt |
| Size (bytes) | 611,136,000 | 89,265,600 |
| Size | 582.8 MB | 85.1 MB |
| Events in quadrant A | 3,948,786 | 561,338 |
| Events in quadrant B | 3,781,656 | 572,669 |
| Events in quadrant C | 5,810,989 | 528,014 |
| Events in quadrant D | 4,465,357 | 526,134 |
| Mode SS | |||
|---|---|---|---|
| Quadrant | BADHDUFLAG | Total packets | Discarded packets |
| A | 0 | 152 | 0 |
| B | 0 | 152 | 0 |
| C | 0 | 152 | 0 |
| D | 0 | 152 | 0 |
| Mode M0 | |||
|---|---|---|---|
| Quadrant | BADHDUFLAG | Total packets | Discarded packets |
| A | 0 | 16161 | 2 |
| B | 0 | 15569 | 2 |
| C | 0 | 22345 | 2 |
| D | 0 | 17946 | 2 |
| Mode M9 | |||
|---|---|---|---|
| Quadrant | BADHDUFLAG | Total packets | Discarded packets |
| A | 0 | 17 | 0 |
| B | 0 | 17 | 0 |
| C | 0 | 17 | 0 |
| D | 0 | 17 | 0 |
| Quadrant | Total seconds | Saturated seconds | Saturation percentage |
|---|---|---|---|
| A | 7400 | 261 | 3.527027% |
| B | 7400 | 253 | 3.418919% |
| C | 7401 | 648 | 8.755574% |
| D | 7401 | 283 | 3.823808% |
Noise dominated data is calculated using 1-second bins in cleaned event files. If a bin has >2000 counts, and if more than 50% of those come from <1% of pixels, then it is considered to be noise-dominated and hence unusable.
| Quadrant | # 1 sec bins | Bins with >0 counts | Bins with >2000 counts | High rate bins dominated by noise | Noise dominated (total time) | Noise dominated (detector-on time) | Marked lightcurve |
|---|---|---|---|---|---|---|---|
| A | 9100 | 7402 | 50 | 50 | 0.55% | 0.68% | 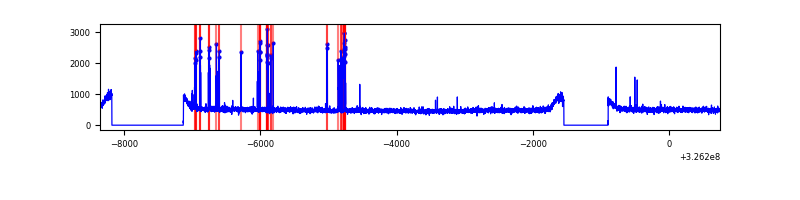 |
| B | 9100 | 7402 | 1 | 1 | 0.01% | 0.01% | 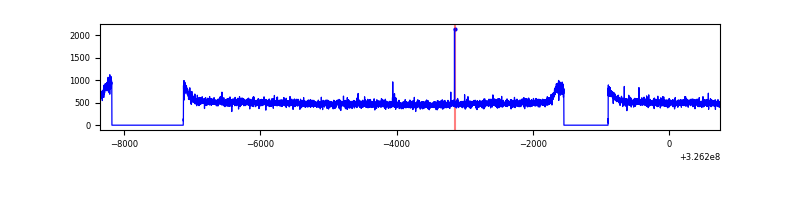 |
| C | 9101 | 7403 | 280 | 280 | 3.08% | 3.78% | 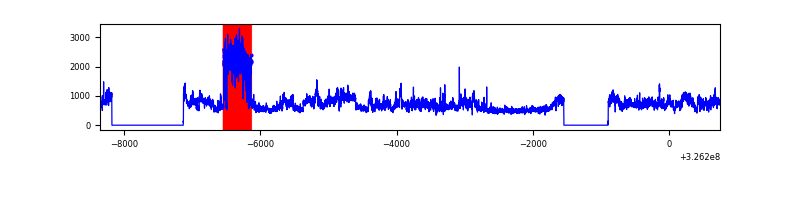 |
| D | 9101 | 7403 | 113 | 113 | 1.24% | 1.53% | 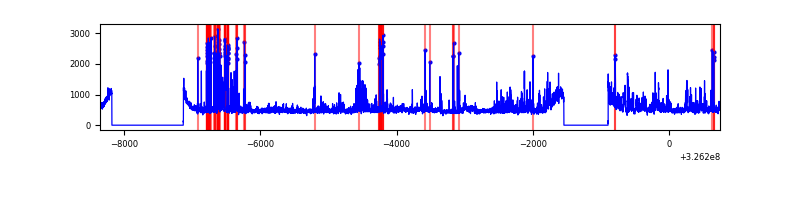 |
Top three noisy pixels from each quadrant. If the there are fewer than three noisy pixels in the level2.evt file, extra rows are filled as -1
| Pixel properties | Quadrant properties | ||||||
|---|---|---|---|---|---|---|---|
| Quadrant | DetID | PixID | Counts | Sigma | Mean | Median | Sigma |
| A | 6 | 16 | 214291 | 1092.27 | 969 | 949 | 195.3 |
| A | 13 | 254 | 10243 | 47.58 | 969 | 949 | 195.3 |
| A | 3 | 137 | 9172 | 42.1 | 969 | 949 | 195.3 |
| B | 12 | 111 | 23660 | 122.09 | 957 | 934 | 186.1 |
| B | 11 | 111 | 21263 | 109.21 | 957 | 934 | 186.1 |
| B | 14 | 111 | 20082 | 102.87 | 957 | 934 | 186.1 |
| C | 7 | 247 | 1501047 | 7168.84 | 890 | 897 | 209.3 |
| C | 2 | 16 | 693811 | 3311.26 | 890 | 897 | 209.3 |
| C | 14 | 238 | 141905 | 673.84 | 890 | 897 | 209.3 |
| D | 1 | 52 | 746078 | 3303.98 | 928 | 902 | 225.5 |
| D | 12 | 218 | 91419 | 401.34 | 928 | 902 | 225.5 |
| D | 8 | 195 | 69466 | 304.0 | 928 | 902 | 225.5 |
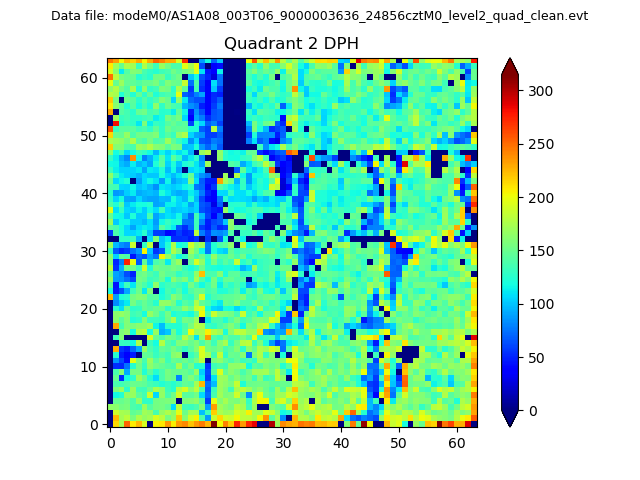
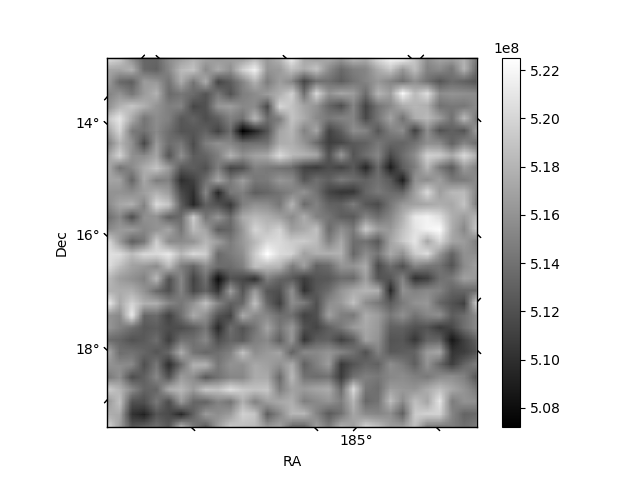
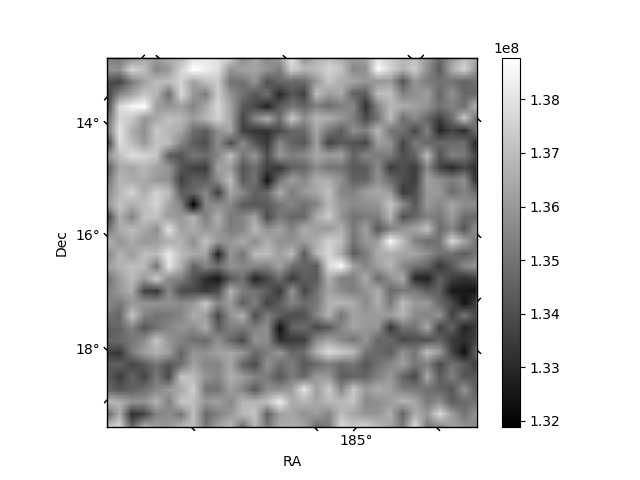
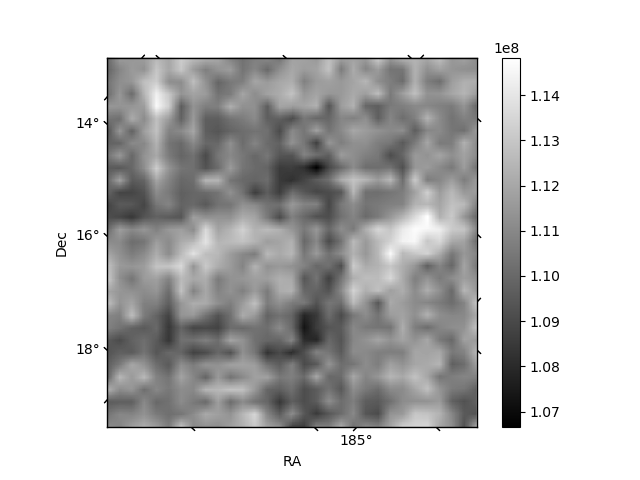
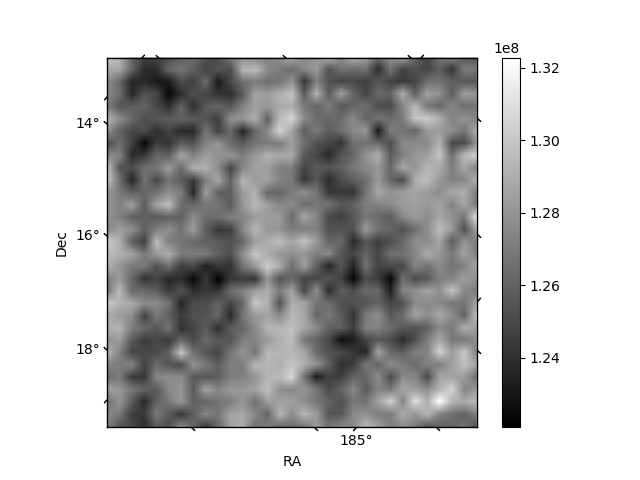
Histogram calculated using DETX and DETY for each event in the final _common_clean file
| Quadrant A | 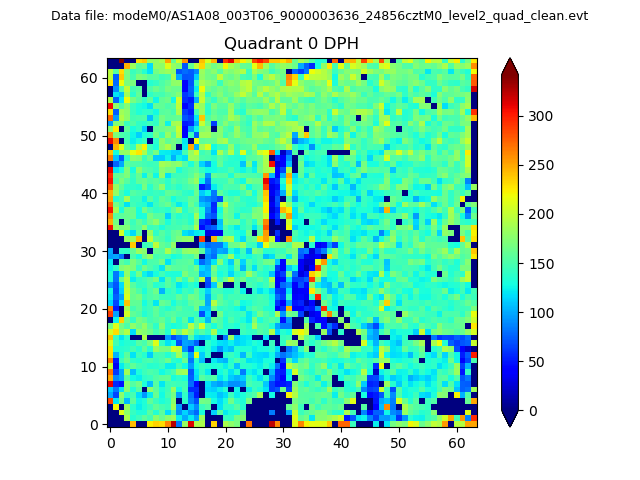 |
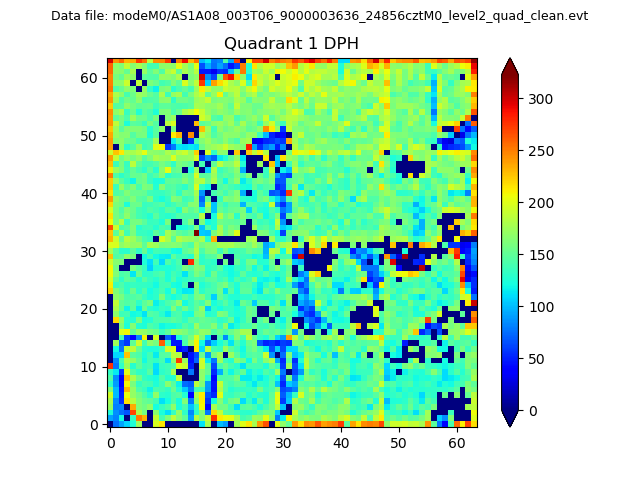 |
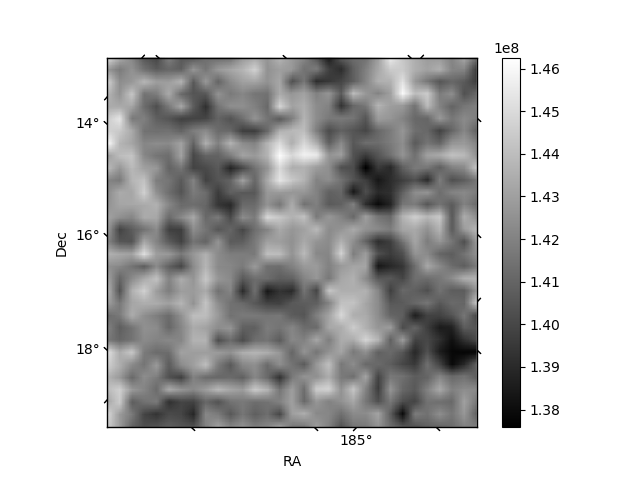
Quadrant B |
|---|---|---|---|
| Quadrant D | 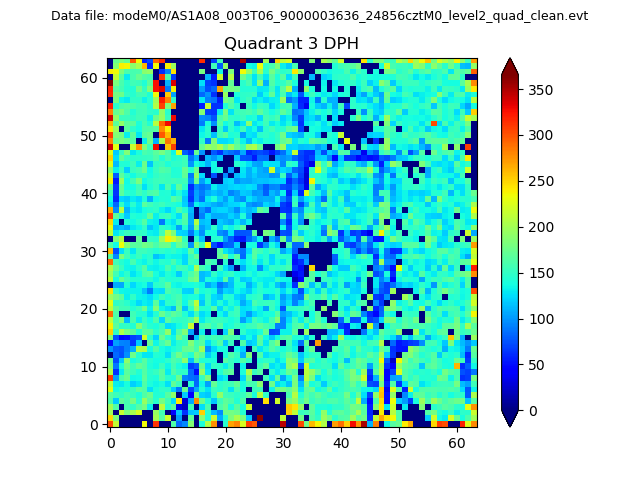 |
 |
Quadrant C |
| Plot type | Count rate plots | Images |
|---|---|---|
| Comparison with Poisson distribution Blue bars denote a histogram of data divided into 1 sec bins. Red curve is a Poisson curve with rate = median count rate of data. |
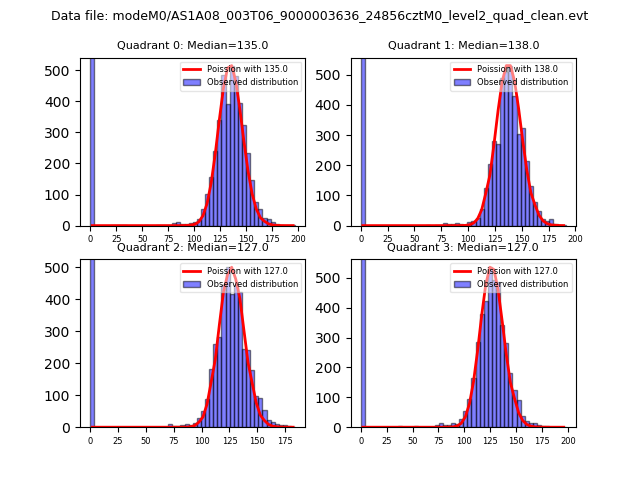 |
 |
| Quadrant-wise count rates Data is divided into 100 sec bins |
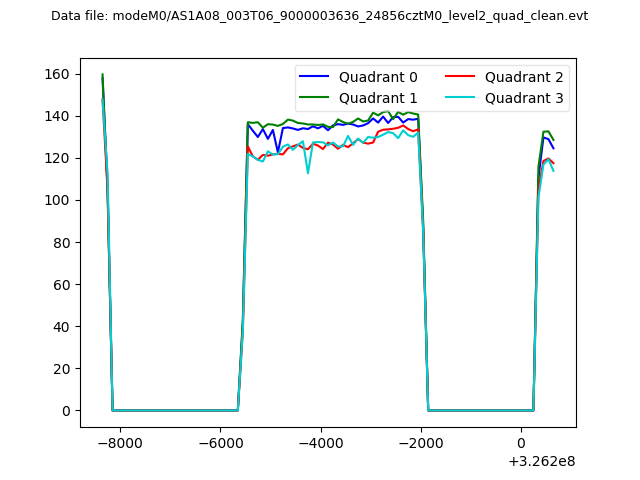 |
|
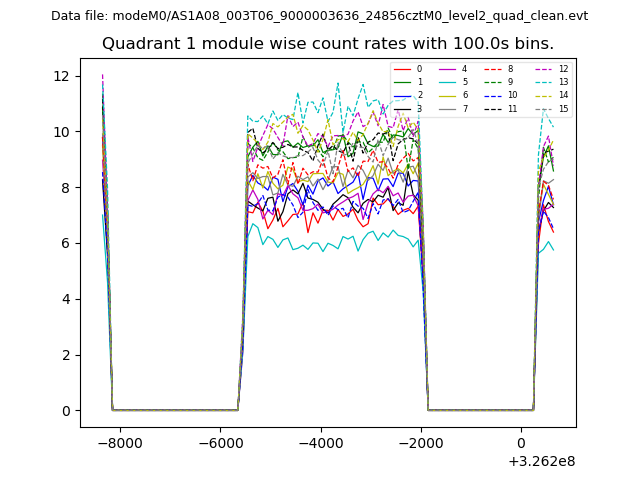
| Module-wise count rates for Quadrant A Data is divided into 100 sec bins |
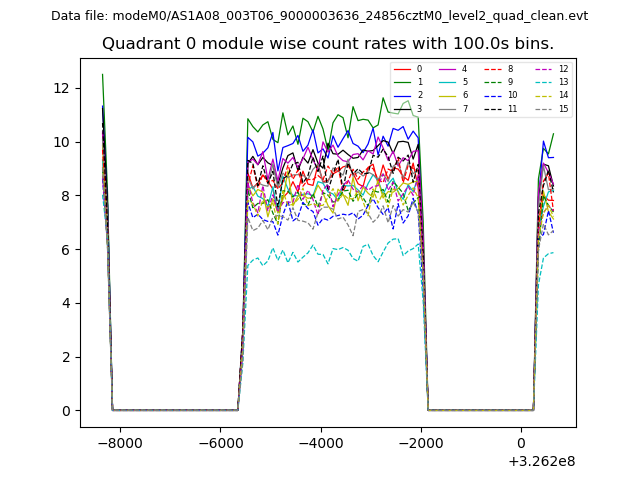 |
 |
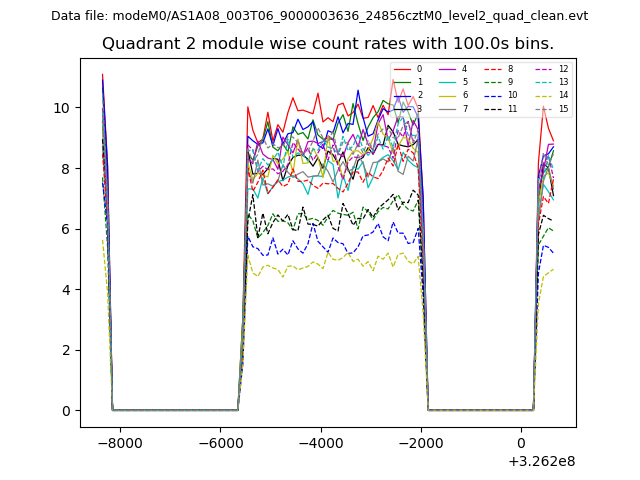
| Module-wise count rates for Quadrant B Data is divided into 100 sec bins |
 |
 |
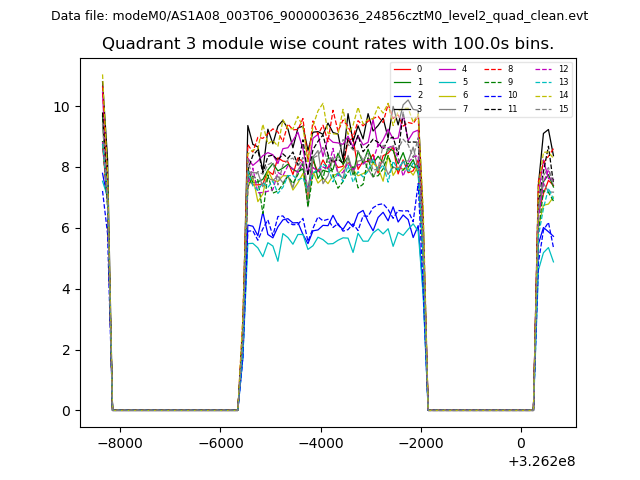
| Module-wise count rates for Quadrant C Data is divided into 100 sec bins |
 |
 |
| Module-wise count rates for Quadrant D Data is divided into 100 sec bins |
 |
 |
| Parameter | Plot |
|---|---|
| CZT HV Monitor | 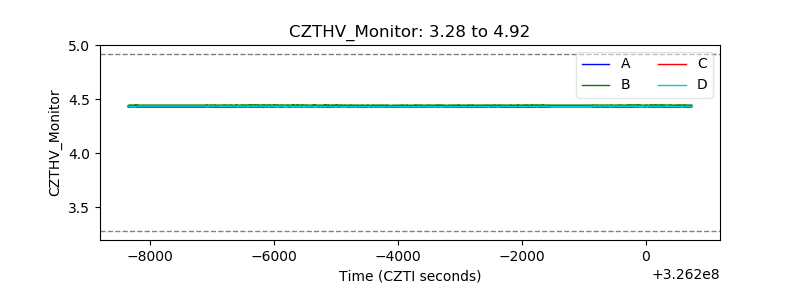 |
| D_VDD | 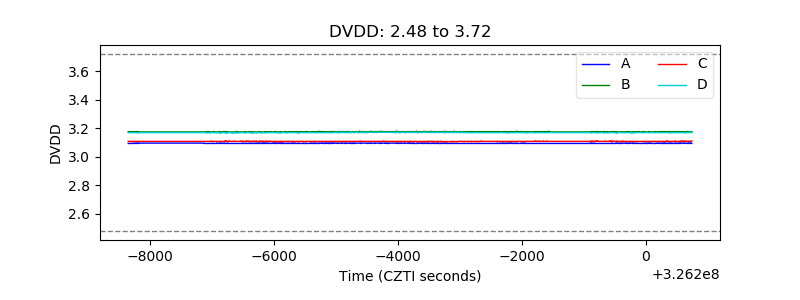 |
| Temperature 1 | 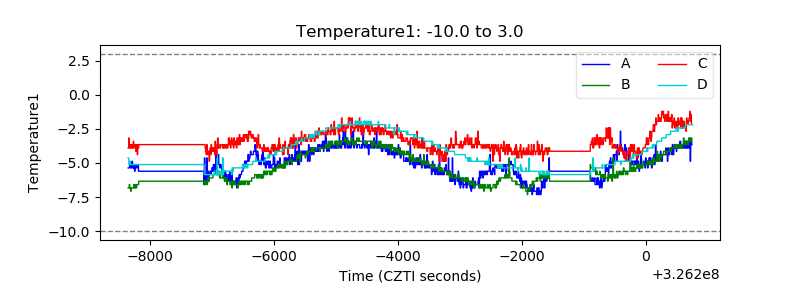 |
| Veto HV Monitor | 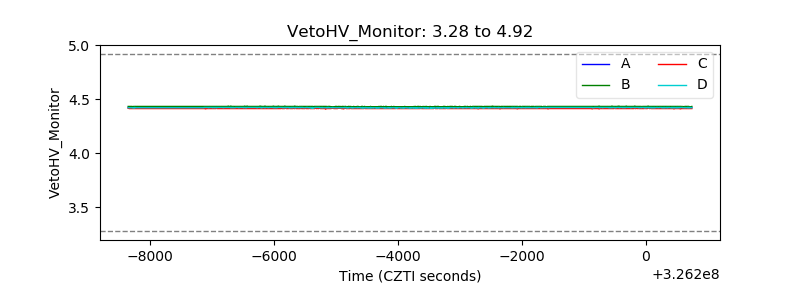 |
| Veto LLD | 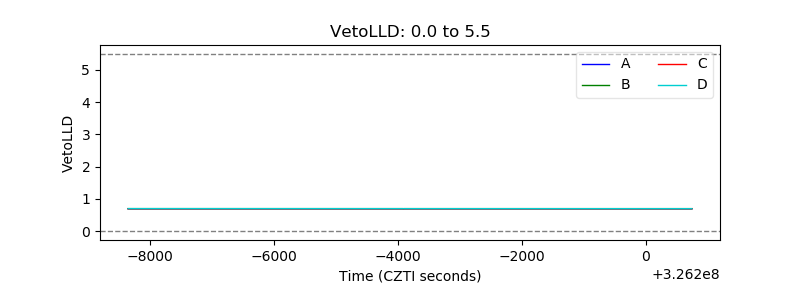 |
| Alpha Counter | 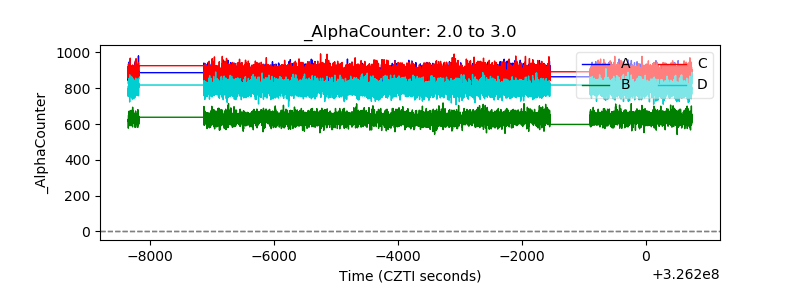 |
| _CPM_Rate | 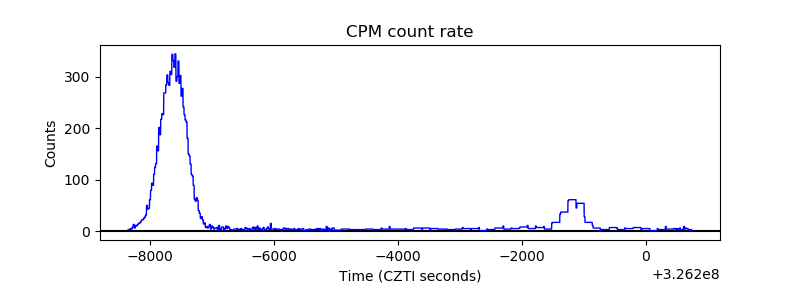 |
| CZT Counter | 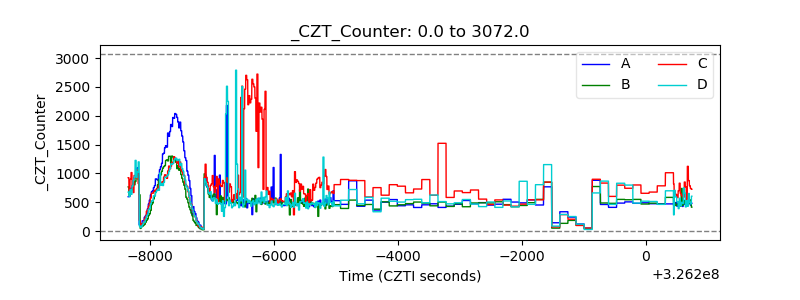 |
| +2.5 Volts monitor |  |
| +5 Volts monitor |  |
| _ROLL_ROT |  |
| _Roll_DEC | 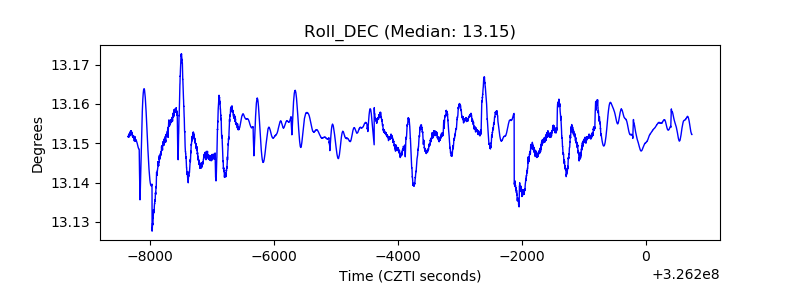 |
| _Roll_RA | 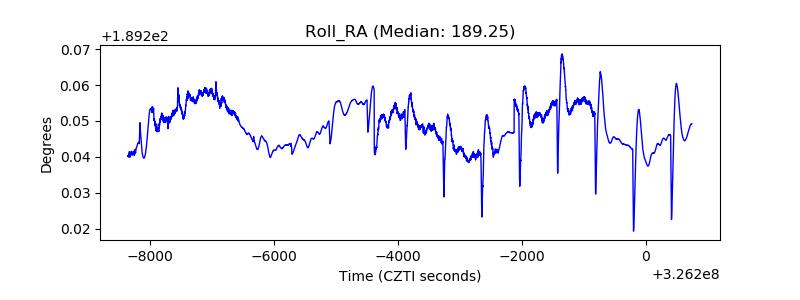 |
| Veto Counter | 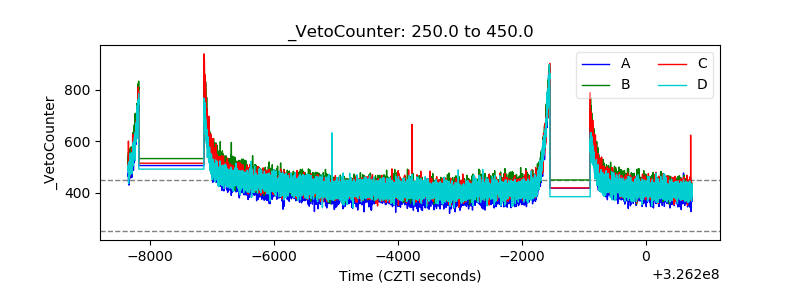 |