| Param | Original file | Final file |
|---|---|---|
| Filename | modeM0/AS1A07_027T02_9000003640_24862cztM0_level2.evt | modeM0/AS1A07_027T02_9000003640_24862cztM0_level2_quad_clean.evt |
| Size (bytes) | 315,112,320 | 57,775,680 |
| Size | 300.5 MB | 55.1 MB |
| Events in quadrant A | 2,436,163 | 372,180 |
| Events in quadrant B | 2,014,646 | 378,811 |
| Events in quadrant C | 2,043,183 | 362,051 |
| Events in quadrant D | 2,772,971 | 350,489 |
| Mode M9 | |||
|---|---|---|---|
| Quadrant | BADHDUFLAG | Total packets | Discarded packets |
| A | 0 | 10 | 0 |
| B | 0 | 10 | 0 |
| C | 0 | 10 | 0 |
| D | 0 | 10 | 0 |
| Mode SS | |||
|---|---|---|---|
| Quadrant | BADHDUFLAG | Total packets | Discarded packets |
| A | 0 | 82 | 0 |
| B | 0 | 82 | 0 |
| C | 0 | 82 | 0 |
| D | 0 | 82 | 0 |
| Mode M0 | |||
|---|---|---|---|
| Quadrant | BADHDUFLAG | Total packets | Discarded packets |
| A | 0 | 9843 | 1 |
| B | 0 | 8495 | 1 |
| C | 0 | 8536 | 1 |
| D | 0 | 11051 | 6 |
| Quadrant | Total seconds | Saturated seconds | Saturation percentage |
|---|---|---|---|
| A | 4056 | 139 | 3.427022% |
| B | 4056 | 49 | 1.208087% |
| C | 4056 | 71 | 1.750493% |
| D | 4055 | 88 | 2.170160% |
Noise dominated data is calculated using 1-second bins in cleaned event files. If a bin has >2000 counts, and if more than 50% of those come from <1% of pixels, then it is considered to be noise-dominated and hence unusable.
| Quadrant | # 1 sec bins | Bins with >0 counts | Bins with >2000 counts | High rate bins dominated by noise | Noise dominated (total time) | Noise dominated (detector-on time) | Marked lightcurve |
|---|---|---|---|---|---|---|---|
| A | 4991 | 4057 | 38 | 38 | 0.76% | 0.94% | 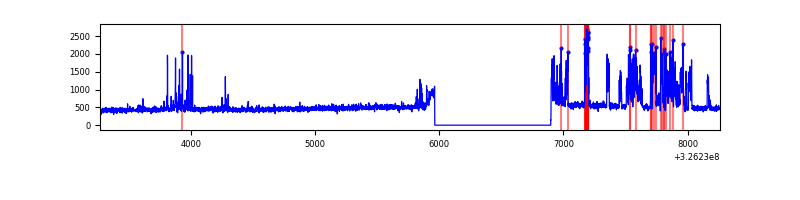 |
| B | 4991 | 4057 | 2 | 2 | 0.04% | 0.05% |  |
| C | 4991 | 4057 | 3 | 3 | 0.06% | 0.07% | 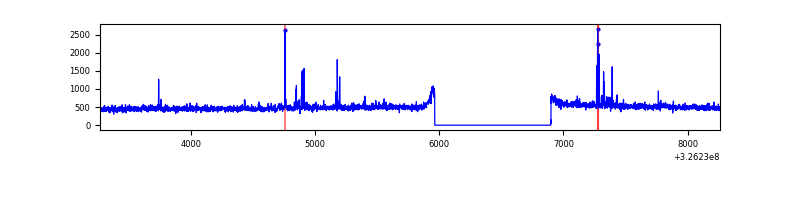 |
| D | 4990 | 4056 | 47 | 47 | 0.94% | 1.16% | 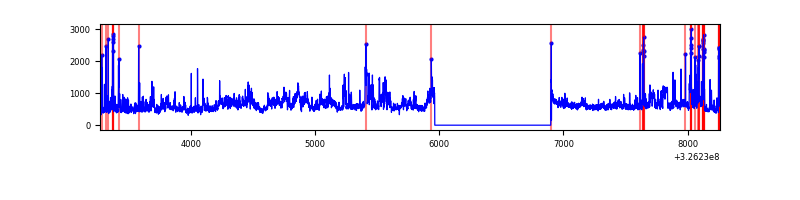 |
Top three noisy pixels from each quadrant. If the there are fewer than three noisy pixels in the level2.evt file, extra rows are filled as -1
| Pixel properties | Quadrant properties | ||||||
|---|---|---|---|---|---|---|---|
| Quadrant | DetID | PixID | Counts | Sigma | Mean | Median | Sigma |
| A | 6 | 16 | 471995 | 4639.46 | 504 | 492 | 101.6 |
| A | 15 | 223 | 15628 | 148.93 | 504 | 492 | 101.6 |
| A | 13 | 254 | 5537 | 49.64 | 504 | 492 | 101.6 |
| B | 4 | 80 | 16650 | 163.53 | 502 | 489 | 98.8 |
| B | 7 | 202 | 12251 | 119.02 | 502 | 489 | 98.8 |
| B | 12 | 111 | 11922 | 115.69 | 502 | 489 | 98.8 |
| C | 14 | 238 | 78142 | 678.5 | 486 | 490 | 114.4 |
| C | 2 | 16 | 60391 | 523.39 | 486 | 490 | 114.4 |
| C | 7 | 220 | 5617 | 44.8 | 486 | 490 | 114.4 |
| D | 12 | 218 | 475113 | 3923.7 | 492 | 478 | 121.0 |
| D | 1 | 52 | 388897 | 3210.97 | 492 | 478 | 121.0 |
| D | 8 | 195 | 35596 | 290.31 | 492 | 478 | 121.0 |
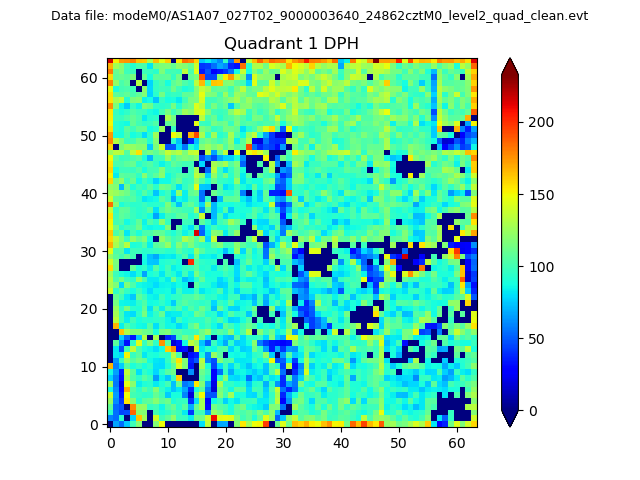
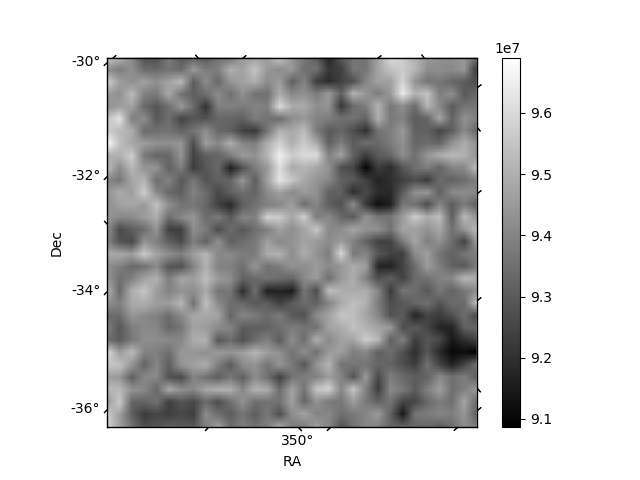
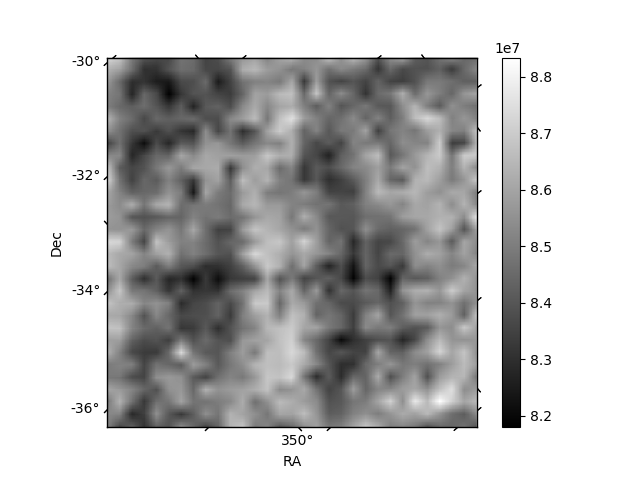
Histogram calculated using DETX and DETY for each event in the final _common_clean file
| Quadrant A | 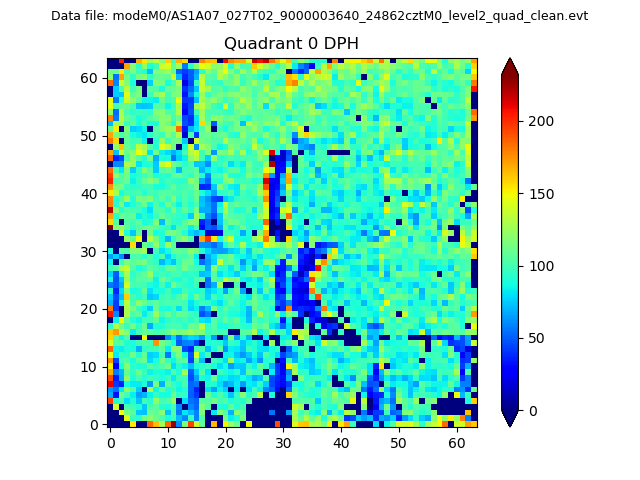 |
 |
Quadrant B |
|---|---|---|---|
| Quadrant D | 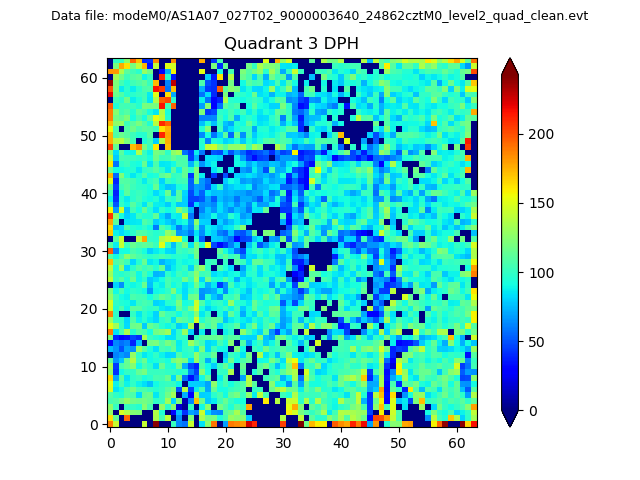 |
 |
Quadrant C |
| Plot type | Count rate plots | Images |
|---|---|---|
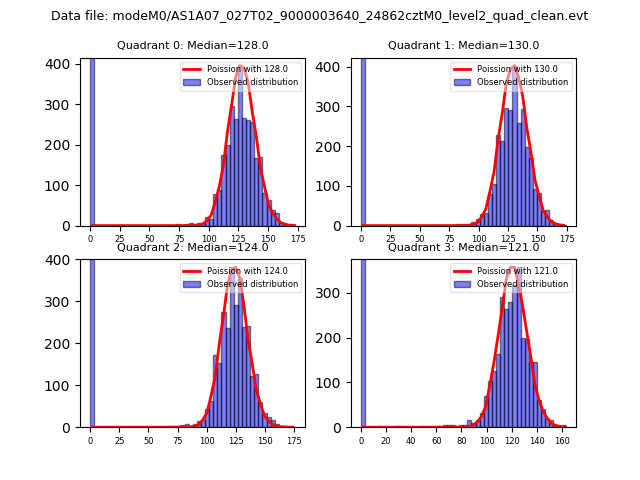
| Comparison with Poisson distribution Blue bars denote a histogram of data divided into 1 sec bins. Red curve is a Poisson curve with rate = median count rate of data. |
 |
 |
| Quadrant-wise count rates Data is divided into 100 sec bins |
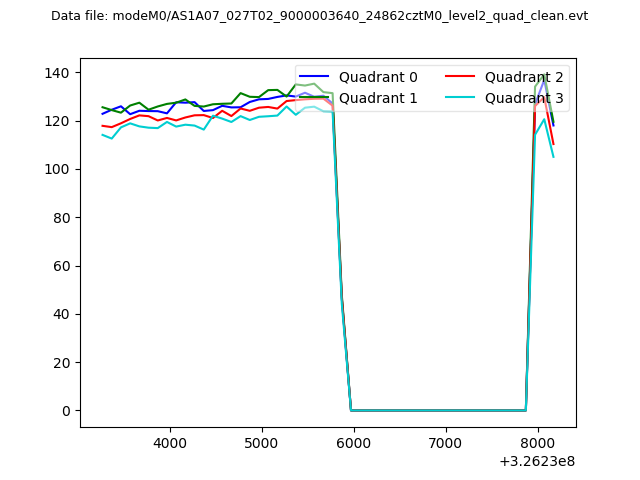 |
|
| Module-wise count rates for Quadrant A Data is divided into 100 sec bins |
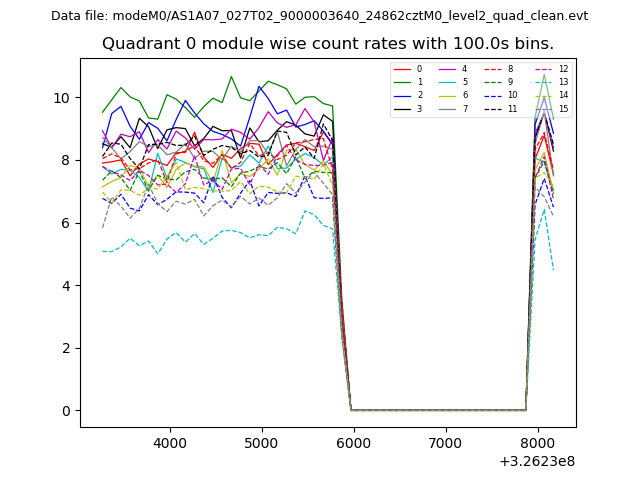 |
 |
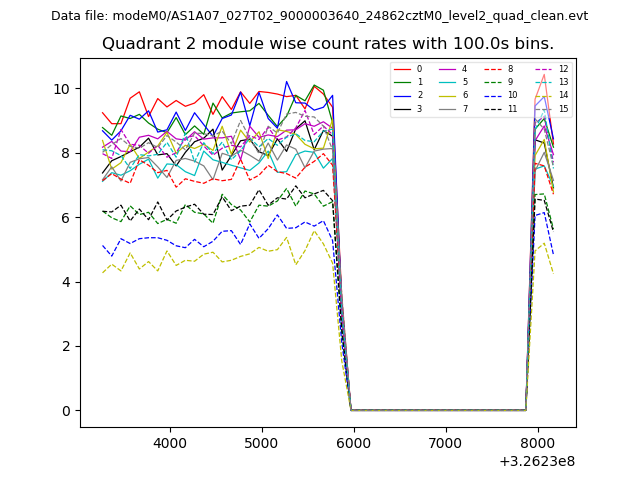
| Module-wise count rates for Quadrant B Data is divided into 100 sec bins |
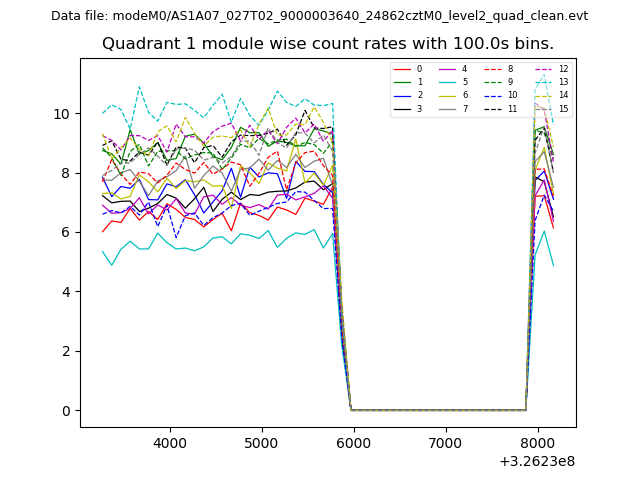 |
 |
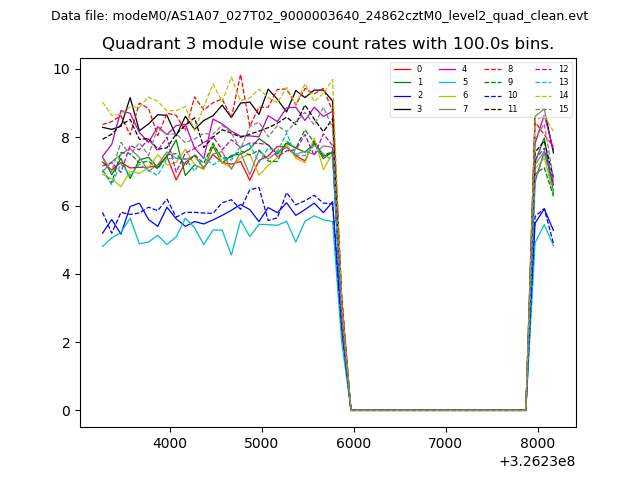
| Module-wise count rates for Quadrant C Data is divided into 100 sec bins |
 |
 |
| Module-wise count rates for Quadrant D Data is divided into 100 sec bins |
 |
 |
| Parameter | Plot |
|---|---|
| CZT HV Monitor | 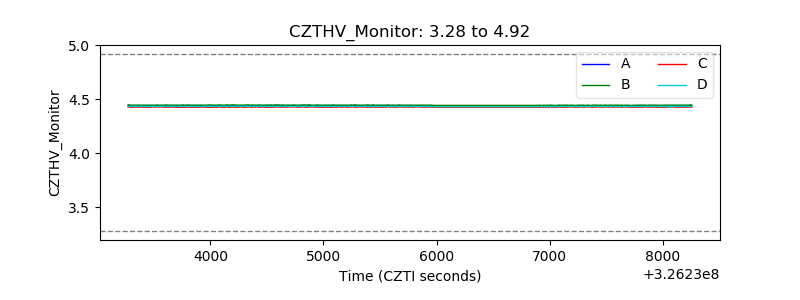 |
| D_VDD | 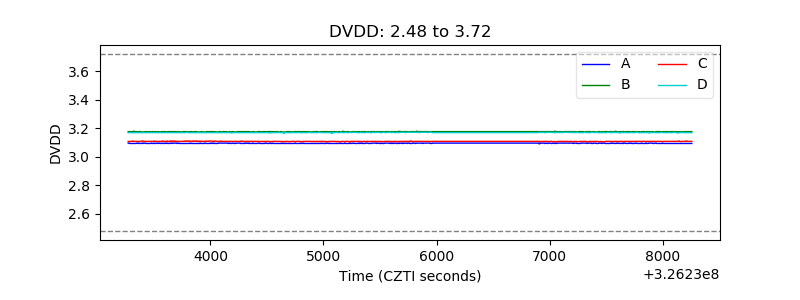 |
| Temperature 1 | 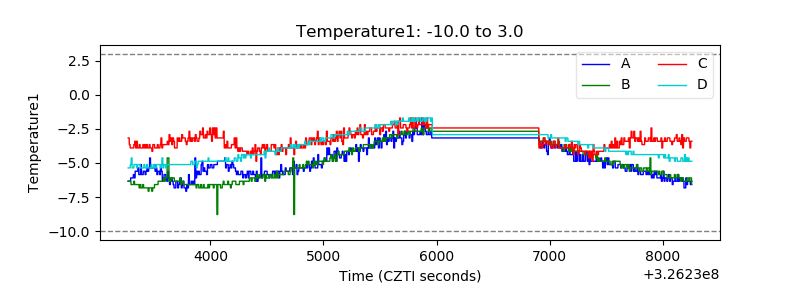 |
| Veto HV Monitor | 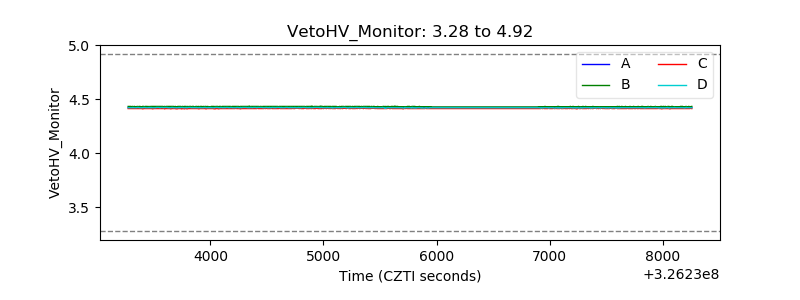 |
| Veto LLD | 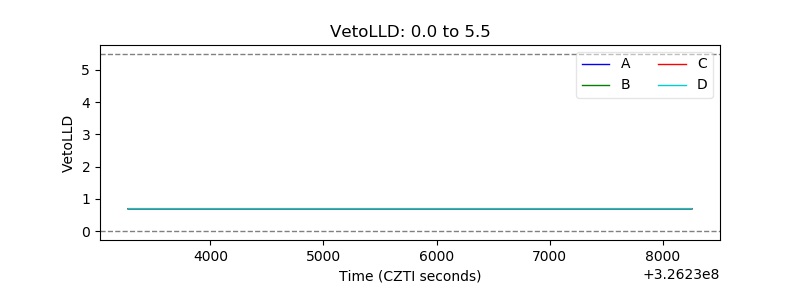 |
| Alpha Counter | 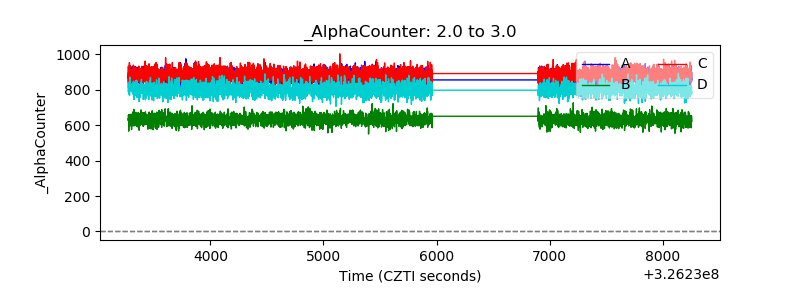 |
| _CPM_Rate | 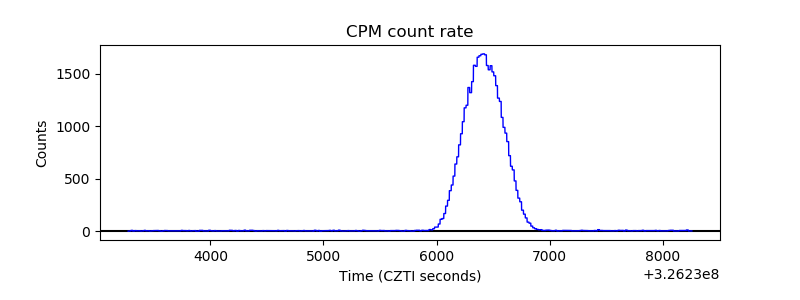 |
| CZT Counter |  |
| +2.5 Volts monitor |  |
| +5 Volts monitor |  |
| _ROLL_ROT | 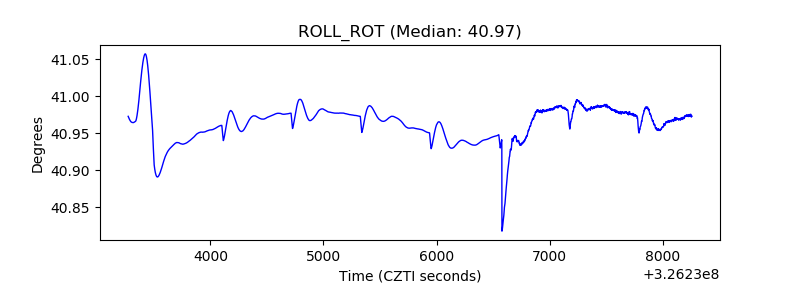 |
| _Roll_DEC | 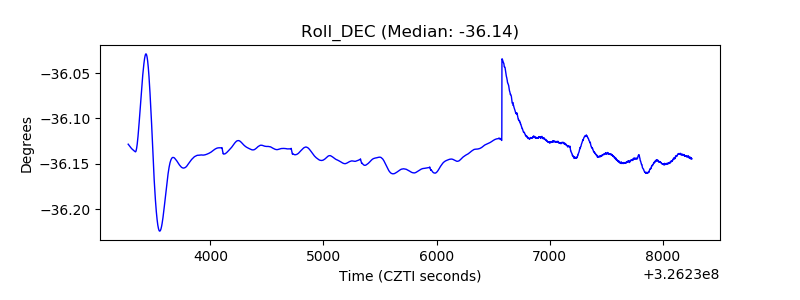 |
| _Roll_RA |  |
| Veto Counter | 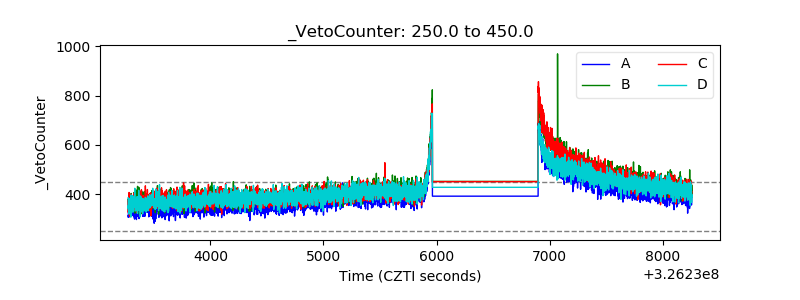 |