| Param | Original file | Final file |
|---|---|---|
| Filename | modeM0/AS1A07_027T02_9000003640_24866cztM0_level2.evt | modeM0/AS1A07_027T02_9000003640_24866cztM0_level2_quad_clean.evt |
| Size (bytes) | 507,666,240 | 117,535,680 |
| Size | 484.1 MB | 112.1 MB |
| Events in quadrant A | 3,341,211 | 786,141 |
| Events in quadrant B | 3,393,853 | 809,332 |
| Events in quadrant C | 3,543,469 | 783,106 |
| Events in quadrant D | 4,675,395 | 747,979 |
| Mode M9 | |||
|---|---|---|---|
| Quadrant | BADHDUFLAG | Total packets | Discarded packets |
| A | 0 | 21 | 0 |
| B | 0 | 22 | 0 |
| C | 0 | 22 | 0 |
| D | 0 | 22 | 0 |
| Mode SS | |||
|---|---|---|---|
| Quadrant | BADHDUFLAG | Total packets | Discarded packets |
| A | 0 | 126 | 0 |
| B | 0 | 126 | 0 |
| C | 0 | 126 | 0 |
| D | 0 | 126 | 0 |
| Mode M0 | |||
|---|---|---|---|
| Quadrant | BADHDUFLAG | Total packets | Discarded packets |
| A | 0 | 13797 | 2 |
| B | 0 | 14125 | 2 |
| C | 0 | 14411 | 2 |
| D | 0 | 18086 | 2 |
| Quadrant | Total seconds | Saturated seconds | Saturation percentage |
|---|---|---|---|
| A | 6208 | 83 | 1.336985% |
| B | 6208 | 45 | 0.724871% |
| C | 6208 | 99 | 1.594716% |
| D | 6208 | 247 | 3.978737% |
Noise dominated data is calculated using 1-second bins in cleaned event files. If a bin has >2000 counts, and if more than 50% of those come from <1% of pixels, then it is considered to be noise-dominated and hence unusable.
| Quadrant | # 1 sec bins | Bins with >0 counts | Bins with >2000 counts | High rate bins dominated by noise | Noise dominated (total time) | Noise dominated (detector-on time) | Marked lightcurve |
|---|---|---|---|---|---|---|---|
| A | 7498 | 6209 | 35 | 35 | 0.47% | 0.56% | 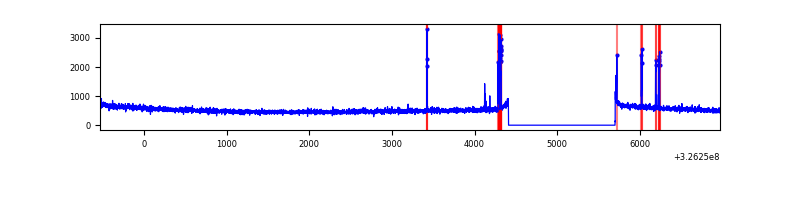 |
| B | 7498 | 6209 | 0 | 0 | 0.00% | 0.00% | 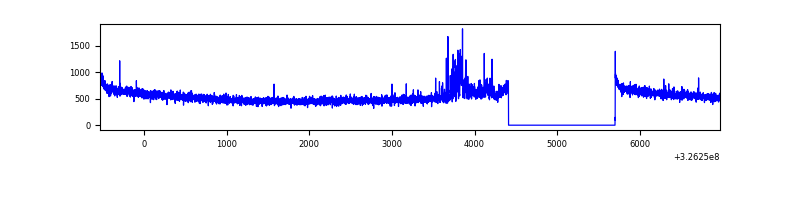 |
| C | 7498 | 6209 | 2 | 2 | 0.03% | 0.03% | 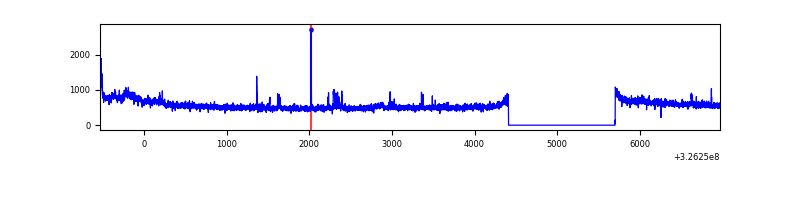 |
| D | 7498 | 6209 | 161 | 161 | 2.15% | 2.59% | 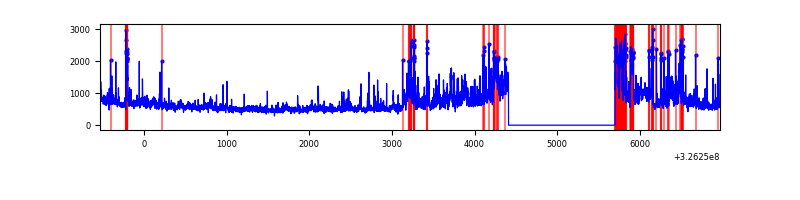 |
Top three noisy pixels from each quadrant. If the there are fewer than three noisy pixels in the level2.evt file, extra rows are filled as -1
| Pixel properties | Quadrant properties | ||||||
|---|---|---|---|---|---|---|---|
| Quadrant | DetID | PixID | Counts | Sigma | Mean | Median | Sigma |
| A | 12 | 96 | 64204 | 384.52 | 834 | 818 | 164.8 |
| A | 6 | 16 | 38506 | 228.62 | 834 | 818 | 164.8 |
| A | 8 | 160 | 10194 | 56.87 | 834 | 818 | 164.8 |
| B | 0 | 189 | 60669 | 385.02 | 837 | 817 | 155.5 |
| B | 0 | 190 | 50937 | 322.41 | 837 | 817 | 155.5 |
| B | 12 | 111 | 18347 | 112.77 | 837 | 817 | 155.5 |
| C | 14 | 238 | 132625 | 689.71 | 827 | 835 | 191.1 |
| C | 2 | 16 | 84132 | 435.93 | 827 | 835 | 191.1 |
| C | 7 | 247 | 80250 | 415.61 | 827 | 835 | 191.1 |
| D | 12 | 218 | 902794 | 4580.73 | 824 | 804 | 196.9 |
| D | 1 | 52 | 449390 | 2278.13 | 824 | 804 | 196.9 |
| D | 5 | 222 | 70075 | 351.79 | 824 | 804 | 196.9 |
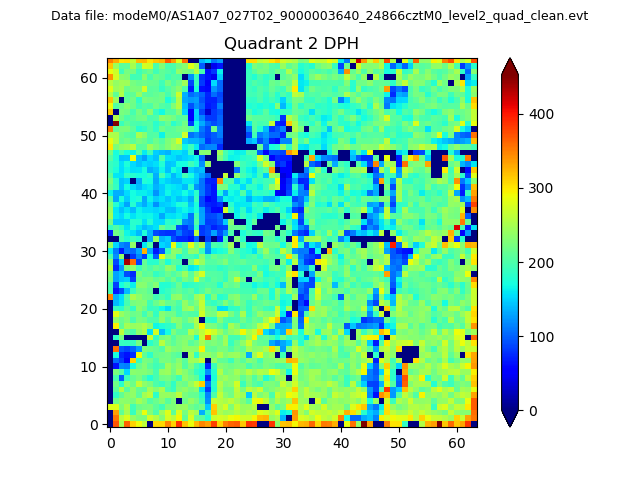
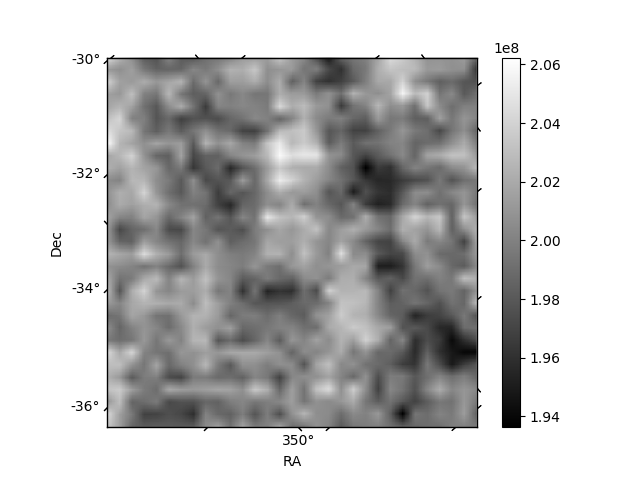
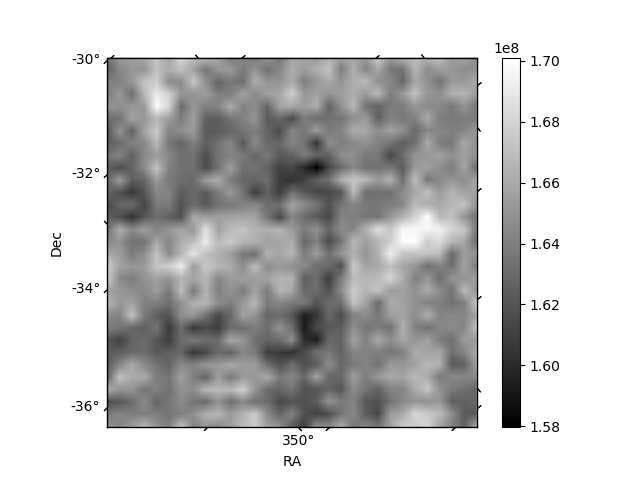
Histogram calculated using DETX and DETY for each event in the final _common_clean file
| Quadrant A | 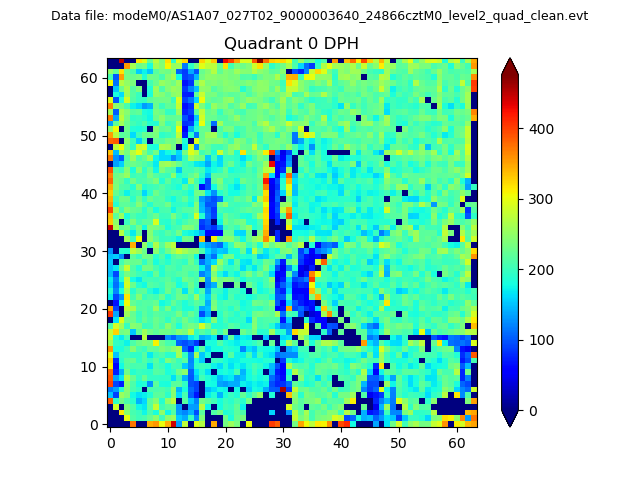 |
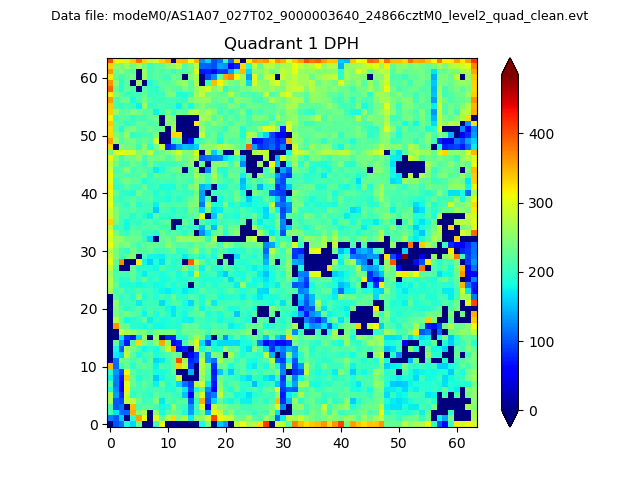 |
Quadrant B |
|---|---|---|---|
| Quadrant D | 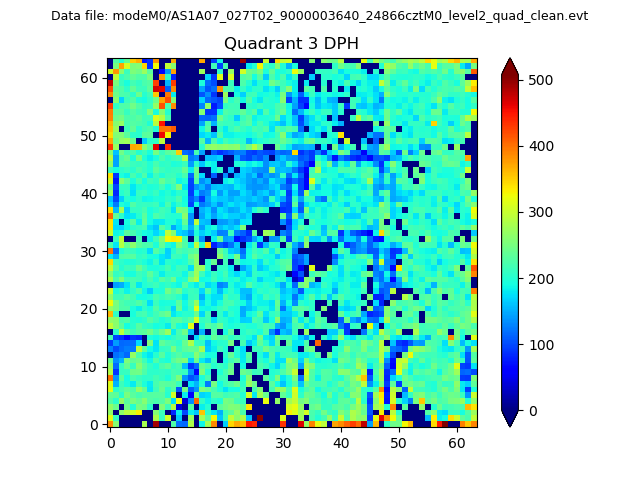 |
 |
Quadrant C |
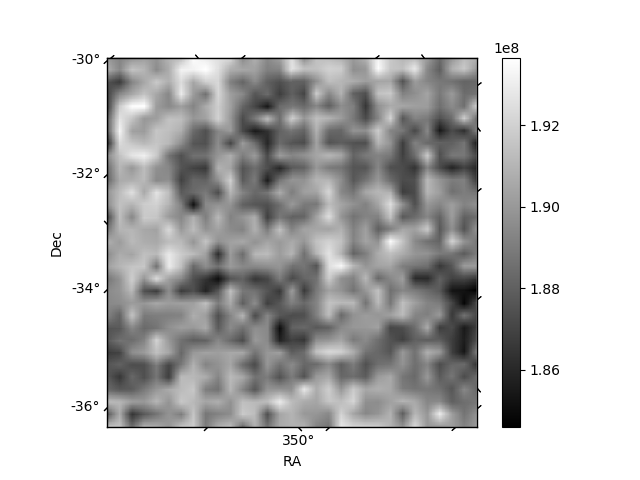
| Plot type | Count rate plots | Images |
|---|---|---|
| Comparison with Poisson distribution Blue bars denote a histogram of data divided into 1 sec bins. Red curve is a Poisson curve with rate = median count rate of data. |
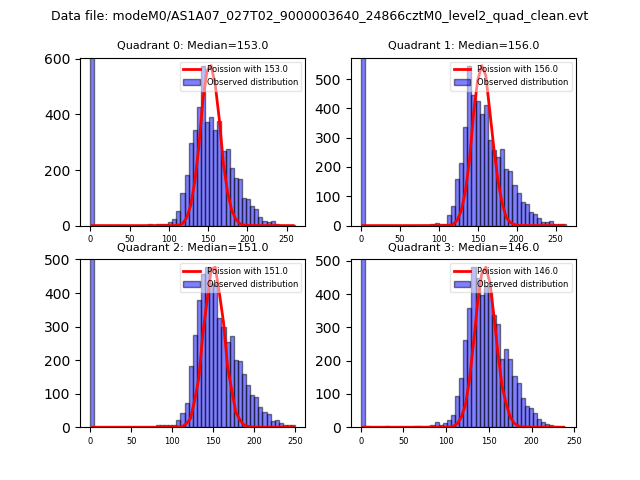 |
 |
| Quadrant-wise count rates Data is divided into 100 sec bins |
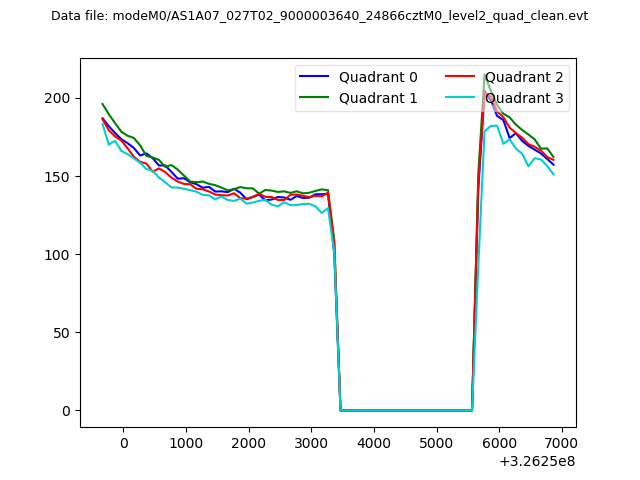 |
|
| Module-wise count rates for Quadrant A Data is divided into 100 sec bins |
 |
 |
| Module-wise count rates for Quadrant B Data is divided into 100 sec bins |
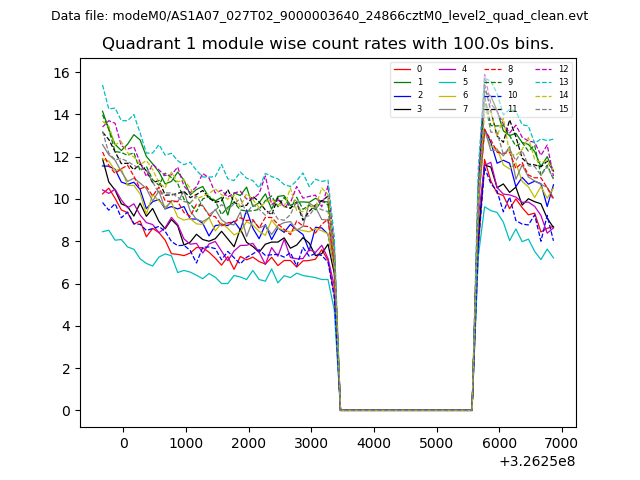 |
 |
| Module-wise count rates for Quadrant C Data is divided into 100 sec bins |
 |
 |
| Module-wise count rates for Quadrant D Data is divided into 100 sec bins |
 |
 |
| Parameter | Plot |
|---|---|
| CZT HV Monitor | 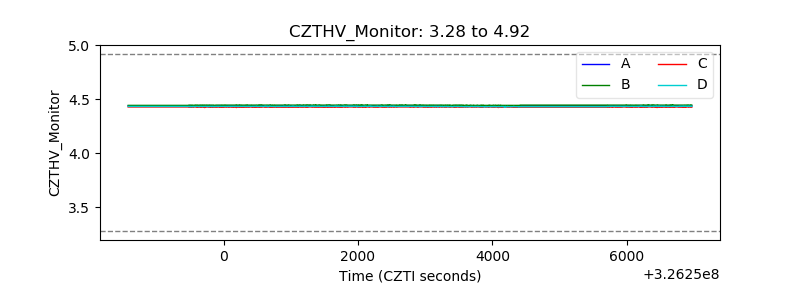 |
| D_VDD | 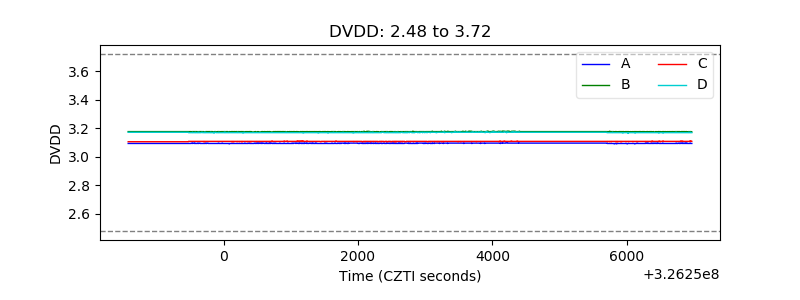 |
| Temperature 1 | 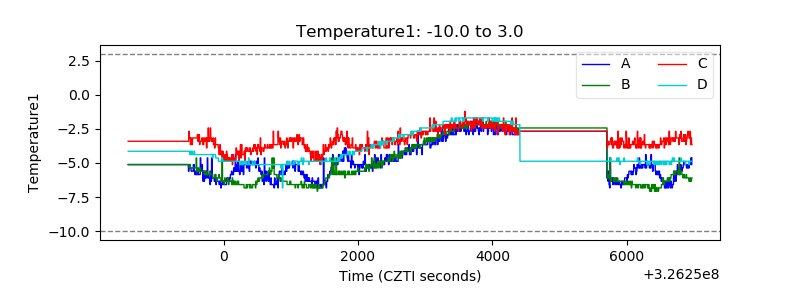 |
| Veto HV Monitor | 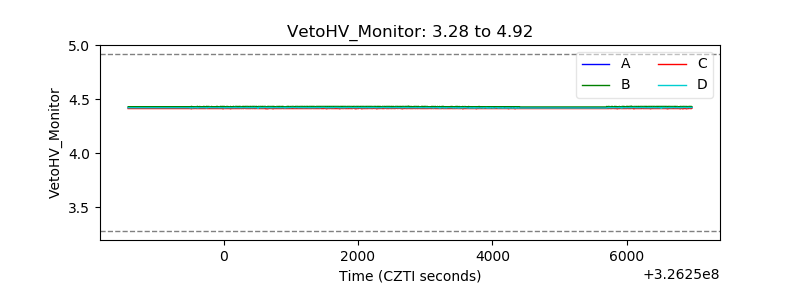 |
| Veto LLD |  |
| Alpha Counter | 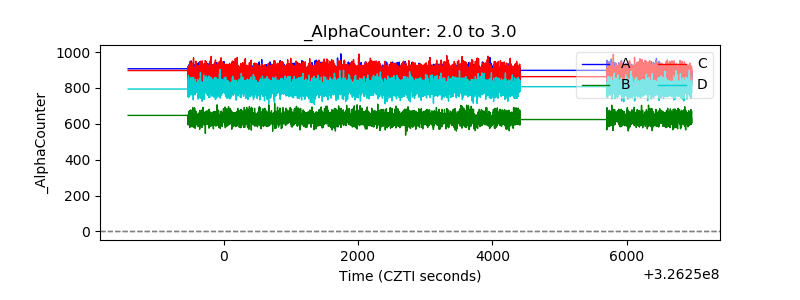 |
| _CPM_Rate | 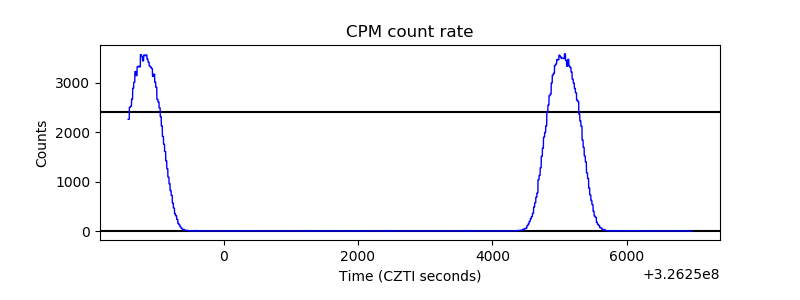 |
| CZT Counter | 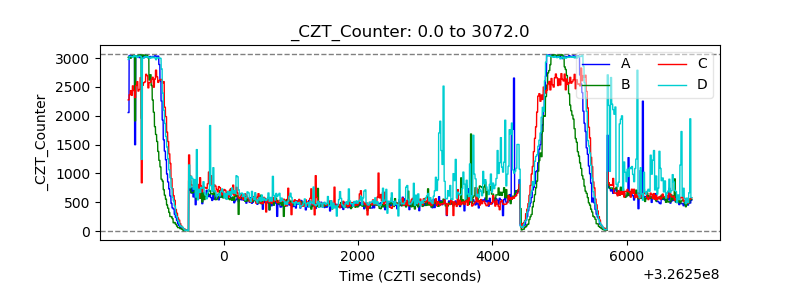 |
| +2.5 Volts monitor |  |
| +5 Volts monitor |  |
| _ROLL_ROT | 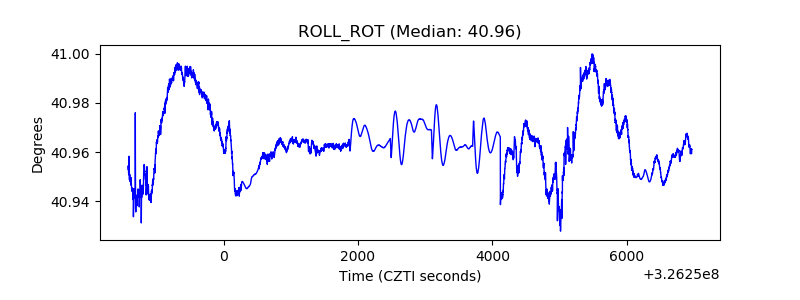 |
| _Roll_DEC | 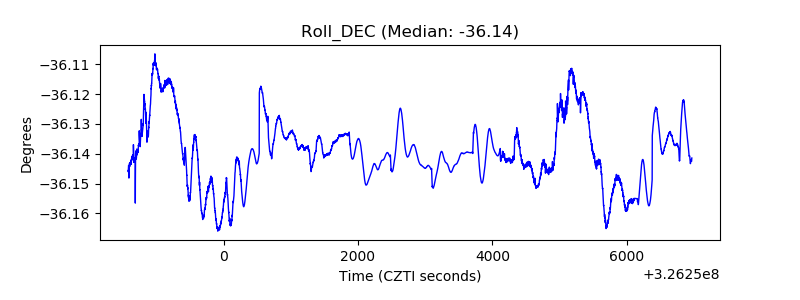 |
| _Roll_RA | 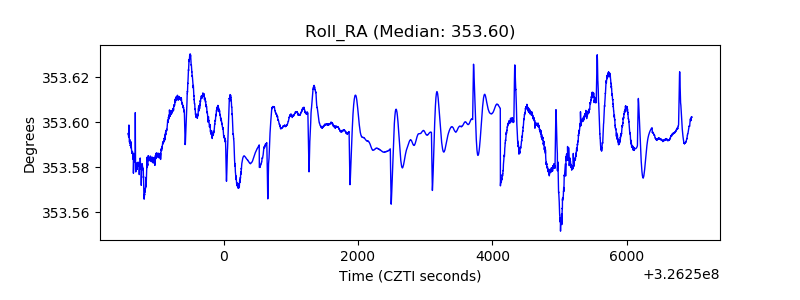 |
| Veto Counter | 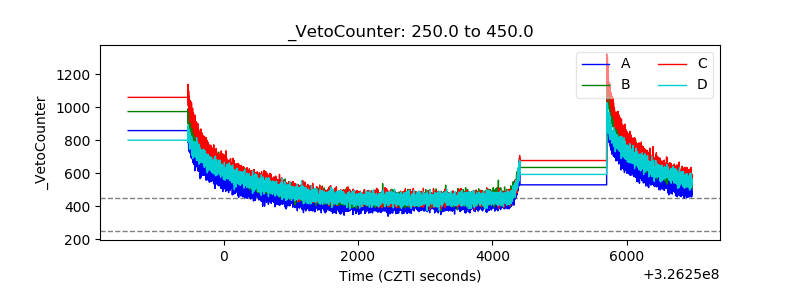 |