| Param | Original file | Final file |
|---|---|---|
| Filename | modeM0/AS1A07_027T02_9000003640_24870cztM0_level2.evt | modeM0/AS1A07_027T02_9000003640_24870cztM0_level2_quad_clean.evt |
| Size (bytes) | 2,488,464,000 | 462,332,160 |
| Size | 2.3 GB | 440.9 MB |
| Events in quadrant A | 15,292,909 | 3,025,842 |
| Events in quadrant B | 15,592,582 | 3,095,698 |
| Events in quadrant C | 19,177,727 | 2,924,101 |
| Events in quadrant D | 23,273,996 | 2,890,339 |
| Mode M9 | |||
|---|---|---|---|
| Quadrant | BADHDUFLAG | Total packets | Discarded packets |
| A | 0 | 61 | 0 |
| B | 0 | 61 | 0 |
| C | 0 | 61 | 0 |
| D | 0 | 61 | 0 |
| Mode SS | |||
|---|---|---|---|
| Quadrant | BADHDUFLAG | Total packets | Discarded packets |
| A | 0 | 612 | 0 |
| B | 0 | 612 | 0 |
| C | 0 | 612 | 0 |
| D | 0 | 612 | 0 |
| Mode M0 | |||
|---|---|---|---|
| Quadrant | BADHDUFLAG | Total packets | Discarded packets |
| A | 0 | 63866 | 5 |
| B | 0 | 64893 | 5 |
| C | 0 | 75389 | 7 |
| D | 0 | 89803 | 5 |
| Quadrant | Total seconds | Saturated seconds | Saturation percentage |
|---|---|---|---|
| A | 30090 | 232 | 0.771020% |
| B | 30091 | 206 | 0.684590% |
| C | 30090 | 1495 | 4.968428% |
| D | 30090 | 1047 | 3.479561% |
Noise dominated data is calculated using 1-second bins in cleaned event files. If a bin has >2000 counts, and if more than 50% of those come from <1% of pixels, then it is considered to be noise-dominated and hence unusable.
| Quadrant | # 1 sec bins | Bins with >0 counts | Bins with >2000 counts | High rate bins dominated by noise | Noise dominated (total time) | Noise dominated (detector-on time) | Marked lightcurve |
|---|---|---|---|---|---|---|---|
| A | 39034 | 30095 | 94 | 94 | 0.24% | 0.31% | 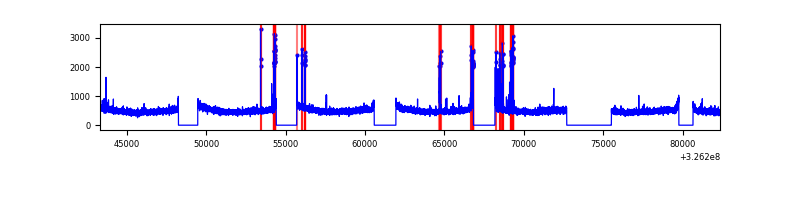 |
| B | 39035 | 30096 | 17 | 17 | 0.04% | 0.06% | 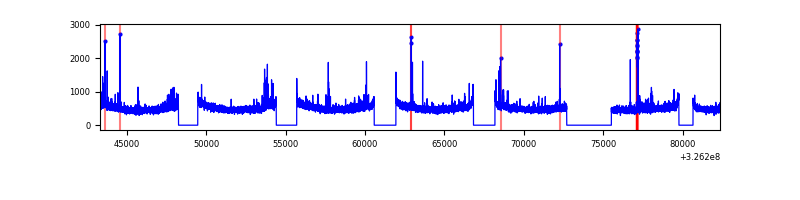 |
| C | 39035 | 30095 | 1014 | 1014 | 2.60% | 3.37% | 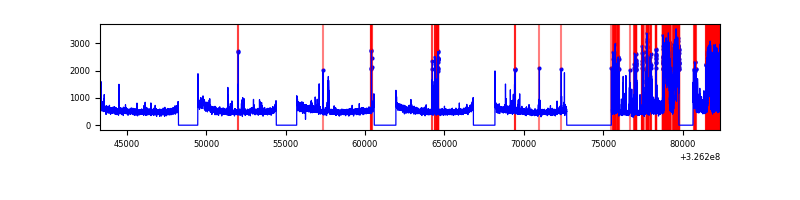 |
| D | 39035 | 30095 | 851 | 851 | 2.18% | 2.83% |  |
Top three noisy pixels from each quadrant. If the there are fewer than three noisy pixels in the level2.evt file, extra rows are filled as -1
| Pixel properties | Quadrant properties | ||||||
|---|---|---|---|---|---|---|---|
| Quadrant | DetID | PixID | Counts | Sigma | Mean | Median | Sigma |
| A | 6 | 16 | 274911 | 358.39 | 3867 | 3799 | 756.5 |
| A | 12 | 96 | 67808 | 84.61 | 3867 | 3799 | 756.5 |
| A | 13 | 254 | 45034 | 54.51 | 3867 | 3799 | 756.5 |
| B | 0 | 189 | 165338 | 227.02 | 3843 | 3753 | 711.8 |
| B | 0 | 190 | 119830 | 163.08 | 3843 | 3753 | 711.8 |
| B | 7 | 205 | 114170 | 155.13 | 3843 | 3753 | 711.8 |
| C | 7 | 247 | 3478829 | 4091.49 | 3701 | 3736 | 849.3 |
| C | 2 | 16 | 595365 | 696.57 | 3701 | 3736 | 849.3 |
| C | 14 | 238 | 592801 | 693.55 | 3701 | 3736 | 849.3 |
| D | 12 | 218 | 3712543 | 4082.42 | 3805 | 3707 | 908.5 |
| D | 1 | 52 | 2790384 | 3067.37 | 3805 | 3707 | 908.5 |
| D | 8 | 195 | 1863261 | 2046.86 | 3805 | 3707 | 908.5 |
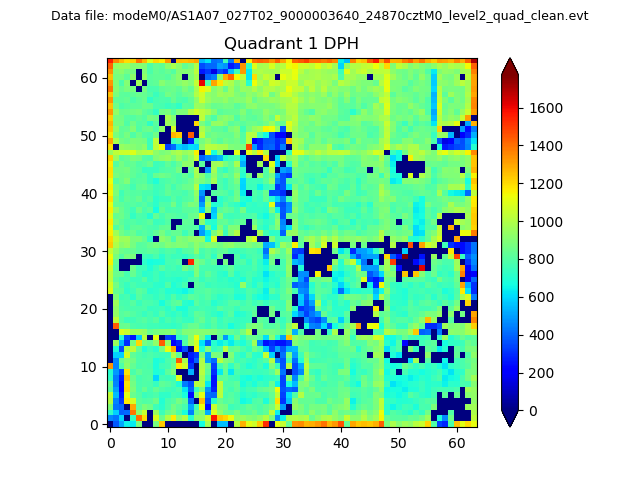
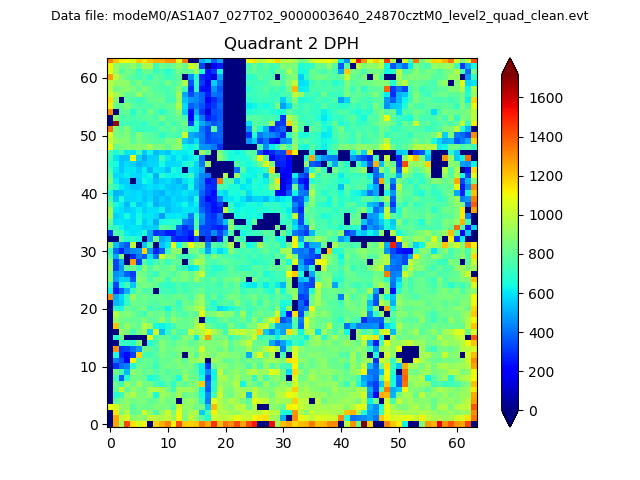
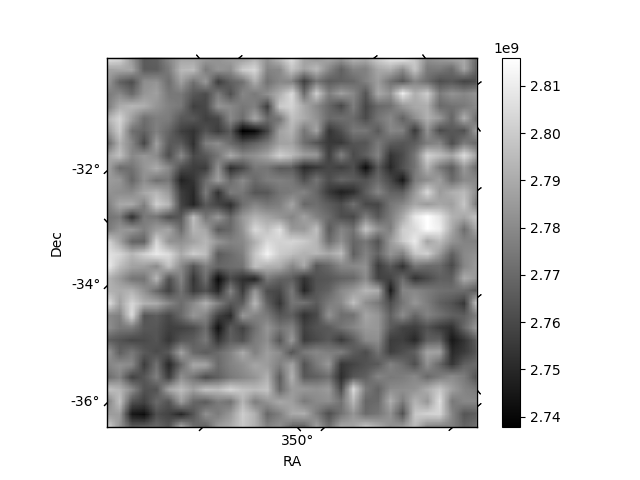
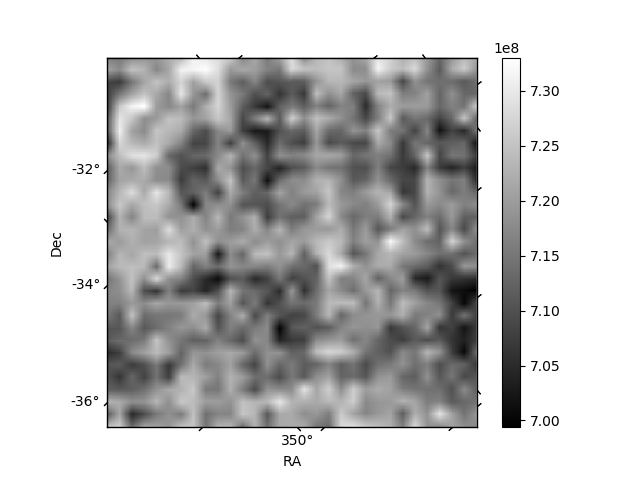
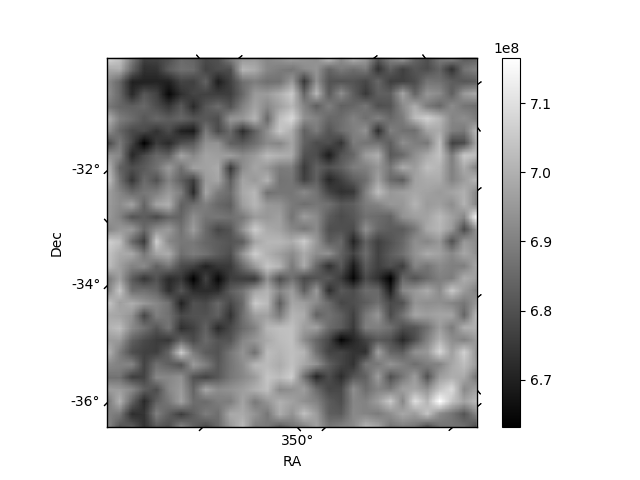
Histogram calculated using DETX and DETY for each event in the final _common_clean file
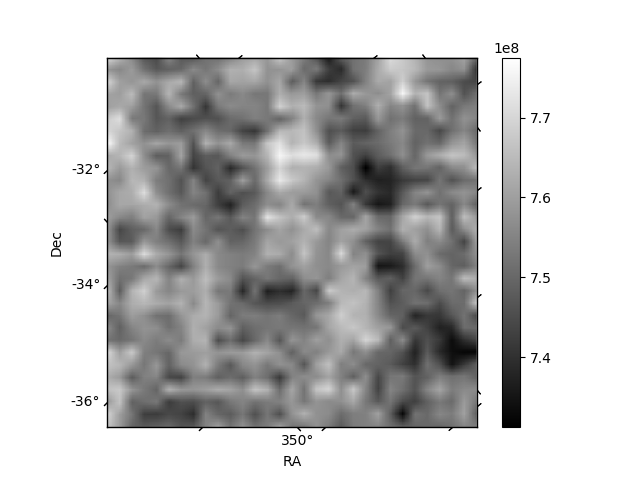
| Quadrant A | 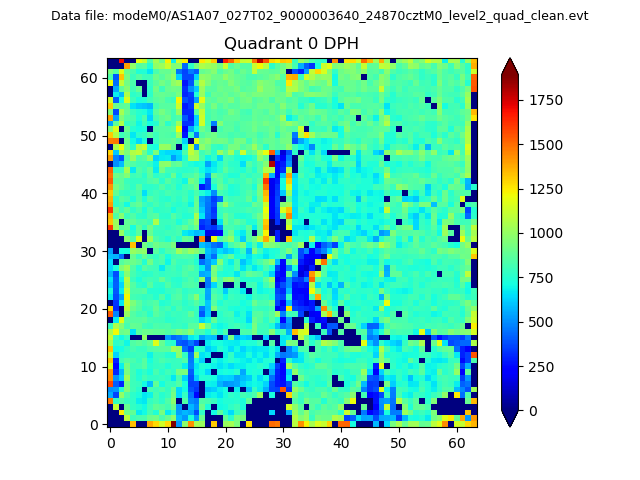 |
 |
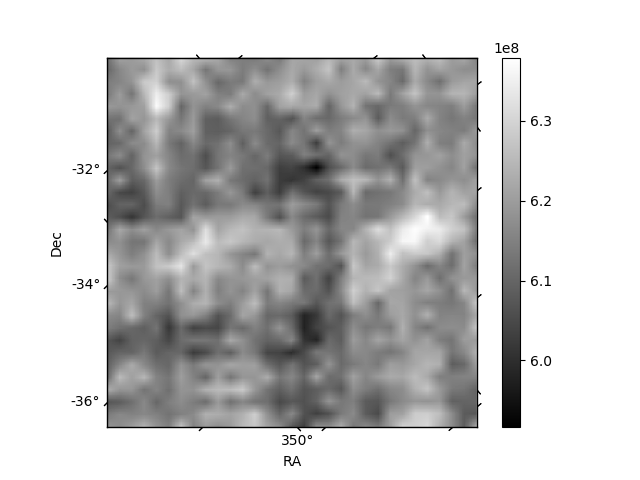
Quadrant B |
|---|---|---|---|
| Quadrant D | 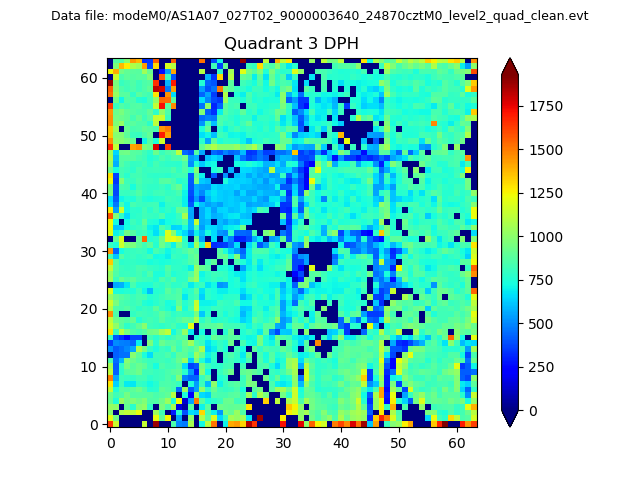 |
 |
Quadrant C |
| Plot type | Count rate plots | Images |
|---|---|---|
| Comparison with Poisson distribution Blue bars denote a histogram of data divided into 1 sec bins. Red curve is a Poisson curve with rate = median count rate of data. |
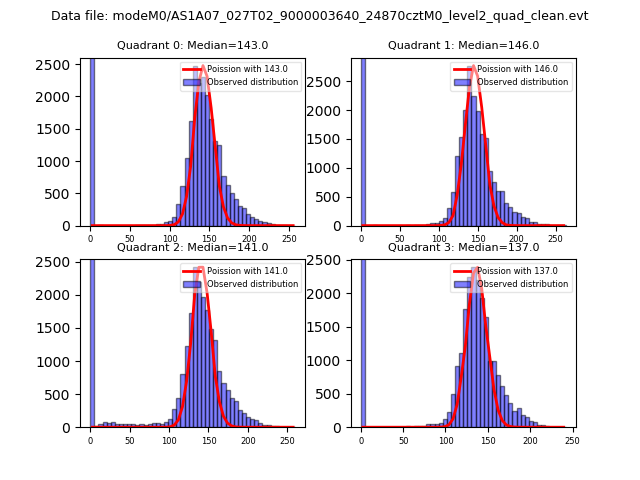 |
 |
| Quadrant-wise count rates Data is divided into 100 sec bins |
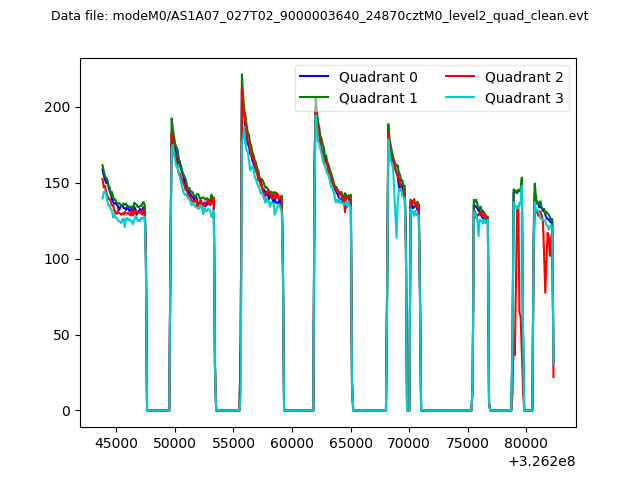 |
|
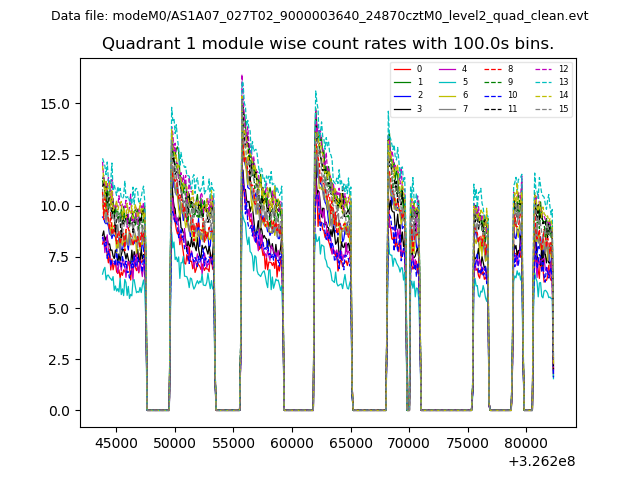
| Module-wise count rates for Quadrant A Data is divided into 100 sec bins |
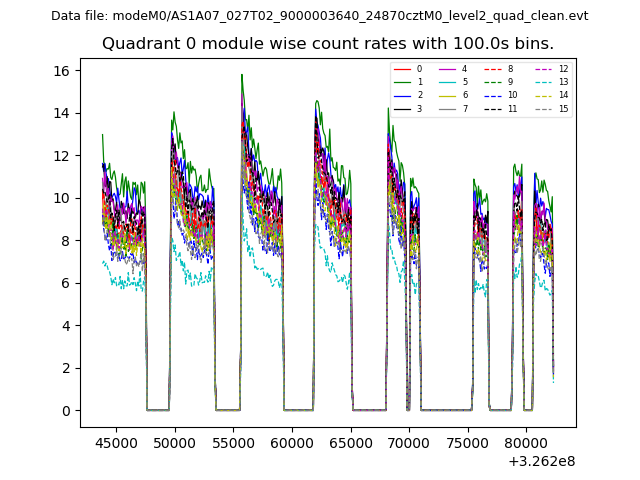 |
 |
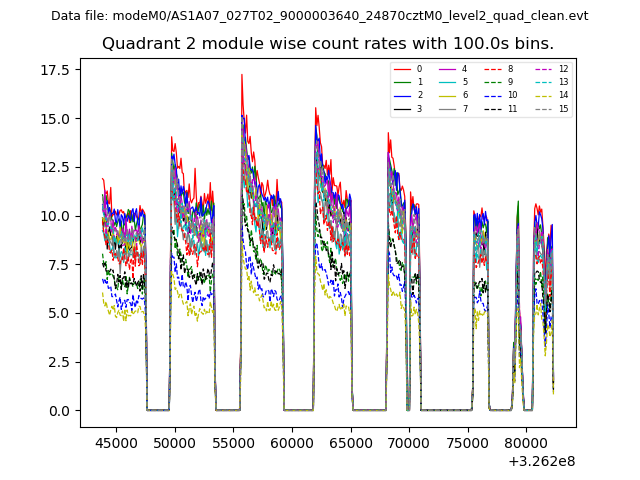
| Module-wise count rates for Quadrant B Data is divided into 100 sec bins |
 |
 |
| Module-wise count rates for Quadrant C Data is divided into 100 sec bins |
 |
 |
| Module-wise count rates for Quadrant D Data is divided into 100 sec bins |
 |
 |
| Parameter | Plot |
|---|---|
| CZT HV Monitor | 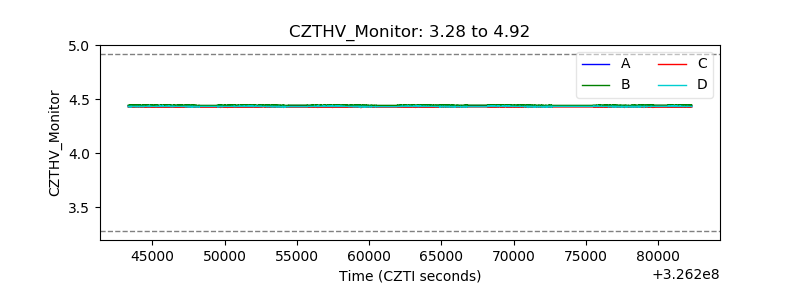 |
| D_VDD |  |
| Temperature 1 | 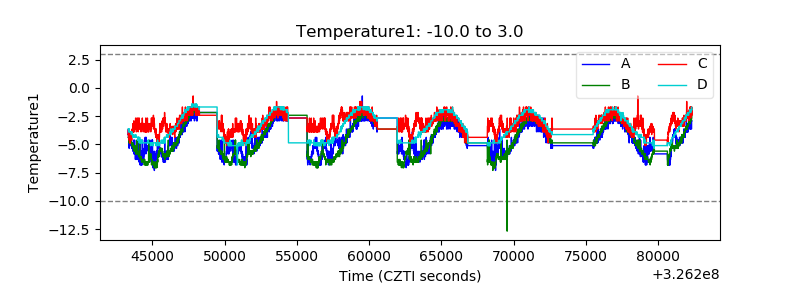 |
| Veto HV Monitor | 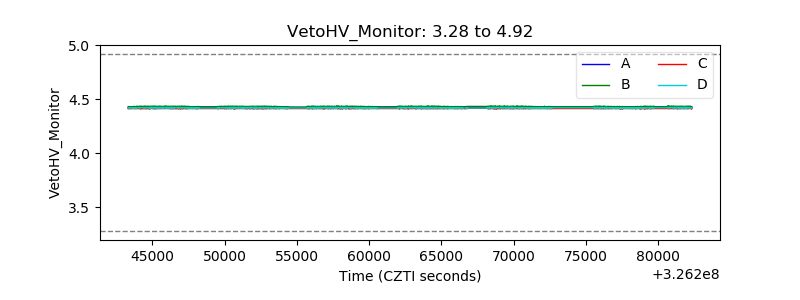 |
| Veto LLD |  |
| Alpha Counter | 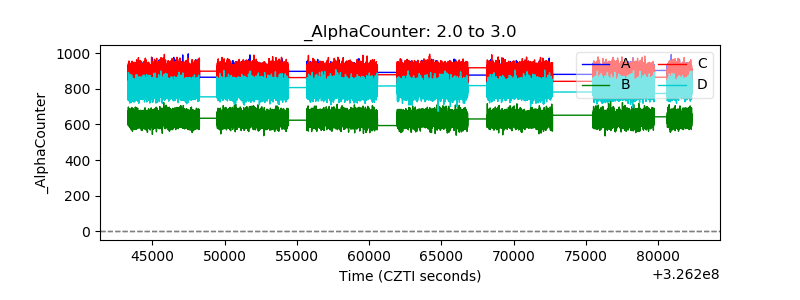 |
| _CPM_Rate | 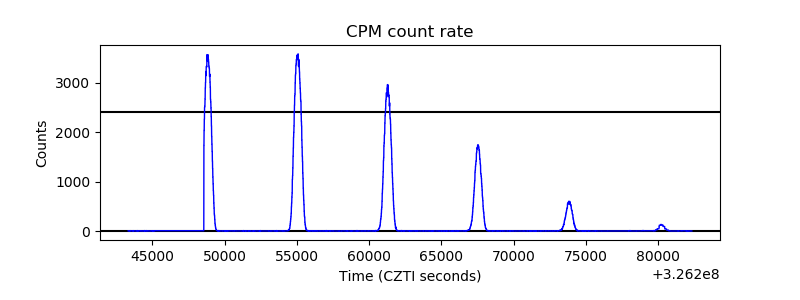 |
| CZT Counter | 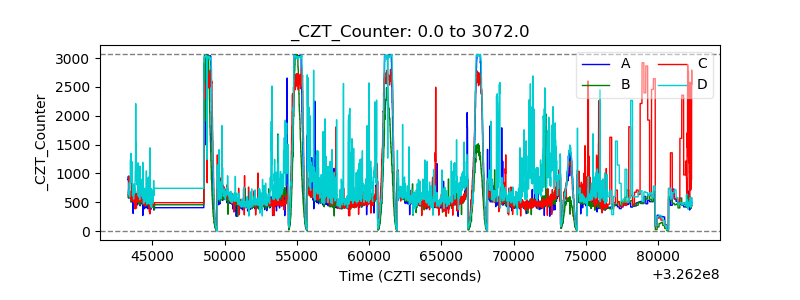 |
| +2.5 Volts monitor |  |
| +5 Volts monitor |  |
| _ROLL_ROT | 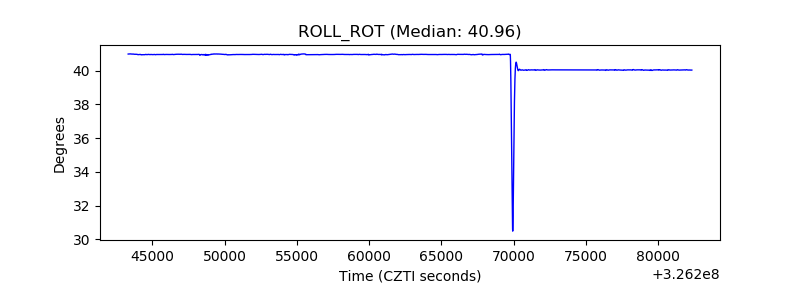 |
| _Roll_DEC | 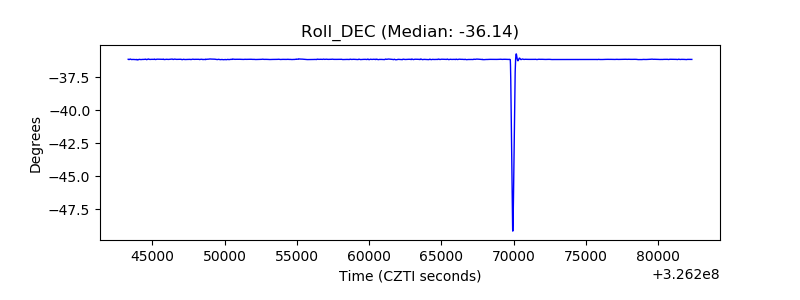 |
| _Roll_RA | 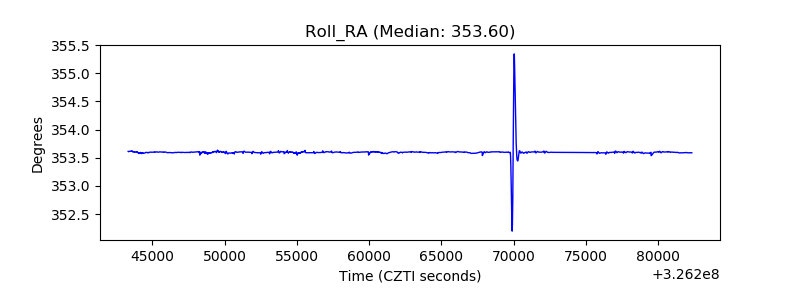 |
| Veto Counter |  |