| Param | Original file | Final file |
|---|---|---|
| Filename | modeM0/AS1A07_027T02_9000003640_24872cztM0_level2.evt | modeM0/AS1A07_027T02_9000003640_24872cztM0_level2_quad_clean.evt |
| Size (bytes) | 557,118,720 | 97,424,640 |
| Size | 531.3 MB | 92.9 MB |
| Events in quadrant A | 3,496,610 | 620,714 |
| Events in quadrant B | 3,617,609 | 628,396 |
| Events in quadrant C | 5,001,027 | 597,351 |
| Events in quadrant D | 4,266,052 | 599,520 |
| Mode SS | |||
|---|---|---|---|
| Quadrant | BADHDUFLAG | Total packets | Discarded packets |
| A | 0 | 148 | 0 |
| B | 0 | 148 | 0 |
| C | 0 | 148 | 0 |
| D | 0 | 148 | 0 |
| Mode M0 | |||
|---|---|---|---|
| Quadrant | BADHDUFLAG | Total packets | Discarded packets |
| A | 0 | 15120 | 2 |
| B | 0 | 15127 | 2 |
| C | 0 | 19659 | 2 |
| D | 0 | 17257 | 3 |
| Quadrant | Total seconds | Saturated seconds | Saturation percentage |
|---|---|---|---|
| A | 7227 | 218 | 3.016466% |
| B | 7228 | 233 | 3.223575% |
| C | 7228 | 458 | 6.336469% |
| D | 7227 | 235 | 3.251695% |
Noise dominated data is calculated using 1-second bins in cleaned event files. If a bin has >2000 counts, and if more than 50% of those come from <1% of pixels, then it is considered to be noise-dominated and hence unusable.
| Quadrant | # 1 sec bins | Bins with >0 counts | Bins with >2000 counts | High rate bins dominated by noise | Noise dominated (total time) | Noise dominated (detector-on time) | Marked lightcurve |
|---|---|---|---|---|---|---|---|
| A | 7342 | 7229 | 2 | 2 | 0.03% | 0.03% | 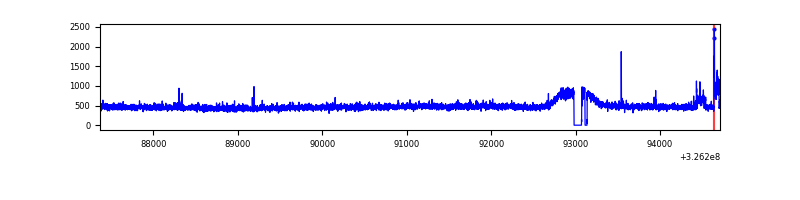 |
| B | 7343 | 7230 | 0 | 0 | 0.00% | 0.00% | 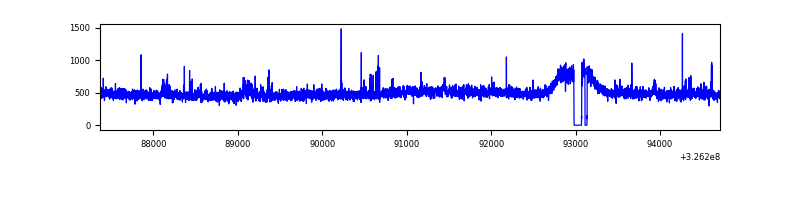 |
| C | 7343 | 7230 | 114 | 114 | 1.55% | 1.58% | 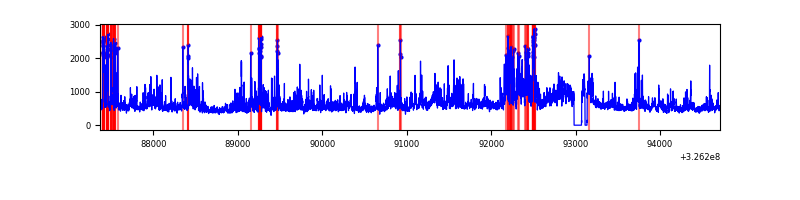 |
| D | 7342 | 7229 | 54 | 54 | 0.74% | 0.75% | 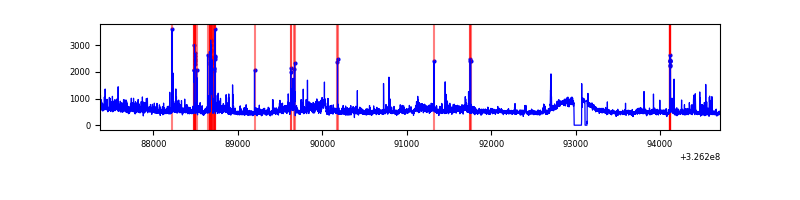 |
Top three noisy pixels from each quadrant. If the there are fewer than three noisy pixels in the level2.evt file, extra rows are filled as -1
| Pixel properties | Quadrant properties | ||||||
|---|---|---|---|---|---|---|---|
| Quadrant | DetID | PixID | Counts | Sigma | Mean | Median | Sigma |
| A | 6 | 16 | 78749 | 434.58 | 885 | 862 | 179.2 |
| A | 13 | 254 | 10632 | 54.51 | 885 | 862 | 179.2 |
| A | 3 | 137 | 8499 | 42.61 | 885 | 862 | 179.2 |
| B | 7 | 205 | 108435 | 633.58 | 874 | 850 | 169.8 |
| B | 0 | 189 | 22395 | 126.88 | 874 | 850 | 169.8 |
| B | 12 | 111 | 21131 | 119.44 | 874 | 850 | 169.8 |
| C | 7 | 247 | 1280880 | 6478.77 | 841 | 846 | 197.6 |
| C | 2 | 16 | 304783 | 1538.35 | 841 | 846 | 197.6 |
| C | 14 | 238 | 131939 | 663.52 | 841 | 846 | 197.6 |
| D | 8 | 195 | 517178 | 2438.34 | 870 | 844 | 211.8 |
| D | 7 | 238 | 266375 | 1253.94 | 870 | 844 | 211.8 |
| D | 1 | 52 | 187350 | 880.76 | 870 | 844 | 211.8 |
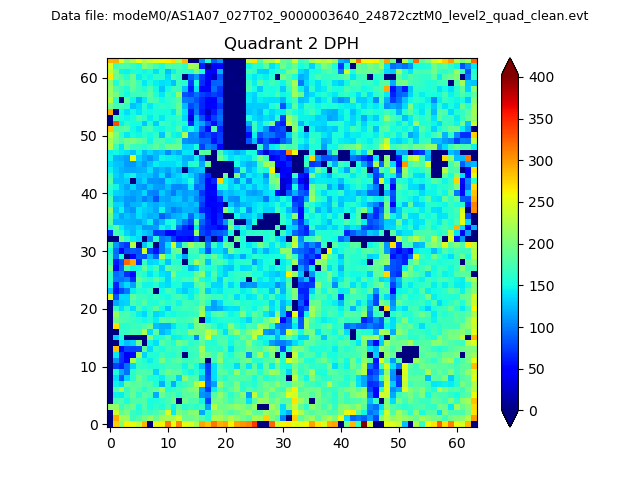
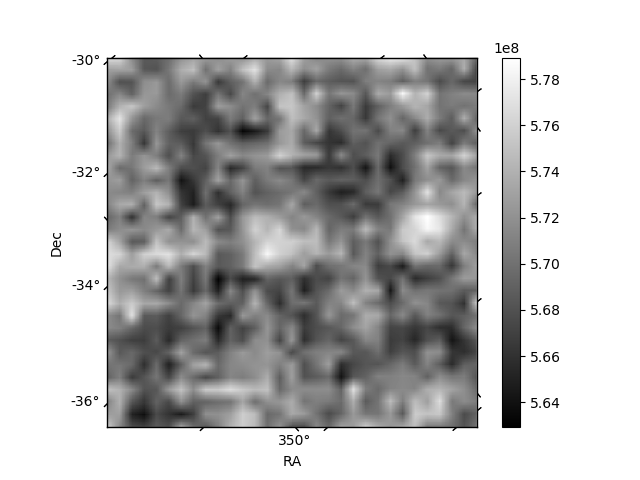
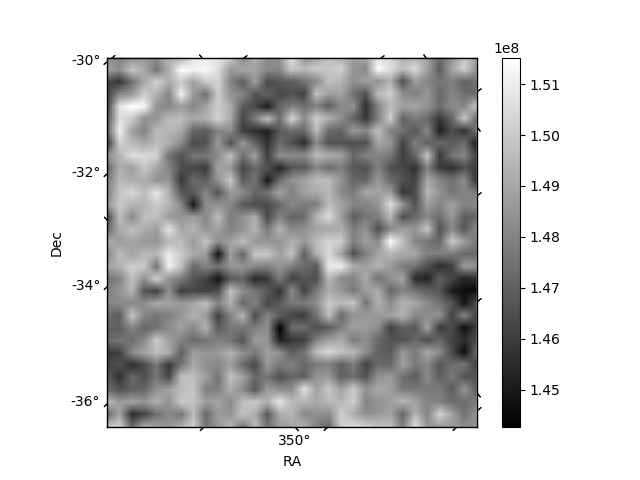
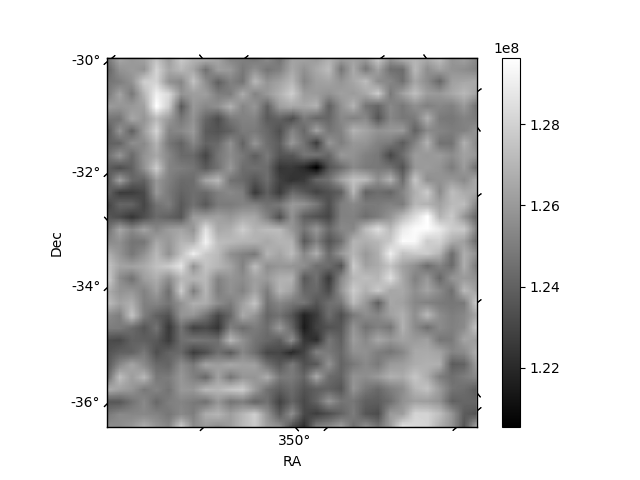
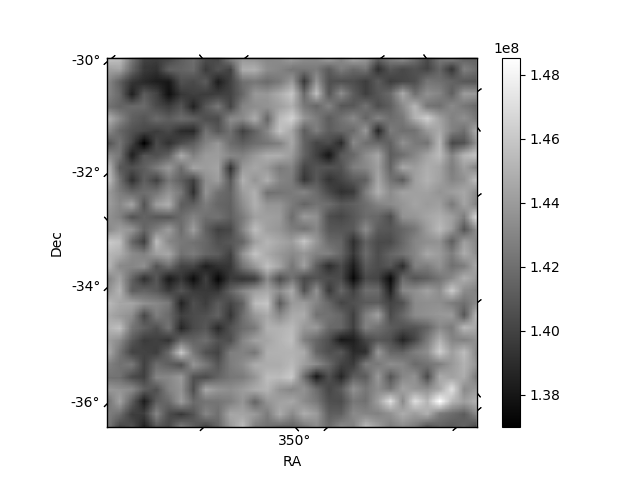
Histogram calculated using DETX and DETY for each event in the final _common_clean file
| Quadrant A | 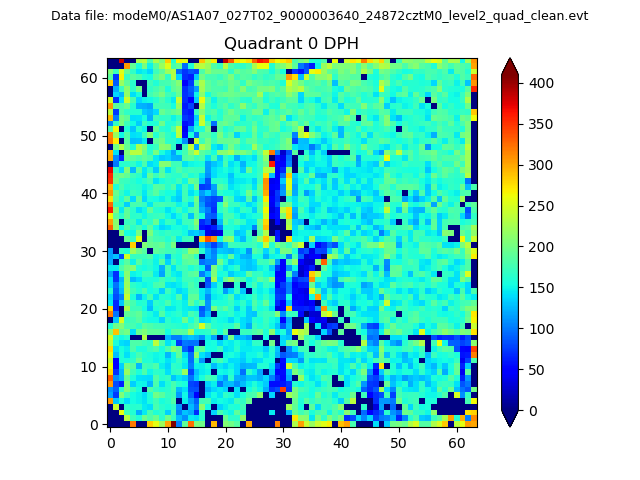 |
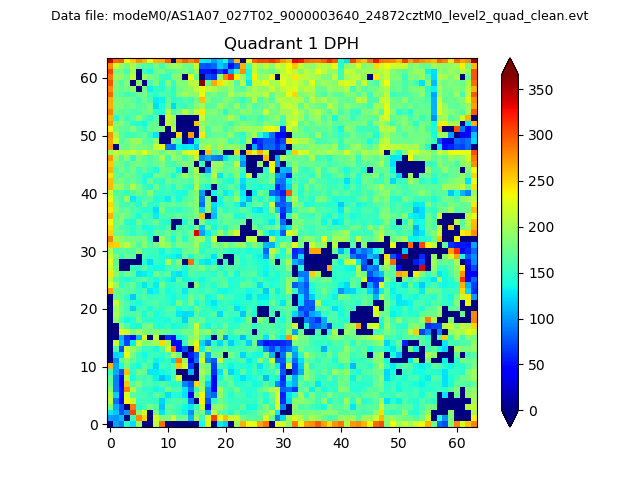 |
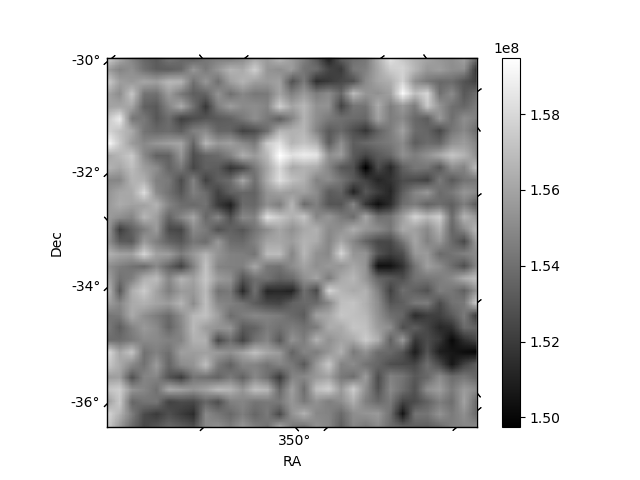
Quadrant B |
|---|---|---|---|
| Quadrant D | 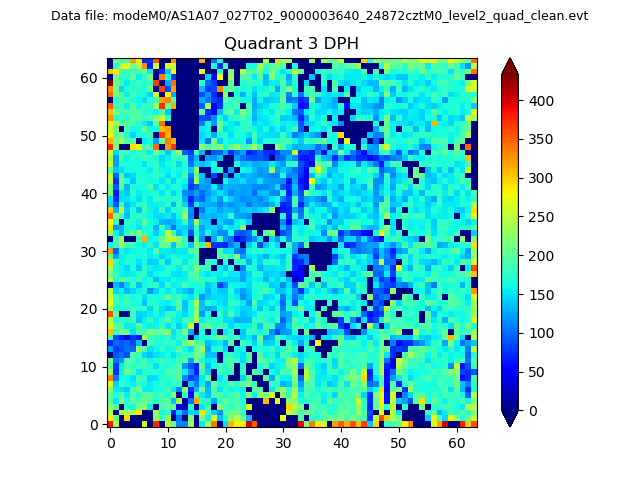 |
 |
Quadrant C |
| Plot type | Count rate plots | Images |
|---|---|---|
| Comparison with Poisson distribution Blue bars denote a histogram of data divided into 1 sec bins. Red curve is a Poisson curve with rate = median count rate of data. |
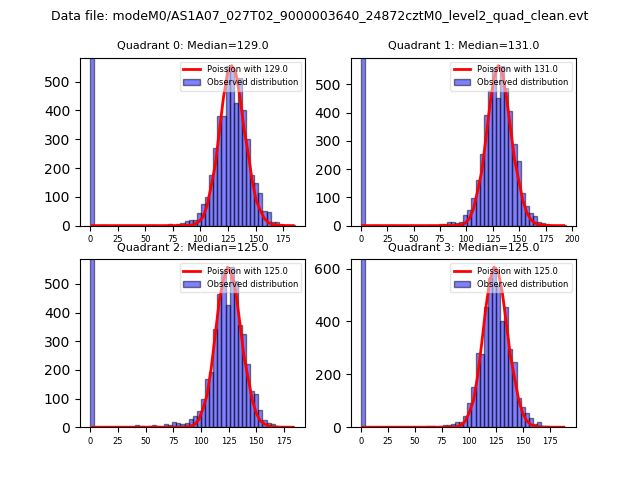 |
 |
| Quadrant-wise count rates Data is divided into 100 sec bins |
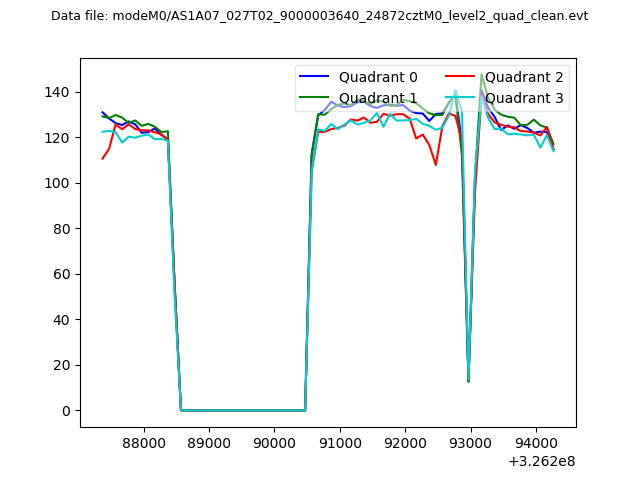 |
|
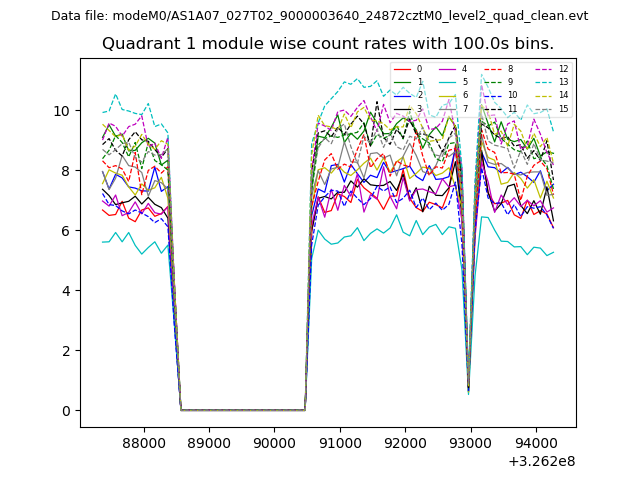
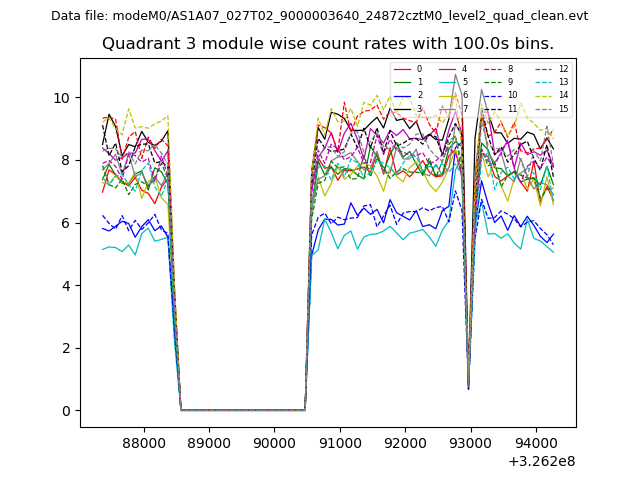
| Module-wise count rates for Quadrant A Data is divided into 100 sec bins |
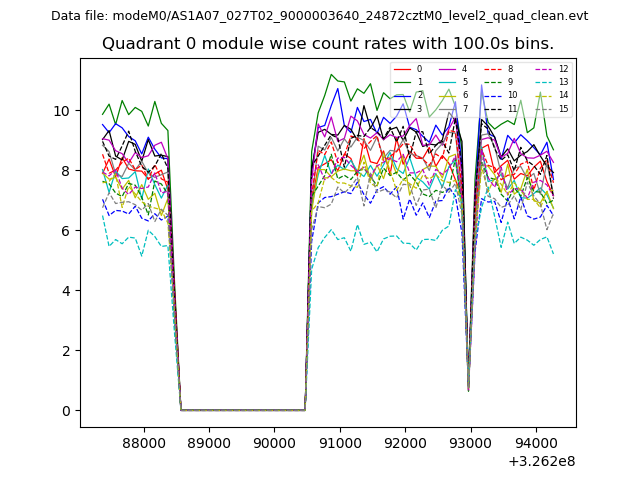 |
 |
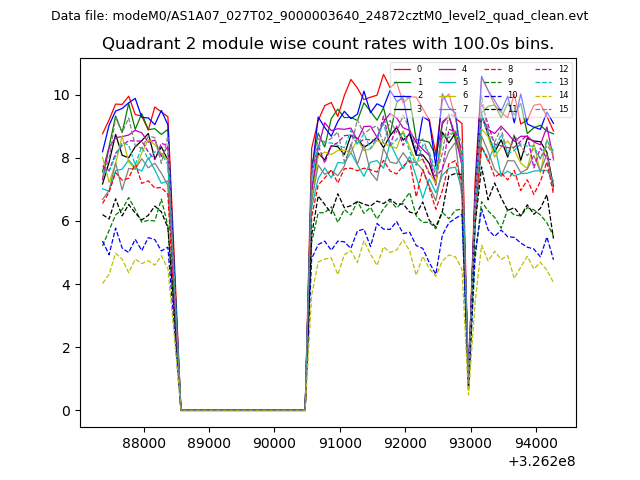
| Module-wise count rates for Quadrant B Data is divided into 100 sec bins |
 |
 |
| Module-wise count rates for Quadrant C Data is divided into 100 sec bins |
 |
 |
| Module-wise count rates for Quadrant D Data is divided into 100 sec bins |
 |
 |
| Parameter | Plot |
|---|---|
| CZT HV Monitor | 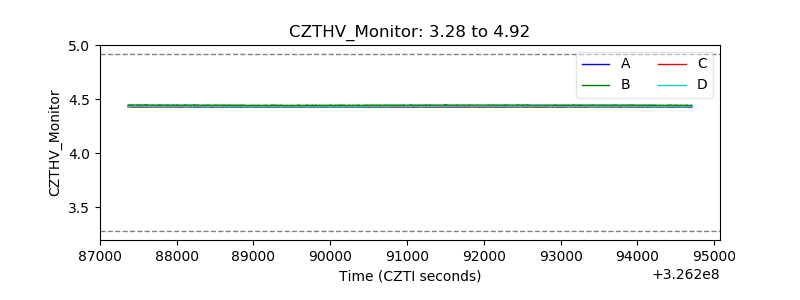 |
| D_VDD | 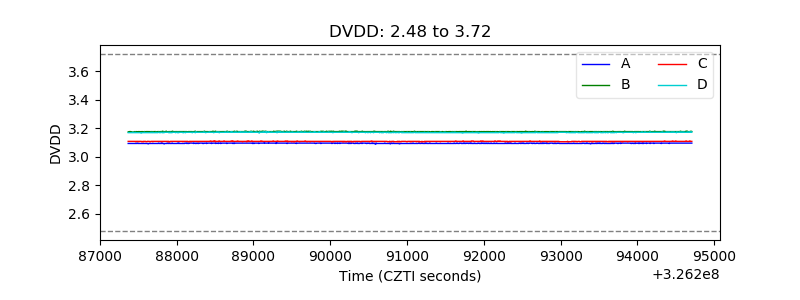 |
| Temperature 1 | 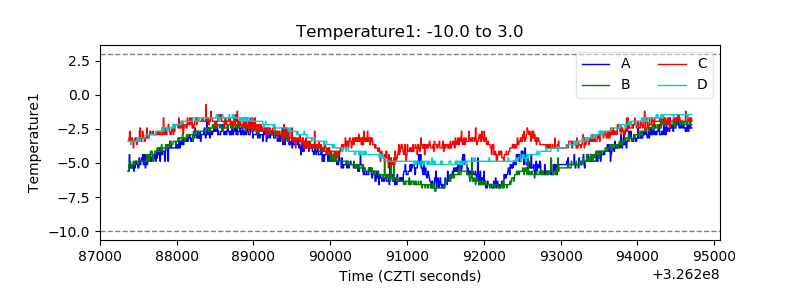 |
| Veto HV Monitor | 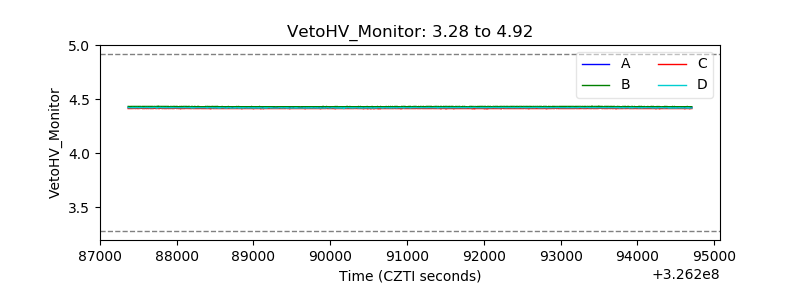 |
| Veto LLD | 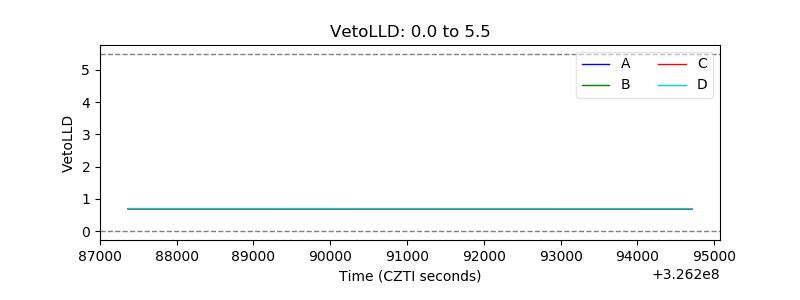 |
| Alpha Counter | 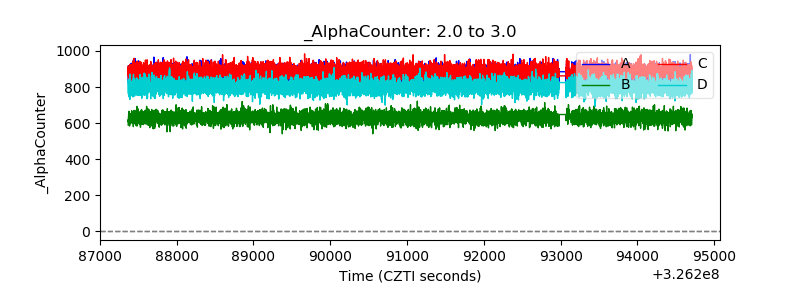 |
| _CPM_Rate | 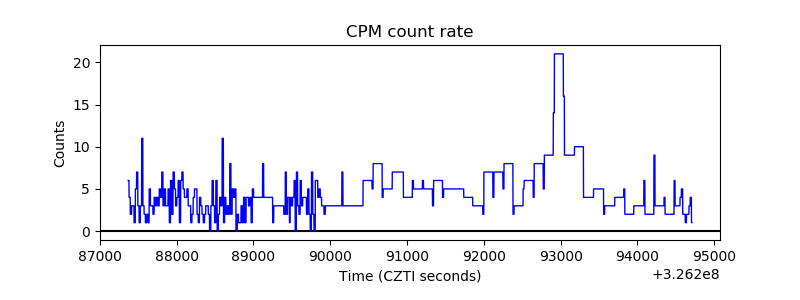 |
| CZT Counter | 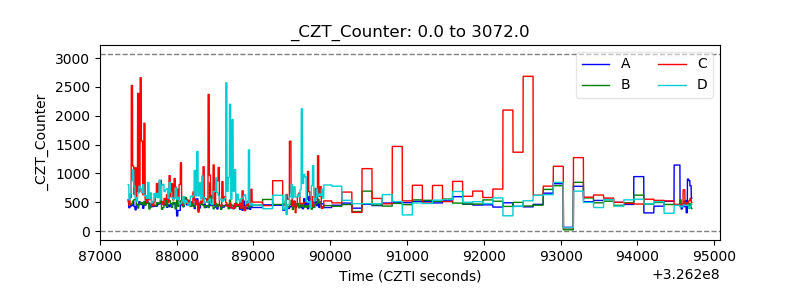 |
| +2.5 Volts monitor | 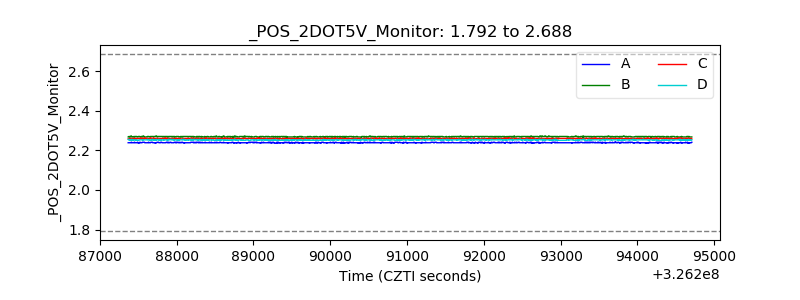 |
| +5 Volts monitor | 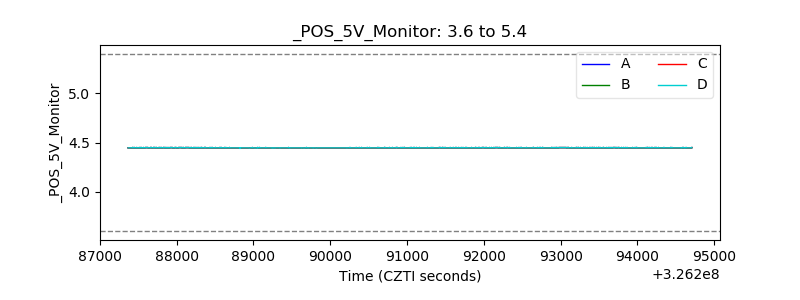 |
| _ROLL_ROT | 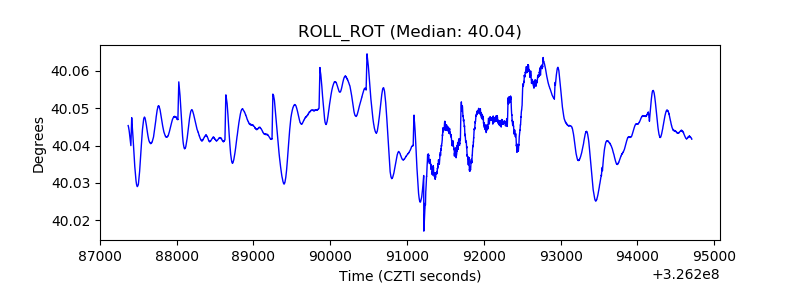 |
| _Roll_DEC | 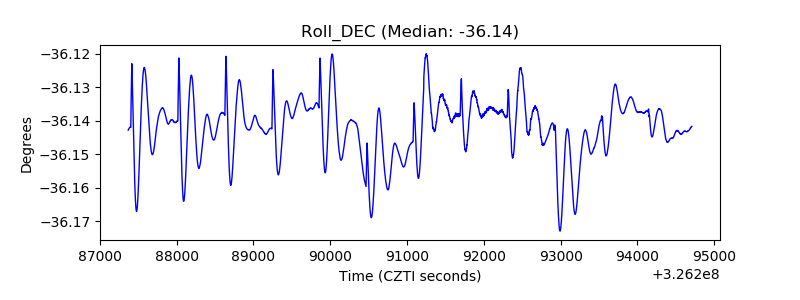 |
| _Roll_RA | 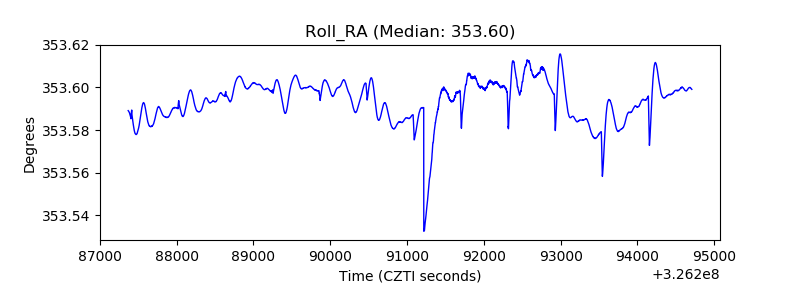 |
| Veto Counter | 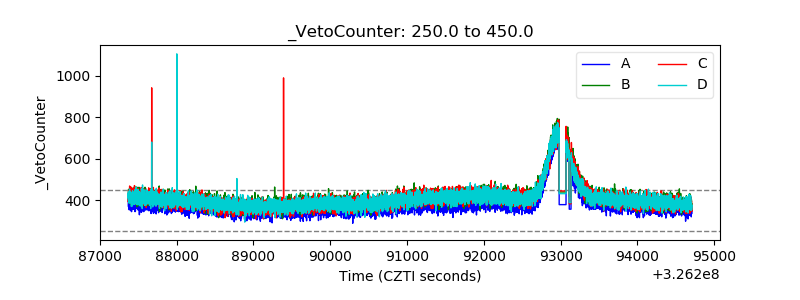 |