| Param | Original file | Final file |
|---|---|---|
| Filename | modeM0/AS1A07_027T02_9000003640_24873cztM0_level2.evt | modeM0/AS1A07_027T02_9000003640_24873cztM0_level2_quad_clean.evt |
| Size (bytes) | 559,869,120 | 89,268,480 |
| Size | 533.9 MB | 85.1 MB |
| Events in quadrant A | 4,534,976 | 557,799 |
| Events in quadrant B | 3,571,653 | 564,095 |
| Events in quadrant C | 4,409,607 | 542,087 |
| Events in quadrant D | 3,951,523 | 538,446 |
| Mode M9 | |||
|---|---|---|---|
| Quadrant | BADHDUFLAG | Total packets | Discarded packets |
| A | 0 | 3 | 0 |
| B | 0 | 3 | 0 |
| C | 0 | 3 | 0 |
| D | 0 | 3 | 0 |
| Mode SS | |||
|---|---|---|---|
| Quadrant | BADHDUFLAG | Total packets | Discarded packets |
| A | 0 | 146 | 0 |
| B | 0 | 146 | 0 |
| C | 0 | 146 | 0 |
| D | 0 | 146 | 0 |
| Mode M0 | |||
|---|---|---|---|
| Quadrant | BADHDUFLAG | Total packets | Discarded packets |
| A | 0 | 18089 | 1 |
| B | 0 | 14983 | 1 |
| C | 0 | 17471 | 1 |
| D | 0 | 16227 | 1 |
| Quadrant | Total seconds | Saturated seconds | Saturation percentage |
|---|---|---|---|
| A | 7189 | 447 | 6.217833% |
| B | 7190 | 166 | 2.308762% |
| C | 7189 | 310 | 4.312144% |
| D | 7189 | 154 | 2.142162% |
Noise dominated data is calculated using 1-second bins in cleaned event files. If a bin has >2000 counts, and if more than 50% of those come from <1% of pixels, then it is considered to be noise-dominated and hence unusable.
| Quadrant | # 1 sec bins | Bins with >0 counts | Bins with >2000 counts | High rate bins dominated by noise | Noise dominated (total time) | Noise dominated (detector-on time) | Marked lightcurve |
|---|---|---|---|---|---|---|---|
| A | 7469 | 7190 | 293 | 293 | 3.92% | 4.08% | 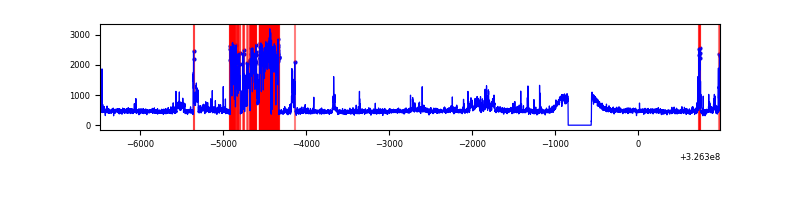 |
| B | 7470 | 7191 | 5 | 5 | 0.07% | 0.07% | 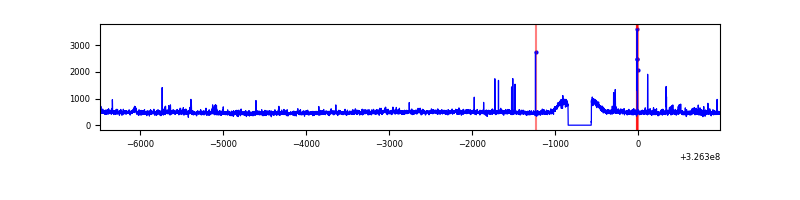 |
| C | 7469 | 7190 | 91 | 91 | 1.22% | 1.27% | 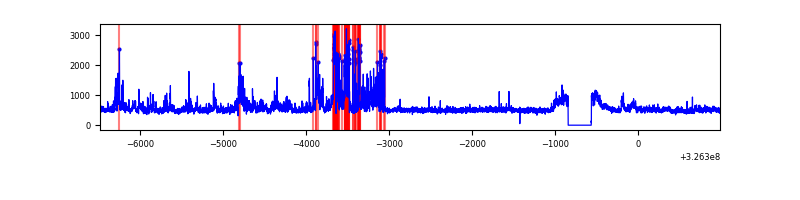 |
| D | 7469 | 7190 | 47 | 47 | 0.63% | 0.65% | 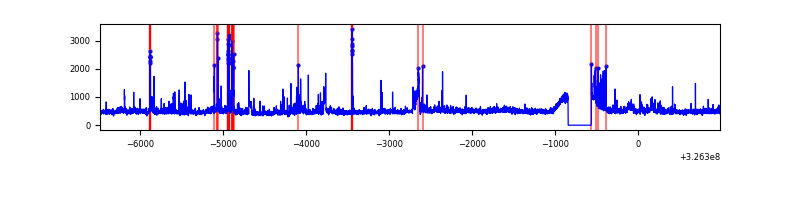 |
Top three noisy pixels from each quadrant. If the there are fewer than three noisy pixels in the level2.evt file, extra rows are filled as -1
| Pixel properties | Quadrant properties | ||||||
|---|---|---|---|---|---|---|---|
| Quadrant | DetID | PixID | Counts | Sigma | Mean | Median | Sigma |
| A | 6 | 16 | 1125049 | 6428.49 | 864 | 843 | 174.9 |
| A | 4 | 2 | 76364 | 431.85 | 864 | 843 | 174.9 |
| A | 13 | 254 | 10422 | 54.78 | 864 | 843 | 174.9 |
| B | 7 | 205 | 83738 | 501.78 | 862 | 841 | 165.2 |
| B | 0 | 190 | 35102 | 207.39 | 862 | 841 | 165.2 |
| B | 12 | 111 | 21031 | 122.21 | 862 | 841 | 165.2 |
| C | 7 | 247 | 923534 | 4718.59 | 833 | 837 | 195.5 |
| C | 14 | 238 | 132118 | 671.36 | 833 | 837 | 195.5 |
| C | 2 | 16 | 102308 | 518.91 | 833 | 837 | 195.5 |
| D | 7 | 238 | 282787 | 1363.54 | 852 | 828 | 206.8 |
| D | 1 | 52 | 261884 | 1262.46 | 852 | 828 | 206.8 |
| D | 8 | 195 | 173592 | 835.48 | 852 | 828 | 206.8 |
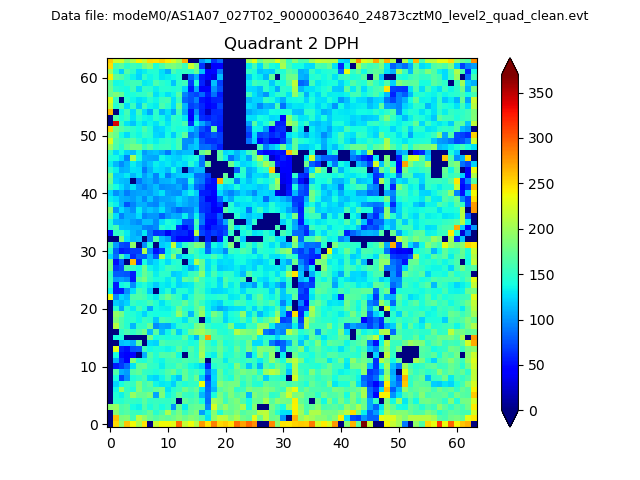
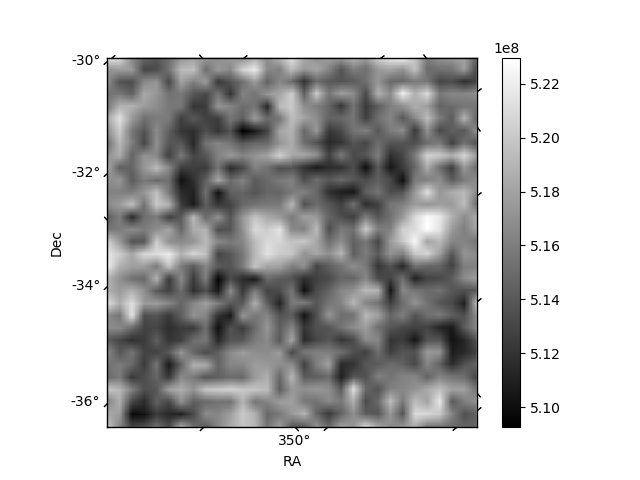
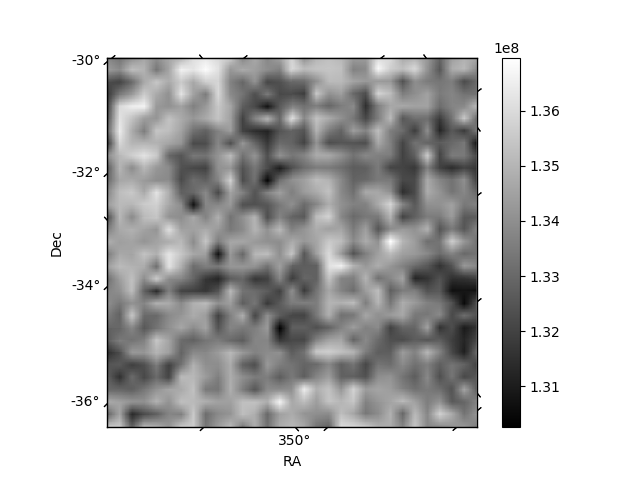
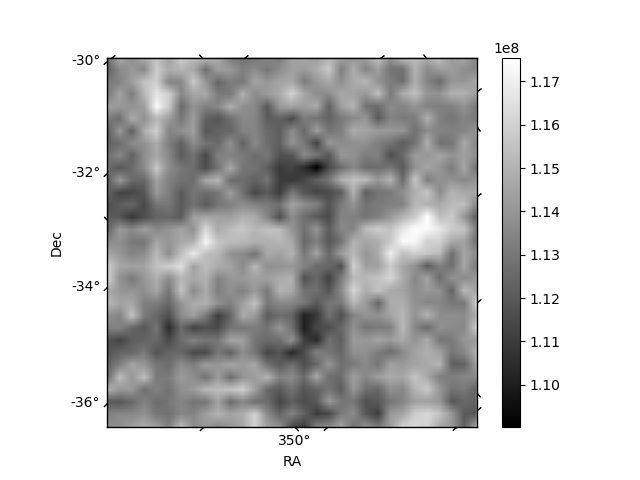
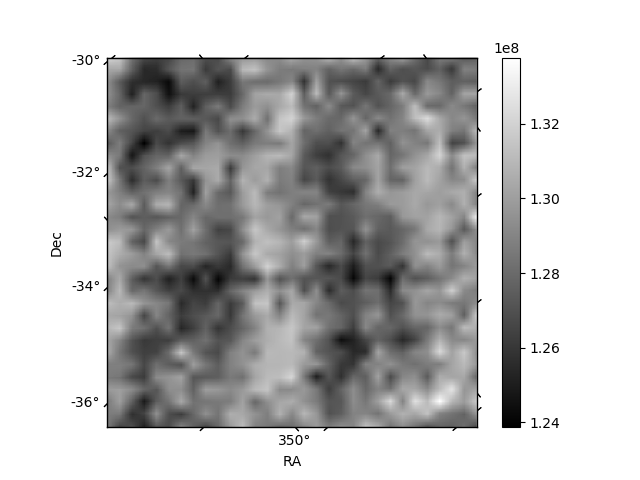
Histogram calculated using DETX and DETY for each event in the final _common_clean file
| Quadrant A | 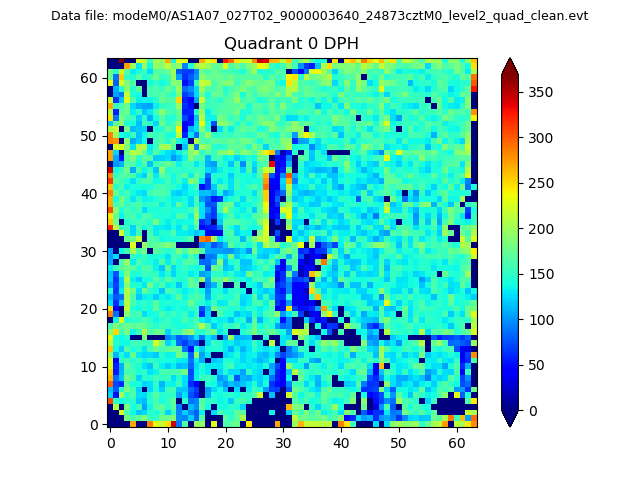 |
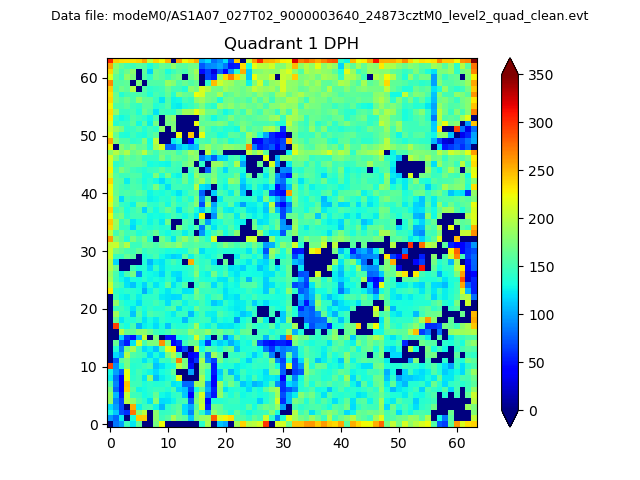 |
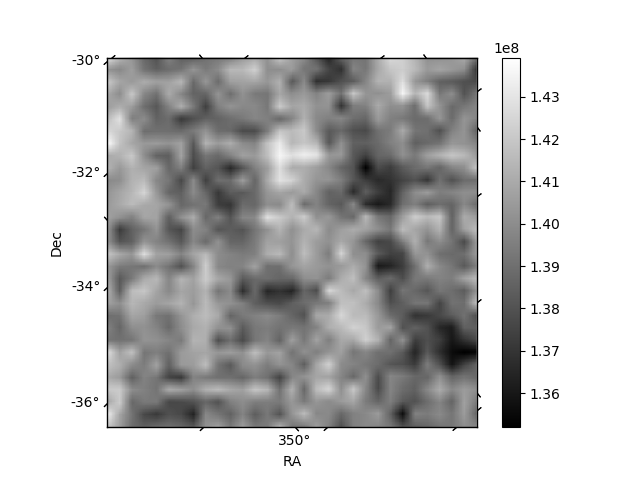
Quadrant B |
|---|---|---|---|
| Quadrant D | 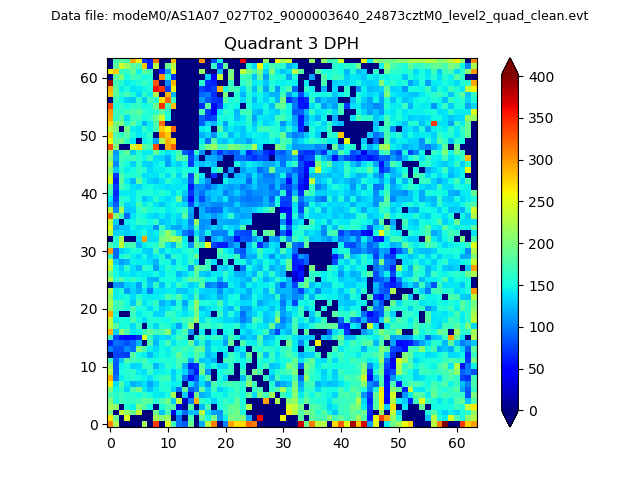 |
 |
Quadrant C |
| Plot type | Count rate plots | Images |
|---|---|---|
| Comparison with Poisson distribution Blue bars denote a histogram of data divided into 1 sec bins. Red curve is a Poisson curve with rate = median count rate of data. |
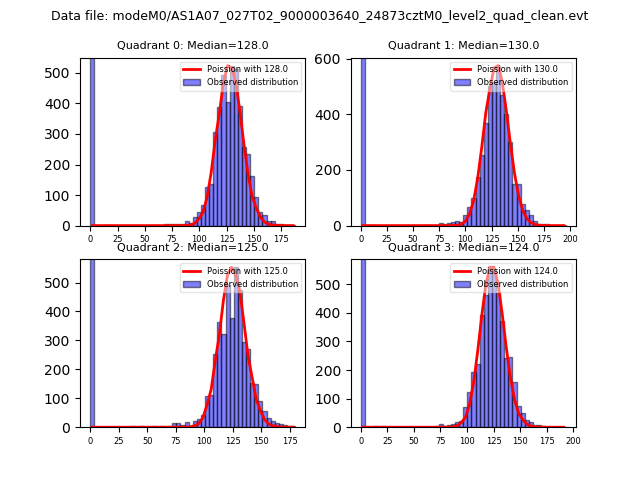 |
 |
| Quadrant-wise count rates Data is divided into 100 sec bins |
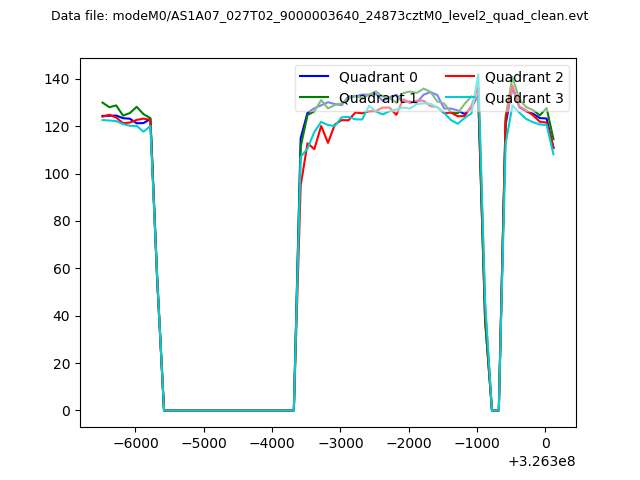 |
|
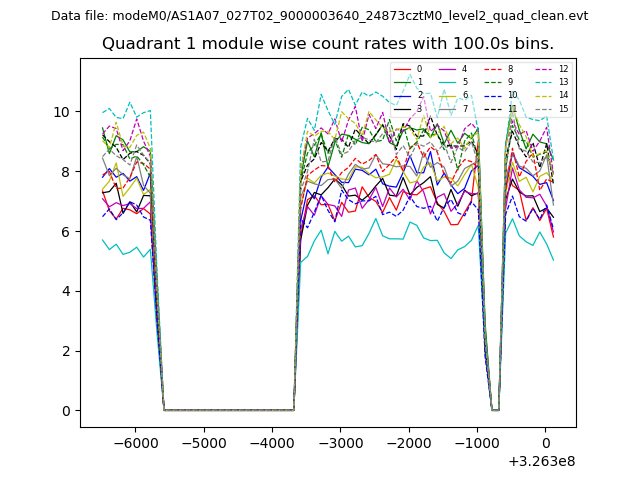
| Module-wise count rates for Quadrant A Data is divided into 100 sec bins |
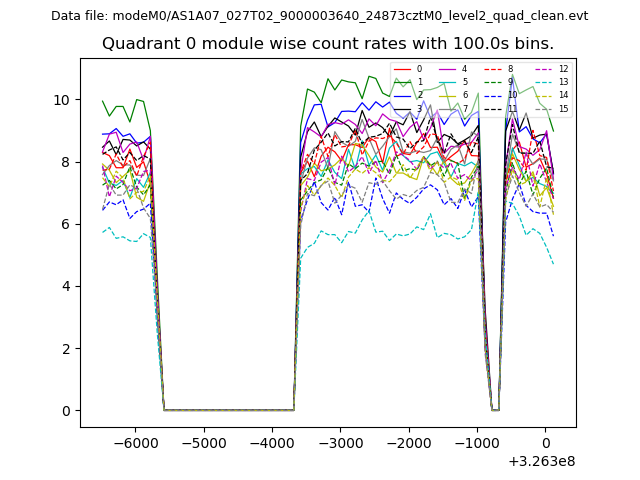 |
 |
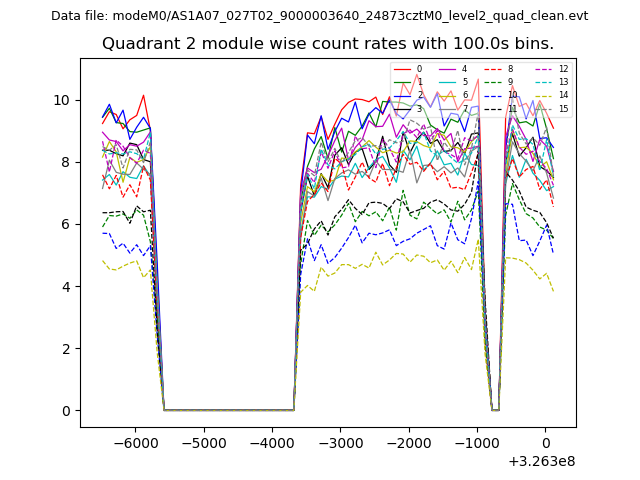
| Module-wise count rates for Quadrant B Data is divided into 100 sec bins |
 |
 |
| Module-wise count rates for Quadrant C Data is divided into 100 sec bins |
 |
 |
| Module-wise count rates for Quadrant D Data is divided into 100 sec bins |
 |
 |
| Parameter | Plot |
|---|---|
| CZT HV Monitor | 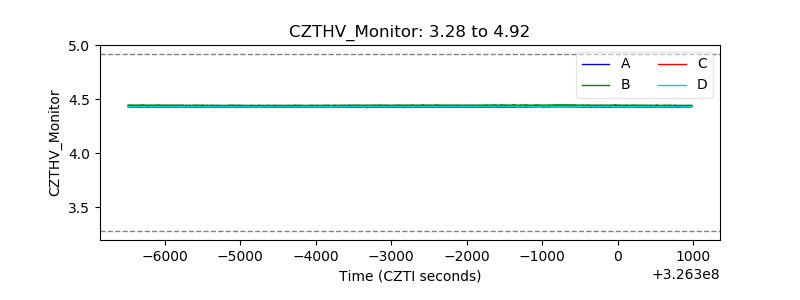 |
| D_VDD | 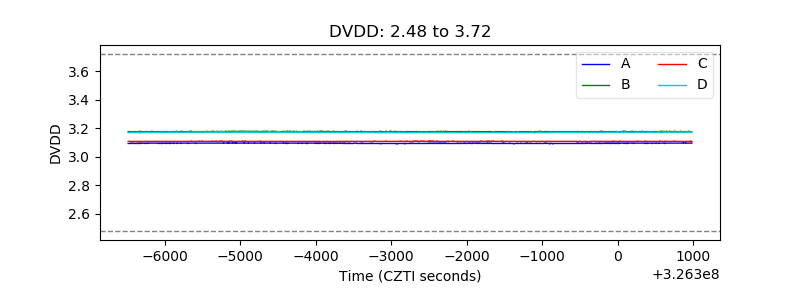 |
| Temperature 1 | 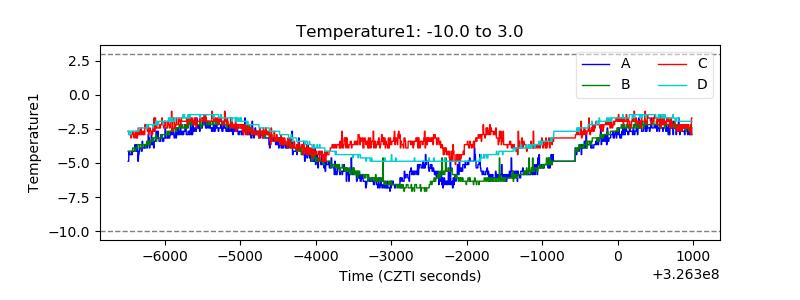 |
| Veto HV Monitor | 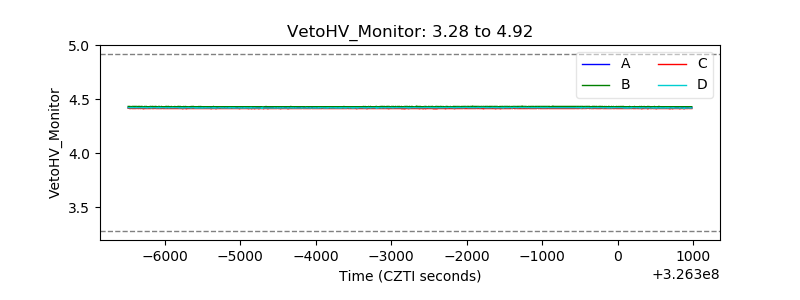 |
| Veto LLD |  |
| Alpha Counter | 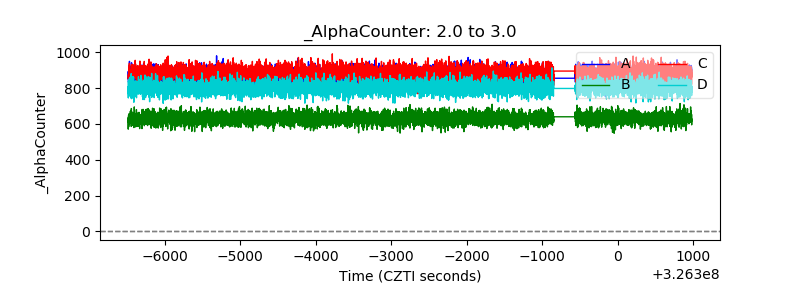 |
| _CPM_Rate | 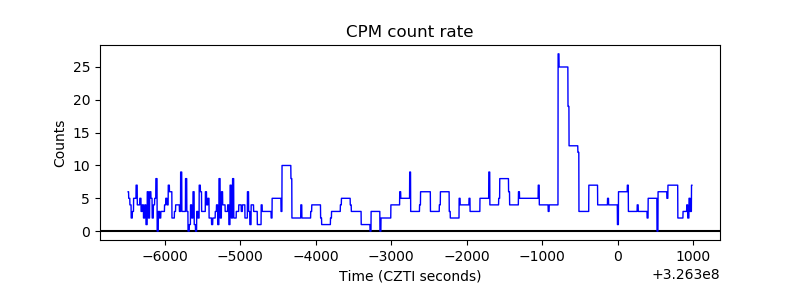 |
| CZT Counter | 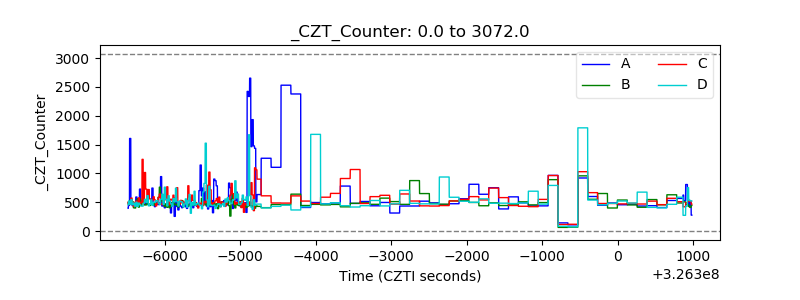 |
| +2.5 Volts monitor |  |
| +5 Volts monitor |  |
| _ROLL_ROT |  |
| _Roll_DEC | 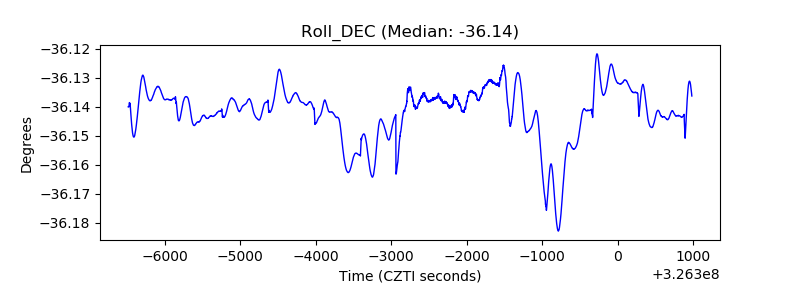 |
| _Roll_RA | 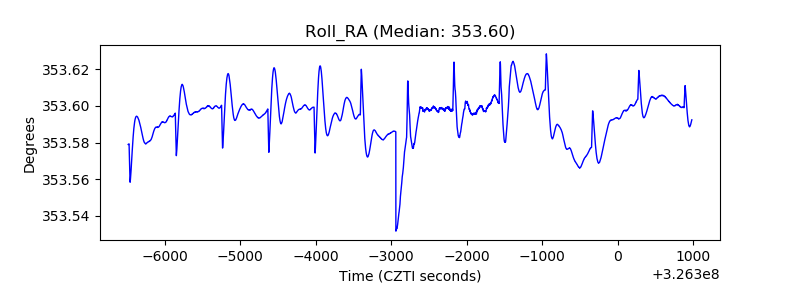 |
| Veto Counter |  |