| Param | Original file | Final file |
|---|---|---|
| Filename | modeM0/AS1A07_027T02_9000003640_24876cztM0_level2.evt | modeM0/AS1A07_027T02_9000003640_24876cztM0_level2_quad_clean.evt |
| Size (bytes) | 596,211,840 | 90,757,440 |
| Size | 568.6 MB | 86.6 MB |
| Events in quadrant A | 4,023,830 | 551,364 |
| Events in quadrant B | 4,074,562 | 555,223 |
| Events in quadrant C | 4,748,631 | 526,964 |
| Events in quadrant D | 4,635,940 | 527,703 |
| Mode M9 | |||
|---|---|---|---|
| Quadrant | BADHDUFLAG | Total packets | Discarded packets |
| A | 0 | 5 | 0 |
| B | 0 | 5 | 0 |
| C | 0 | 5 | 0 |
| D | 0 | 5 | 0 |
| Mode SS | |||
|---|---|---|---|
| Quadrant | BADHDUFLAG | Total packets | Discarded packets |
| A | 0 | 172 | 0 |
| B | 0 | 172 | 0 |
| C | 0 | 172 | 0 |
| D | 0 | 172 | 0 |
| Mode M0 | |||
|---|---|---|---|
| Quadrant | BADHDUFLAG | Total packets | Discarded packets |
| A | 0 | 17556 | 1 |
| B | 0 | 17493 | 1 |
| C | 0 | 19401 | 1 |
| D | 0 | 19100 | 1 |
| Quadrant | Total seconds | Saturated seconds | Saturation percentage |
|---|---|---|---|
| A | 8447 | 101 | 1.195691% |
| B | 8448 | 100 | 1.183712% |
| C | 8448 | 224 | 2.651515% |
| D | 8448 | 96 | 1.136364% |
Noise dominated data is calculated using 1-second bins in cleaned event files. If a bin has >2000 counts, and if more than 50% of those come from <1% of pixels, then it is considered to be noise-dominated and hence unusable.
| Quadrant | # 1 sec bins | Bins with >0 counts | Bins with >2000 counts | High rate bins dominated by noise | Noise dominated (total time) | Noise dominated (detector-on time) | Marked lightcurve |
|---|---|---|---|---|---|---|---|
| A | 8952 | 8448 | 20 | 20 | 0.22% | 0.24% | 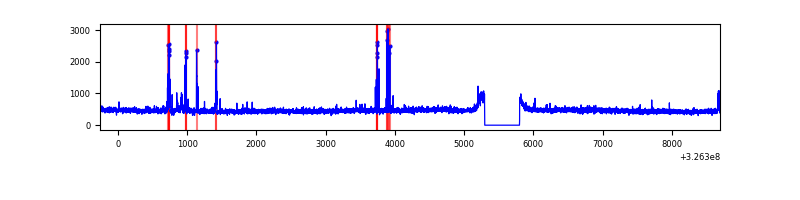 |
| B | 8953 | 8449 | 15 | 15 | 0.17% | 0.18% | 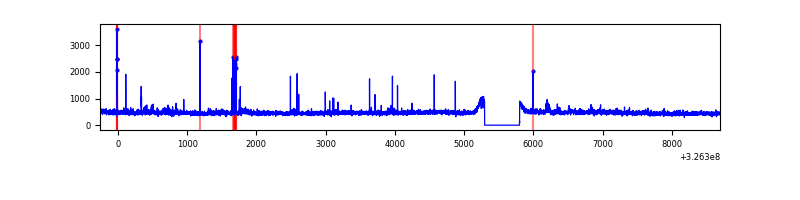 |
| C | 8953 | 8449 | 90 | 90 | 1.01% | 1.07% | 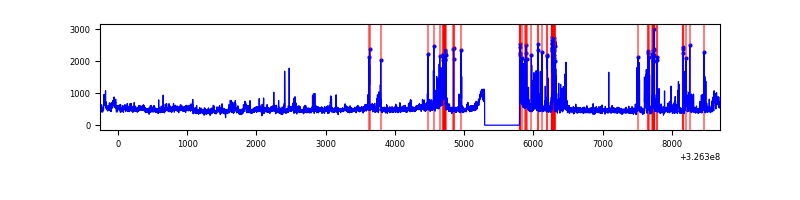 |
| D | 8953 | 8449 | 51 | 51 | 0.57% | 0.60% | 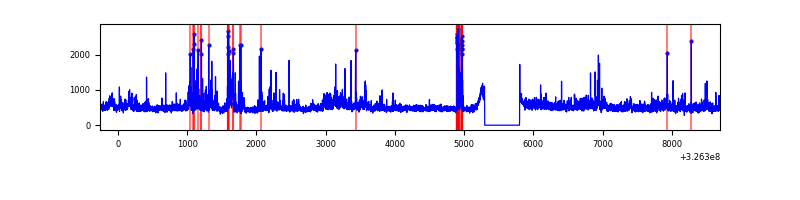 |
Top three noisy pixels from each quadrant. If the there are fewer than three noisy pixels in the level2.evt file, extra rows are filled as -1
| Pixel properties | Quadrant properties | ||||||
|---|---|---|---|---|---|---|---|
| Quadrant | DetID | PixID | Counts | Sigma | Mean | Median | Sigma |
| A | 4 | 2 | 82851 | 401.73 | 1004 | 979 | 203.8 |
| A | 6 | 16 | 52280 | 251.73 | 1004 | 979 | 203.8 |
| A | 4 | 208 | 16087 | 74.13 | 1004 | 979 | 203.8 |
| B | 0 | 189 | 53461 | 276.1 | 993 | 966 | 190.1 |
| B | 10 | 249 | 41993 | 215.78 | 993 | 966 | 190.1 |
| B | 7 | 205 | 33945 | 173.45 | 993 | 966 | 190.1 |
| C | 7 | 247 | 824542 | 3678.73 | 954 | 959 | 223.9 |
| C | 14 | 238 | 150520 | 668.05 | 954 | 959 | 223.9 |
| C | 2 | 16 | 53824 | 236.13 | 954 | 959 | 223.9 |
| D | 8 | 195 | 412540 | 1734.31 | 976 | 949 | 237.3 |
| D | 1 | 52 | 395559 | 1662.76 | 976 | 949 | 237.3 |
| D | 7 | 238 | 138469 | 579.47 | 976 | 949 | 237.3 |
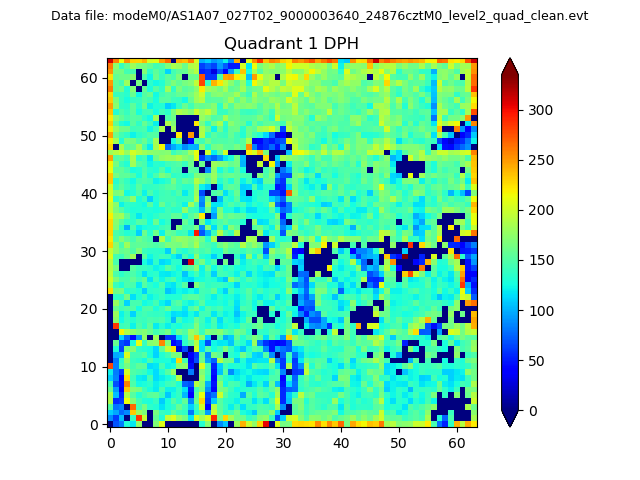
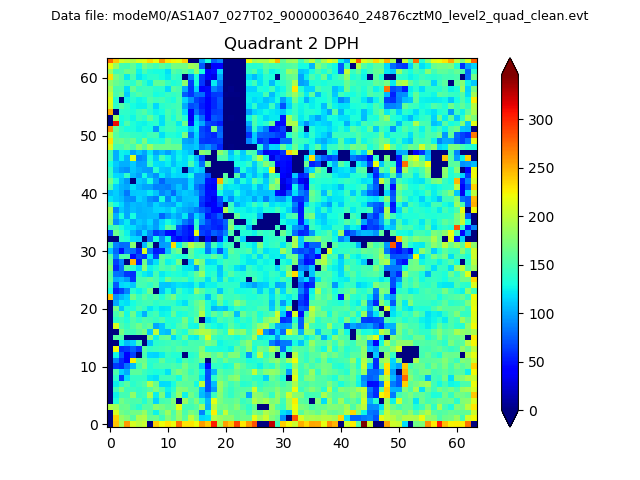
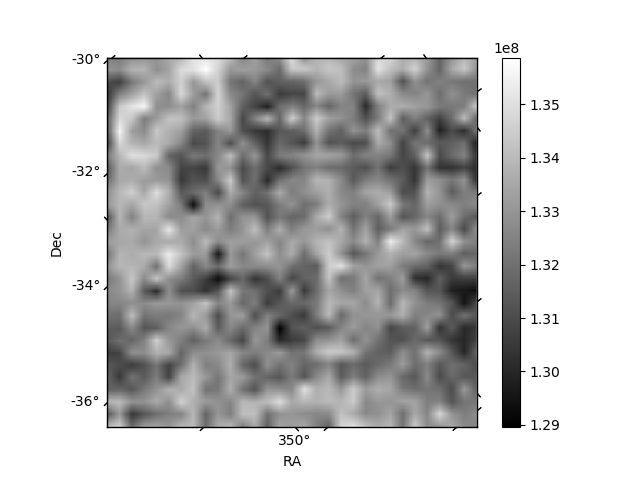
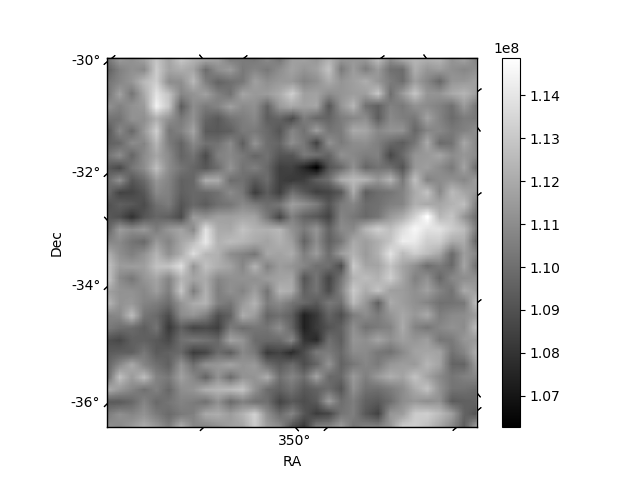
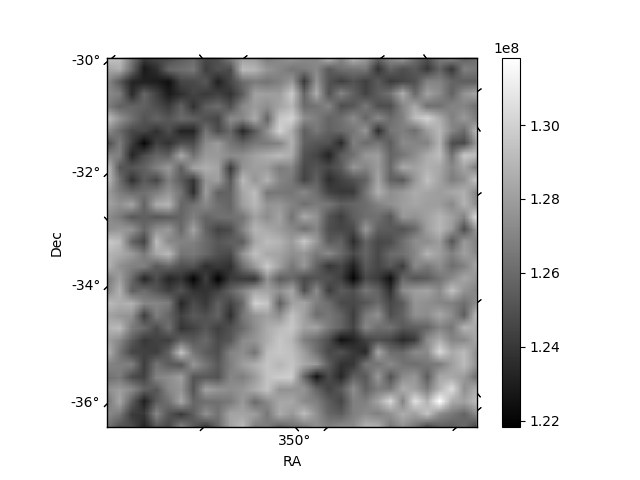
Histogram calculated using DETX and DETY for each event in the final _common_clean file
| Quadrant A |  |
 |
Quadrant B |
|---|---|---|---|
| Quadrant D |  |
 |
Quadrant C |
| Plot type | Count rate plots | Images |
|---|---|---|
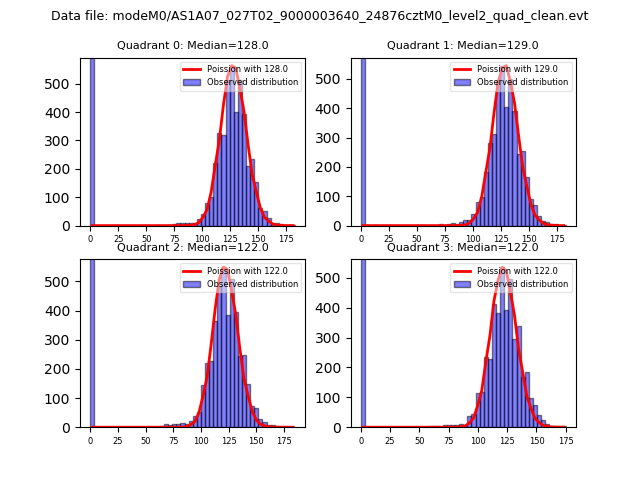
| Comparison with Poisson distribution Blue bars denote a histogram of data divided into 1 sec bins. Red curve is a Poisson curve with rate = median count rate of data. |
 |
 |
| Quadrant-wise count rates Data is divided into 100 sec bins |
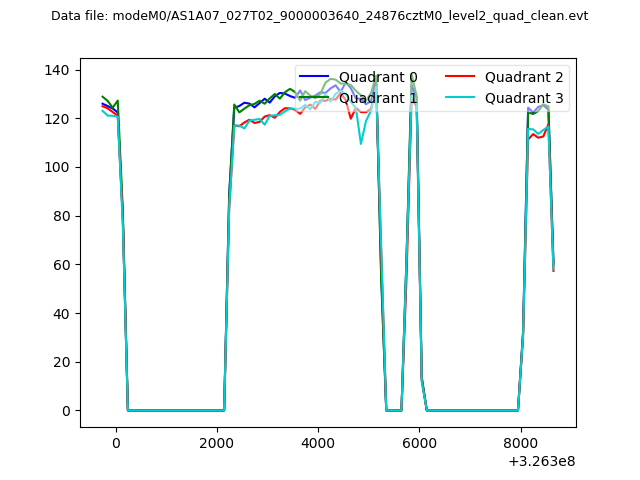 |
|
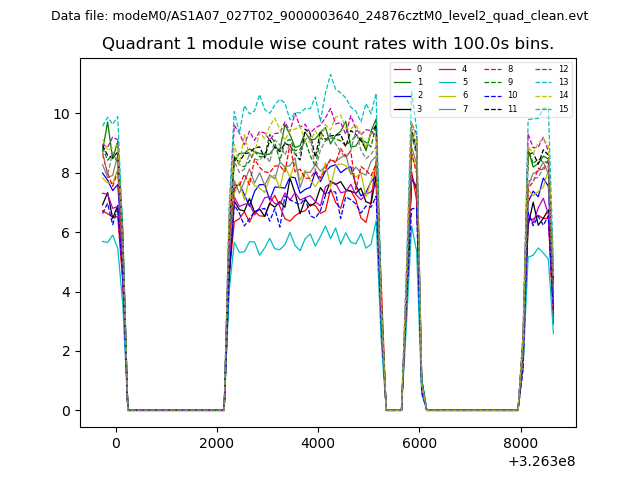
| Module-wise count rates for Quadrant A Data is divided into 100 sec bins |
 |
 |
| Module-wise count rates for Quadrant B Data is divided into 100 sec bins |
 |
 |
| Module-wise count rates for Quadrant C Data is divided into 100 sec bins |
 |
 |
| Module-wise count rates for Quadrant D Data is divided into 100 sec bins |
 |
 |
| Parameter | Plot |
|---|---|
| CZT HV Monitor | 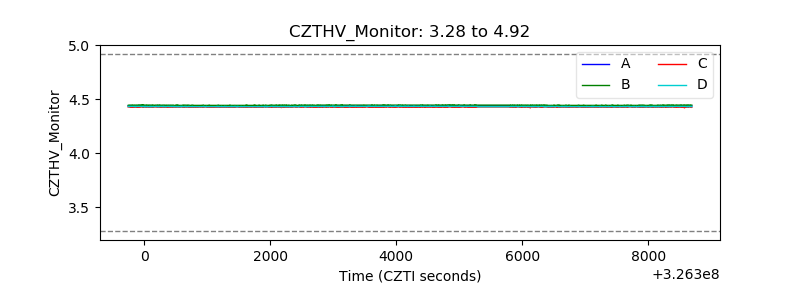 |
| D_VDD | 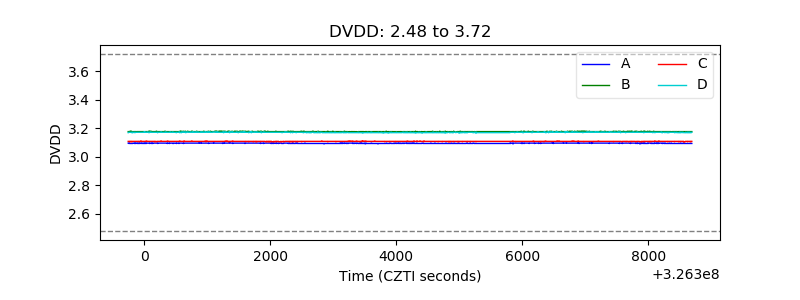 |
| Temperature 1 | 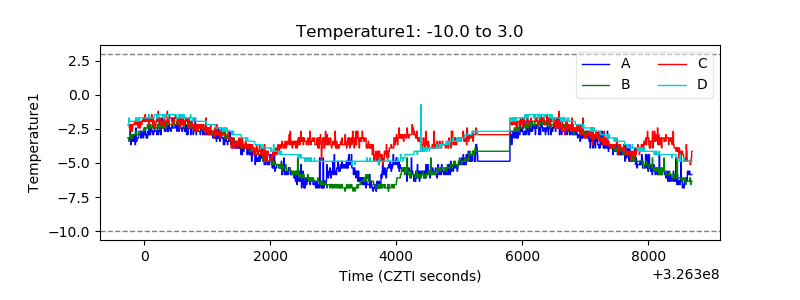 |
| Veto HV Monitor | 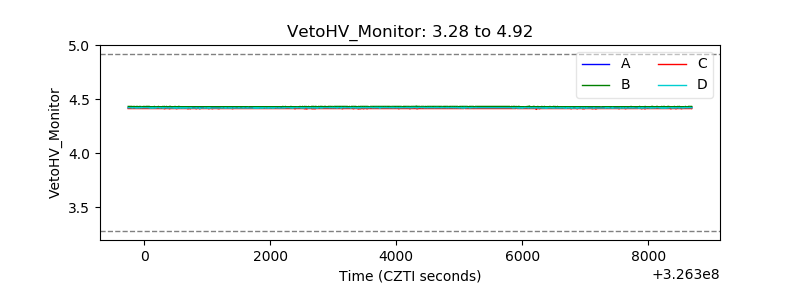 |
| Veto LLD | 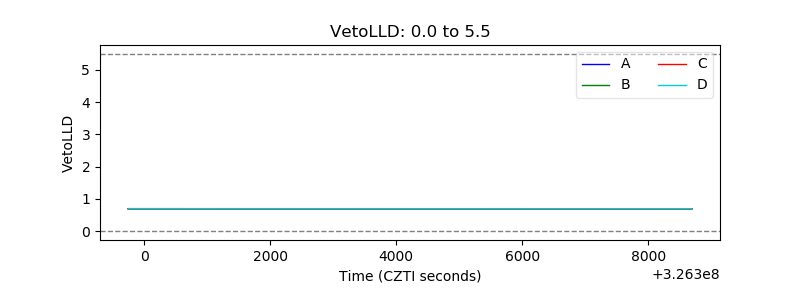 |
| Alpha Counter | 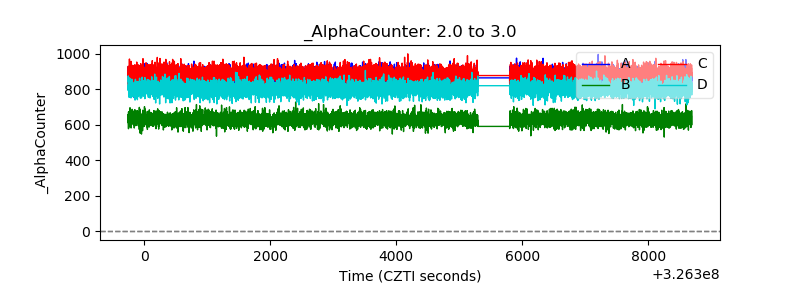 |
| _CPM_Rate | 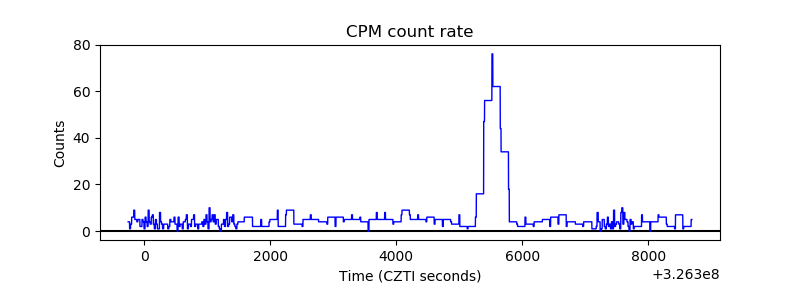 |
| CZT Counter | 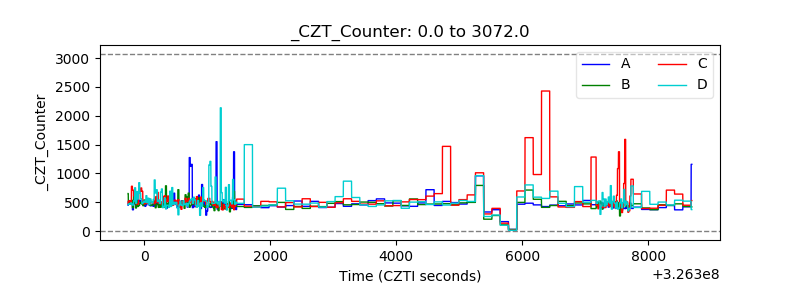 |
| +2.5 Volts monitor |  |
| +5 Volts monitor |  |
| _ROLL_ROT |  |
| _Roll_DEC | 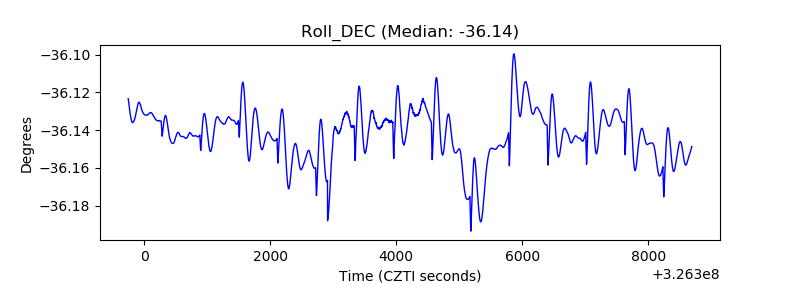 |
| _Roll_RA | 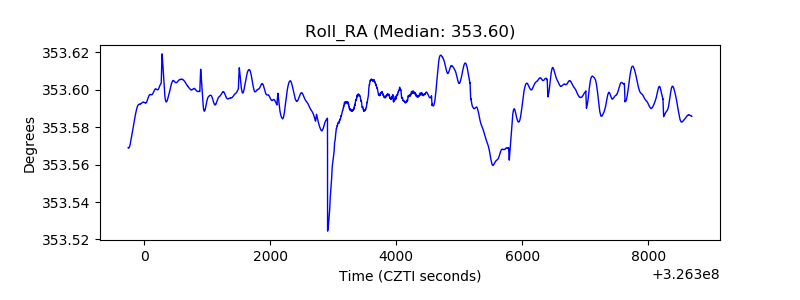 |
| Veto Counter |  |